RVI SD Band Oscillator | BinMastaThe RVI SD Band Oscillator is a momentum-based indicator that enhances trend analysis using the Relative Vigor Index (RVI) with Standard Deviation (SD) Bands. It refines signals by incorporating a signal line and dynamically adjusting bands based on market volatility.
Core Components:
RVI Calculation: Measures price momentum relative to past movements.
Signal Line: A smoothed version of RVI to identify crossovers.
SD Bands: Standard deviation-based boundaries to gauge overbought/oversold conditions.
Trading Logic:
Trend Direction: Determined by RVI crossover with the signal line.
Momentum Confirmation: Identifies shifts in buying and selling strength.
Trade Signals:
Bullish when the trend is up & the signal is near the lower band.
Bearish when the trend is down & the signal is near the upper band.
Visual Features:
Colored candles highlight potential trend shifts.
Signal line plot provides additional confirmation.
Disclaimer:
This indicator is for educational purposes only and should not be considered financial advice. Past performance is not indicative of future results. Always conduct your own analysis and risk management before making trading decisions. 🚀
"momentum" için komut dosyalarını ara
Adapted RSI w/ Multi-Asset Regime Detection v1.1The relative strength index (RSI) is a momentum indicator used in technical analysis. RSI measures the speed and magnitude of an asset's recent price changes to detect overbought or oversold conditions in the price of said asset.
In addition to identifying overbought and oversold assets, the RSI can also indicate whether your desired asset may be primed for a trend reversal or a corrective pullback in price. It can signal when to buy and sell.
The RSI will oscillate between 0 and 100. Traditionally, an RSI reading of 70 or above indicates an overbought condition. A reading of 30 or below indicates an oversold condition.
The RSI is one of the most popular technical indicators. I intend to offer a fresh spin.
Adapted RSI w/ Multi-Asset Regime Detection
Our Adapted RSI makes necessary improvements to the original Relative Strength Index (RSI) by combining multi-timeframe analysis with multi-asset monitoring and providing traders with an efficient way to analyse market-wide conditions across different timeframes and assets simultaneously. The indicator automatically detects market regimes and generates clear signals based on RSI levels, presenting this data in an organised, easy-to-read format through two dynamic tables. Simplicity is key, and having access to more RSI data at any given time, allows traders to prepare more effectively, especially when trading markets that "move" together.
How we calculate the RSI
First, the RSI identifies price changes between periods, calculating gains and losses from one look-back period to the next. This look-back period averages gains and losses over 14 periods, which in this case would be 14 days, and those gains/losses are calculated based on the daily closing price. For example:
Average Gain = Sum of Gains over the past 14 days / 14
Average Loss = Sum of Losses over the past 14 days / 14
Then we calculate the Relative Strength (RS):
RS = Average Gain / Average Loss
Finally, this is converted to the RSI value:
RSI = 100 - (100 / (1 + RS))
Key Features
Our multi-timeframe RSI indicator enhances traditional technical analysis by offering synchronised Daily, Weekly, and Monthly RSI readings with automatic regime detection. The multi-asset monitoring system allows tracking of up to 10 different assets simultaneously, with pre-configured major pairs that can be customised to any asset selection. The signal generation system provides clear market guidance through automatic regime detection and a five-level signal system, all presented through a sophisticated visual interface with dynamic RSI line colouring and customisable display options.
Quick Guide to Use it
Begin by adding the indicator to your chart and configuring your preferred assets in the "Asset Comparison" settings.
Position the two information tables according to your preference.
The main table displays RSI analysis across three timeframes for your current asset, while the asset table shows a comparative analysis of all monitored assets.
Signals are colour-coded for instant recognition, with green indicating bullish conditions and red for bearish conditions. Pay special attention to regime changes and signal transitions, using multi-timeframe confluence to identify stronger signals.
How it Works (Regime Detection & Signals)
When we say 'Regime', a regime is determined by a persistent trend or in this case momentum and by leveraging this for RSI, which is a momentum oscillator, our indicator employs a relatively simple regime detection system that classifies market conditions as either Bullish (RSI > 50) or Bearish (RSI < 50). Our benchmark between a trending bullish or bearish market is equal to 50. By leveraging a simple classification system helps determine the probability of trend continuation and the weight given to various signals. Whilst we could determine a Neutral regime for consolidating markets, we have employed a 'neutral' signal generation which will be further discussed below...
Signal generation occurs across five distinct levels:
Strong Buy (RSI < 15)
Buy (RSI < 30)
Neutral (RSI 30-70)
Sell (RSI > 70)
Strong Sell (RSI > 85)
Each level represents different market conditions and probability scenarios. For instance, extreme readings (Strong Buy/Sell) indicate the highest probability of mean reversion, while neutral readings suggest equilibrium conditions where traders should focus on the overall regime bias (Bullish/Bearish momentum).
This approach offers traders a new and fresh spin on a popular and well-known tool in technical analysis, allowing traders to make better and more informed decisions from the well presented information across multiple assets and timeframes. Experienced and beginner traders alike, I hope you enjoy this adaptation.

Momentum Divergence SignalDescription:
The Momentum Divergence Signal is a powerful tool that identifies potential trend reversals by analyzing the interaction between price movements and main oscillators. It highlights moments when price action diverges from the following, which can be a key signal of a trend shift. The most important aspect of this indicator is its ability to detect bullish and bearish divergences.
Coming to the critical part, it is highly recommended to pair this indicator with another trend confirmation tool for improved decision-making, as it works on catching both trend continuation and reversal signals, but it is always favored to match use it as a trend continuation entry provider.
Core Functionality:
Session-Based Signals:
The indicator limits signals to specific market sessions: the Asian, London, and US sessions, optimizing trade opportunities during active trading hours.
Cooldown Mechanism:
To prevent signal spamming, a cooldown period of at least 8 bars is required between each signal, ensuring that new signals are spaced out and not over-generating.
Divergence with Trend Confirmation:
While the RSI divergence alone can highlight potential trend shifts, this script is best paired with other trend-following indicators to filter out false signals. This ensures that the divergence signal is part of a broader, more reliable trend-following strategy.
Visual Components:
Buy and Sell Arrows: Visual arrows on the chart where the divergence occurs, accompanied by "Buy" and "Sell" labels in white to clearly indicate the signal points.
Advanced Concepts:
Divergence as a Reversal Signal: The key strength of this indicator lies in detecting divergences that can indicate a trend reversal. Divergences often precede significant changes in price direction, offering potential opportunities for traders to enter or exit positions before the trend fully shifts.
Pairing with Trend Confirmation Indicators: Since divergence signals can sometimes produce false positives, the most effective use of this tool comes when paired with a trend-following indicator (such as moving averages or price action analysis) to validate the reversal signals.
Applications:
Trend Reversal Detection: Monitor for divergences between price action and RSI to identify potential trend reversals. These signals are most useful when combined with trend confirmation tools to ensure the validity of the reversal.
Strategic Use in Trend-Following Systems: This indicator is best employed within a trend-following strategy where it serves as an additional confirmation signal for market shifts. While it can identify potential reversal points, its strength lies in its ability to identify shifts in momentum within an ongoing trend.
Real-Time Visual Feedback: The "Buy" and "Sell" signals, that are displayed directly on the chart, providing real-time context for traders.
Disclaimer: This indicator is designed for informational purposes only and should not be considered financial advice. Traders should combine it with other market analysis tools and perform their own research before making trading decisions.

Trendfilter AD1
The "Trendfilter AD1" indicator is a versatile tool for trend detection that combines volume changes, price ranges, ATR (Average True Range), and moving averages. It also considers the momentum of True High/Low over a specified period (PROFF). The indicator integrates various mathematical calculations to measure market trends and volatility. Key features include the use of Powerbar colors, which indicate significant activity from large market participants.
Trendfilter LW
The Trendfilter LW section of the script calculates trend strength by comparing short-term and long-term simple moving averages (SMA) of closing prices, and by assessing cumulative price differences. The result is displayed as a histogram, with positive values indicating bullish trends and negative values indicating bearish trends. This helps traders visualize the strength and direction of long-term and short-term trends.
Trendfilter SP
The Trendfilter SP section combines volume changes, ATR data, and Z-score calculations to smooth out trend signals and provide a clearer assessment of market trends. It uses these data points to filter out noise and highlight significant trend changes. The combined Z-score, smoothed by an EMA, offers precise trend indications and helps traders identify whether the prevailing market forces are bullish or bearish.
What is it for?
The indicator helps traders identify trends and assess market volatility. By combining volume and price movements, it highlights potential trend reversals and shifts in market strength. The calculation of True High/Low (PROFF) measures market momentum over a set period, providing insights into price dynamics. The indicator also uses color-coded bars to represent different levels of market activity and trend strength, with Powerbar colors specifically highlighting major market moves driven by large traders.
How is it used?
Traders can customize the indicator through settings such as Volume Change Periods, EMA periods, and the True High/Low period (PROFF). The indicator generates signals based on significant volume and price fluctuations, with trends displayed through color-coded bars. The Trendfilter LW section calculates trend strength using SMA and cumulative price differences, while the Trendfilter SP section combines volume and ATR data with Z-score calculations to smooth out trend signals. These elements together provide a clear picture of market direction and strength.
Uptrick: Adaptive Volatility Oscillator### **Overview and Purpose**
The **"Uptrick: Adaptive Volatility Oscillator"** is a sophisticated technical analysis tool designed to identify and visualize volatility trends within the financial markets. This indicator is particularly useful for traders and analysts who seek to understand the market's underlying momentum by analyzing the relationship between volume and price changes. It adapts to changing market conditions, providing a dynamic way to gauge overbought and oversold levels, identify potential reversals, and track the strength of market movements.
### **Core Components**
1. **Volume Oscillator Calculation**:
- **Purpose**: The volume oscillator is at the heart of this indicator. It measures the directional momentum of volume by comparing current volume levels with those of previous periods.
- **How It Works**: The oscillator calculates the difference between current and past volume levels, determining whether the market is experiencing buying or selling pressure. This is normalized to ensure the oscillator's values are comparable across different time frames and market conditions.
- **Normalized Oscillator**: To make the oscillator's readings more meaningful, the values are normalized by adjusting for standard deviation over a long period (150 bars). This step helps in smoothing out the noise and highlights significant shifts in market activity.
2. **Adaptive Filter Calculation**:
- **Purpose**: The adaptive filter refines the raw oscillator data to create a smoother signal that is responsive to market changes without being overly reactive to minor fluctuations.
- **Adaptive Coefficient**: This coefficient, set by the user, controls the sensitivity of the filter. A higher coefficient makes the filter more sensitive to recent changes, while a lower coefficient gives more weight to past data.
- **How It Works**: The filter applies a weighted average to the oscillator values, where recent data is given more importance. This creates a dynamic signal that adapts to the market's changing conditions, highlighting significant trends and potential turning points.
3. **Signal Line**:
- **Purpose**: The signal line serves as a benchmark for the filtered oscillator values, providing a basis for comparison to determine the current trend's strength.
- **Smoothing**: The signal line is smoothed over a user-defined period to ensure it represents the underlying trend accurately. This smoothing process reduces the noise and allows traders to focus on the more meaningful movements.
4. **Overbought/Oversold Zones**:
- **Purpose**: These zones help traders identify when the market is potentially overstretched and due for a correction. They are crucial for timing entry and exit points.
- **Thresholds**: The user-defined thresholds represent levels where the oscillator values are considered extreme. When the oscillator crosses these levels, it signals that the market may be overbought or oversold.
- **Visual Cues**: The indicator plots these zones on the chart, making it easy for traders to see when the market enters these critical areas. This visualization is vital for spotting potential reversals or continuations in the trend.
5. **Histogram Visualization**:
- **Purpose**: The histogram provides a visual representation of the volatility in the market, making it easier to interpret the oscillator's readings.
- **Color Coding**: The histogram bars are color-coded based on the filtered oscillator's relationship with the signal line. Green bars indicate a positive momentum (bullish), while red bars indicate negative momentum (bearish). This color-coding helps traders quickly assess the market's current state.
- **Intensity of Movement**: The height and color intensity of the histogram bars reflect the strength of the underlying trend. Higher bars with more intense colors signify stronger market movements.
6. **Buy and Sell Signals**:
- **Purpose**: The indicator provides explicit buy and sell signals based on the oscillator's interaction with the signal line and the overbought/oversold thresholds.
- **Buy Signal**: A buy signal is generated when the filtered oscillator crosses above the signal line while in the oversold zone. This suggests that the market may be reversing upwards from an oversold condition.
- **Sell Signal**: Conversely, a sell signal is generated when the filtered oscillator crosses below the signal line while in the overbought zone, indicating a potential downward reversal from an overbought condition.
- **Visual Representation**: These signals are visually represented on the chart with specific symbols, such as green circles for buy signals and red circles for sell signals, making them easy to spot.
### **Usefulness and Applications**
1. **Trend Identification**:
- The indicator is highly effective in identifying the current trend and its strength. By analyzing the relationship between the oscillator and the signal line, traders can determine whether the market is in an uptrend, downtrend, or ranging. The adaptive nature of the filter ensures that the trend signals remain relevant even as market conditions change.
2. **Volatility Analysis**:
- Understanding market volatility is crucial for risk management and strategy development. This indicator provides a clear view of how volatility is evolving, helping traders adjust their strategies accordingly. For example, higher volatility might suggest the need for tighter stop losses or more conservative position sizes.
3. **Overbought/Oversold Detection**:
- The overbought and oversold zones are essential for identifying potential reversal points. These zones can be used to time entries and exits, particularly in markets that are prone to mean reversion. The visual cues provided by the indicator make it easier to spot when the market might be overstretched.
4. **Adaptive Filtering**:
- The adaptive filter is a significant advantage of this indicator. Unlike static filters, which might lag or react too quickly to noise, the adaptive filter adjusts to the market's pace. This makes the indicator versatile, suitable for different market conditions, and less prone to giving false signals.
5. **Visual Clarity**:
- The indicator is designed with visual clarity in mind. The color-coded bars and overbought/oversold zones make it easy to interpret the market's current state at a glance. This is particularly useful for traders who rely on quick decision-making or need to monitor multiple assets simultaneously.
6. **Customizability**:
- The indicator offers several user inputs that allow traders to customize it according to their trading style and market of interest. This includes the length of the volume period, the sensitivity of the adaptive filter, and the thresholds for overbought/oversold conditions. Such flexibility makes it a valuable tool for both short-term traders and long-term investors.
### **Conclusion**
The "Uptrick: Adaptive Volatility Oscillator" is a powerful and versatile indicator that blends volume analysis with adaptive filtering to provide a nuanced view of market trends and volatility. Its ability to identify overbought and oversold conditions, coupled with its adaptive nature, makes it an indispensable tool for traders looking to gain an edge in the markets. Whether you're aiming to spot trend reversals, confirm the strength of ongoing trends, or manage risk through volatility analysis, this indicator offers the insights needed to make informed trading decisions. Its clear visual signals and customizable parameters further enhance its utility, making it suitable for a wide range of trading strategies and market environments.
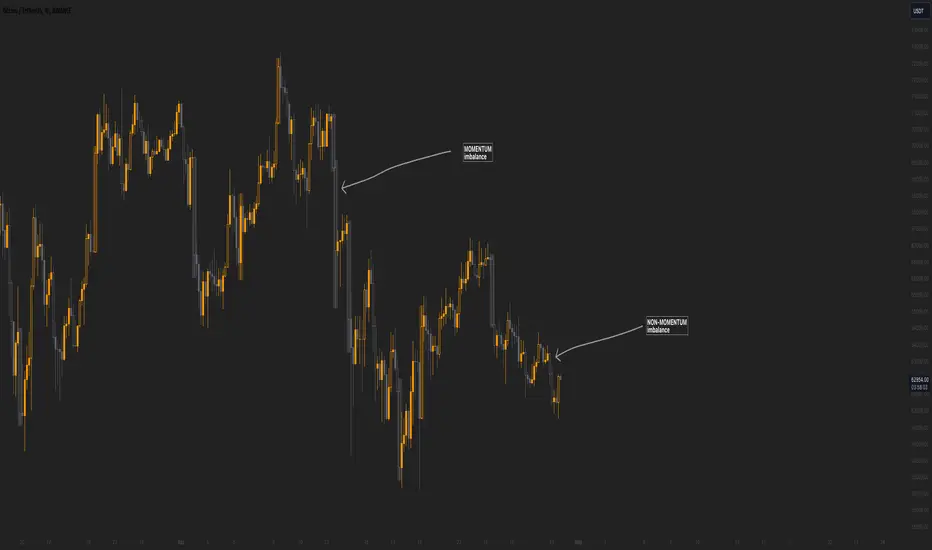
Momentum imbalance (internal liquidity) by CUWe have developed a sophisticated indicator to detect momentum, imbalance, and internal liquidity within financial markets. Designed to leverage real-time data analysis, this tool aims to assist traders in making more informed decisions.
The momentum component of the indicator calculates the rate at which prices move. By measuring price changes over a specific period, the indicator can show whether an asset is likely to continue rising or falling. This helps traders identify when a trend is gaining strength or beginning to wane.
Market imbalance is analyzed by observing the disparity in buy and sell orders. Our indicator identifies significant deviations between supply and demand, which can indicate potential turning points or accelerations in market movement. This aspect is crucial for understanding the underlying forces that influence price changes.
Regarding internal liquidity, our indicator measures the market depth and the availability of liquid assets. This component is essential for assessing how easily assets can be bought or sold without significantly impacting the price. High internal liquidity indicates a healthy market where transactions are executed quickly and efficiently, while low liquidity can lead to increased volatility and potential price manipulation.
By integrating these three components, our indicator provides a holistic view of market dynamics, enabling traders to operate more strategically and with greater confidence.
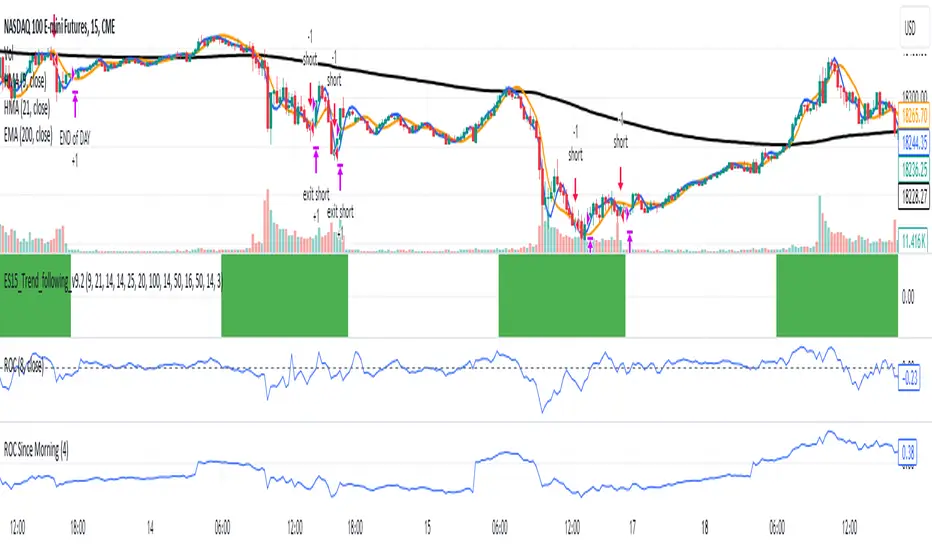
ROC Since MorningThe "ROC Since Morning" indicator is designed for traders who wish to gauge the momentum of an asset from a specific time in the morning, allowing for a customizable analysis of pre-market and intraday movements. This indicator calculates the Rate of Change (ROC) from a user-defined hour, offering insights into how the price has moved since then.
How to Use:
Add the "ROC Since Morning" indicator to your chart.
Adjust the start hour input to your preferred time, considering pre-market hours or the official market opening time.
Analyze the ROC values to understand price movements and momentum since your specified start hour. A positive ROC indicates an upward price movement, while a negative ROC suggests downward movement.
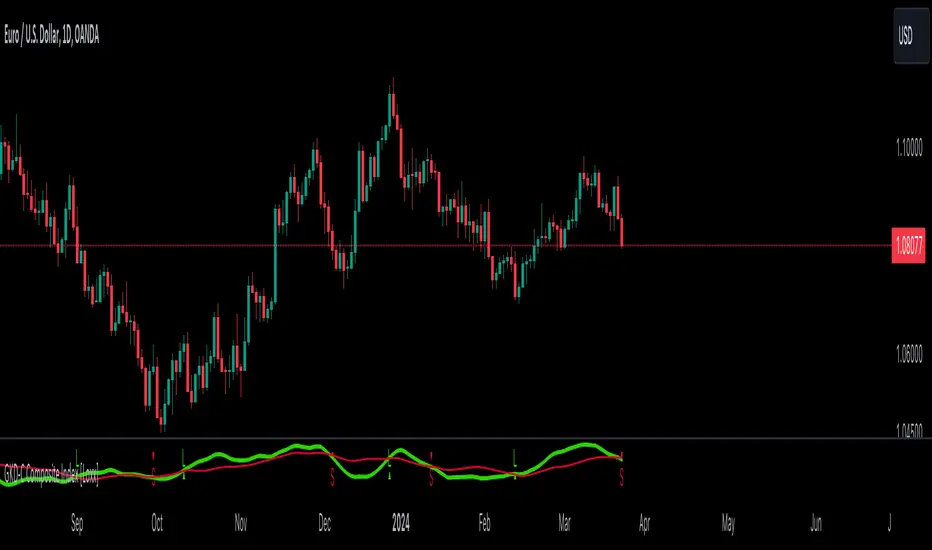
GKD-C Composite Index [Loxx]The Giga Kaleidoscope GKD-C Composite Index is a Confirmation module included in Loxx's "Giga Kaleidoscope Modularized Trading System."
█ GKD-C Composite Index
The Composite Index is a sophisticated technical analysis tool that enhances the traditional Relative Strength Index (RSI) by incorporating momentum and multiple time frame analysis. It calculates two versions of the RSI, one at a slower period and another at a faster period, to capture both long-term trends and short-term market fluctuations. The innovation comes from introducing a momentum factor, RSIDelta, which is the difference between the slow RSI and its value a specified number of periods ago, highlighting the rate of change in market sentiment. Simultaneously, the fast RSI is smoothed with a simple moving average (SMA) over a designated period (RSIsma), blending immediate price movements with ongoing trends. The Composite Index then combines these elements (RSIDelta and RSIsma), creating a singular metric that embodies both momentum and the smoothed trend. This index is further refined by averaging it over two additional periods, offering a multifaceted view that assists in identifying overbought or oversold conditions with enhanced sensitivity to market dynamics. This method aims to provide traders with a deeper understanding of market forces, potentially leading to more informed trading decisions by capturing nuances missed by the standard RSI.
█ Giga Kaleidoscope Modularized Trading System
Core components of an NNFX algorithmic trading strategy
The NNFX algorithm is built on the principles of trend, momentum, and volatility. There are six core components in the NNFX trading algorithm:
1. Volatility - price volatility; e.g., Average True Range, True Range Double, Close-to-Close, etc.
2. Baseline - a moving average to identify price trend
3. Confirmation 1 - a technical indicator used to identify trends
4. Confirmation 2 - a technical indicator used to identify trends
5. Continuation - a technical indicator used to identify trends
6. Volatility/Volume - a technical indicator used to identify volatility/volume breakouts/breakdown
7. Exit - a technical indicator used to determine when a trend is exhausted
8. Metamorphosis - a technical indicator that produces a compound signal from the combination of other GKD indicators*
*(not part of the NNFX algorithm)
What is Volatility in the NNFX trading system?
In the NNFX (No Nonsense Forex) trading system, ATR (Average True Range) is typically used to measure the volatility of an asset. It is used as a part of the system to help determine the appropriate stop loss and take profit levels for a trade. ATR is calculated by taking the average of the true range values over a specified period.
True range is calculated as the maximum of the following values:
-Current high minus the current low
-Absolute value of the current high minus the previous close
-Absolute value of the current low minus the previous close
ATR is a dynamic indicator that changes with changes in volatility. As volatility increases, the value of ATR increases, and as volatility decreases, the value of ATR decreases. By using ATR in NNFX system, traders can adjust their stop loss and take profit levels according to the volatility of the asset being traded. This helps to ensure that the trade is given enough room to move, while also minimizing potential losses.
Other types of volatility include True Range Double (TRD), Close-to-Close, and Garman-Klass
What is a Baseline indicator?
The baseline is essentially a moving average, and is used to determine the overall direction of the market.
The baseline in the NNFX system is used to filter out trades that are not in line with the long-term trend of the market. The baseline is plotted on the chart along with other indicators, such as the Moving Average (MA), the Relative Strength Index (RSI), and the Average True Range (ATR).
Trades are only taken when the price is in the same direction as the baseline. For example, if the baseline is sloping upwards, only long trades are taken, and if the baseline is sloping downwards, only short trades are taken. This approach helps to ensure that trades are in line with the overall trend of the market, and reduces the risk of entering trades that are likely to fail.
By using a baseline in the NNFX system, traders can have a clear reference point for determining the overall trend of the market, and can make more informed trading decisions. The baseline helps to filter out noise and false signals, and ensures that trades are taken in the direction of the long-term trend.
What is a Confirmation indicator?
Confirmation indicators are technical indicators that are used to confirm the signals generated by primary indicators. Primary indicators are the core indicators used in the NNFX system, such as the Average True Range (ATR), the Moving Average (MA), and the Relative Strength Index (RSI).
The purpose of the confirmation indicators is to reduce false signals and improve the accuracy of the trading system. They are designed to confirm the signals generated by the primary indicators by providing additional information about the strength and direction of the trend.
Some examples of confirmation indicators that may be used in the NNFX system include the Bollinger Bands, the MACD (Moving Average Convergence Divergence), and the MACD Oscillator. These indicators can provide information about the volatility, momentum, and trend strength of the market, and can be used to confirm the signals generated by the primary indicators.
In the NNFX system, confirmation indicators are used in combination with primary indicators and other filters to create a trading system that is robust and reliable. By using multiple indicators to confirm trading signals, the system aims to reduce the risk of false signals and improve the overall profitability of the trades.
What is a Continuation indicator?
In the NNFX (No Nonsense Forex) trading system, a continuation indicator is a technical indicator that is used to confirm a current trend and predict that the trend is likely to continue in the same direction. A continuation indicator is typically used in conjunction with other indicators in the system, such as a baseline indicator, to provide a comprehensive trading strategy.
What is a Volatility/Volume indicator?
Volume indicators, such as the On Balance Volume (OBV), the Chaikin Money Flow (CMF), or the Volume Price Trend (VPT), are used to measure the amount of buying and selling activity in a market. They are based on the trading volume of the market, and can provide information about the strength of the trend. In the NNFX system, volume indicators are used to confirm trading signals generated by the Moving Average and the Relative Strength Index. Volatility indicators include Average Direction Index, Waddah Attar, and Volatility Ratio. In the NNFX trading system, volatility is a proxy for volume and vice versa.
By using volume indicators as confirmation tools, the NNFX trading system aims to reduce the risk of false signals and improve the overall profitability of trades. These indicators can provide additional information about the market that is not captured by the primary indicators, and can help traders to make more informed trading decisions. In addition, volume indicators can be used to identify potential changes in market trends and to confirm the strength of price movements.
What is an Exit indicator?
The exit indicator is used in conjunction with other indicators in the system, such as the Moving Average (MA), the Relative Strength Index (RSI), and the Average True Range (ATR), to provide a comprehensive trading strategy.
The exit indicator in the NNFX system can be any technical indicator that is deemed effective at identifying optimal exit points. Examples of exit indicators that are commonly used include the Parabolic SAR, and the Average Directional Index (ADX).
The purpose of the exit indicator is to identify when a trend is likely to reverse or when the market conditions have changed, signaling the need to exit a trade. By using an exit indicator, traders can manage their risk and prevent significant losses.
In the NNFX system, the exit indicator is used in conjunction with a stop loss and a take profit order to maximize profits and minimize losses. The stop loss order is used to limit the amount of loss that can be incurred if the trade goes against the trader, while the take profit order is used to lock in profits when the trade is moving in the trader's favor.
Overall, the use of an exit indicator in the NNFX trading system is an important component of a comprehensive trading strategy. It allows traders to manage their risk effectively and improve the profitability of their trades by exiting at the right time.
What is an Metamorphosis indicator?
The concept of a metamorphosis indicator involves the integration of two or more GKD indicators to generate a compound signal. This is achieved by evaluating the accuracy of each indicator and selecting the signal from the indicator with the highest accuracy. As an illustration, let's consider a scenario where we calculate the accuracy of 10 indicators and choose the signal from the indicator that demonstrates the highest accuracy.
The resulting output from the metamorphosis indicator can then be utilized in a GKD-BT backtest by occupying a slot that aligns with the purpose of the metamorphosis indicator. The slot can be a GKD-B, GKD-C, or GKD-E slot, depending on the specific requirements and objectives of the indicator. This allows for seamless integration and utilization of the compound signal within the GKD-BT framework.
How does Loxx's GKD (Giga Kaleidoscope Modularized Trading System) implement the NNFX algorithm outlined above?
Loxx's GKD v2.0 system has five types of modules (indicators/strategies). These modules are:
1. GKD-BT - Backtesting module (Volatility, Number 1 in the NNFX algorithm)
2. GKD-B - Baseline module (Baseline and Volatility/Volume, Numbers 1 and 2 in the NNFX algorithm)
3. GKD-C - Confirmation 1/2 and Continuation module (Confirmation 1/2 and Continuation, Numbers 3, 4, and 5 in the NNFX algorithm)
4. GKD-V - Volatility/Volume module (Confirmation 1/2, Number 6 in the NNFX algorithm)
5. GKD-E - Exit module (Exit, Number 7 in the NNFX algorithm)
6. GKD-M - Metamorphosis module (Metamorphosis, Number 8 in the NNFX algorithm, but not part of the NNFX algorithm)
(additional module types will added in future releases)
Each module interacts with every module by passing data to A backtest module wherein the various components of the GKD system are combined to create a trading signal.
That is, the Baseline indicator passes its data to Volatility/Volume. The Volatility/Volume indicator passes its values to the Confirmation 1 indicator. The Confirmation 1 indicator passes its values to the Confirmation 2 indicator. The Confirmation 2 indicator passes its values to the Continuation indicator. The Continuation indicator passes its values to the Exit indicator, and finally, the Exit indicator passes its values to the Backtest strategy.
This chaining of indicators requires that each module conform to Loxx's GKD protocol, therefore allowing for the testing of every possible combination of technical indicators that make up the six components of the NNFX algorithm.
What does the application of the GKD trading system look like?
Example trading system:
Backtest: Multi-Ticker CC Backtest
Baseline: Hull Moving Average
Volatility/Volume: Hurst Exponent
Confirmation 1: Advance Trend Pressure as shown on the chart above
Confirmation 2: uf2018
Continuation: Coppock Curve
Exit: Rex Oscillator
Metamorphosis: Baseline Optimizer
Each GKD indicator is denoted with a module identifier of either: GKD-BT, GKD-B, GKD-C, GKD-V, GKD-M, or GKD-E. This allows traders to understand to which module each indicator belongs and where each indicator fits into the GKD system.
█ Giga Kaleidoscope Modularized Trading System Signals
Standard Entry
1. GKD-C Confirmation gives signal
2. Baseline agrees
3. Price inside Goldie Locks Zone Minimum
4. Price inside Goldie Locks Zone Maximum
5. Confirmation 2 agrees
6. Volatility/Volume agrees
1-Candle Standard Entry
1a. GKD-C Confirmation gives signal
2a. Baseline agrees
3a. Price inside Goldie Locks Zone Minimum
4a. Price inside Goldie Locks Zone Maximum
Next Candle
1b. Price retraced
2b. Baseline agrees
3b. Confirmation 1 agrees
4b. Confirmation 2 agrees
5b. Volatility/Volume agrees
Baseline Entry
1. GKD-B Baseline gives signal
2. Confirmation 1 agrees
3. Price inside Goldie Locks Zone Minimum
4. Price inside Goldie Locks Zone Maximum
5. Confirmation 2 agrees
6. Volatility/Volume agrees
7. Confirmation 1 signal was less than 'Maximum Allowable PSBC Bars Back' prior
1-Candle Baseline Entry
1a. GKD-B Baseline gives signal
2a. Confirmation 1 agrees
3a. Price inside Goldie Locks Zone Minimum
4a. Price inside Goldie Locks Zone Maximum
5a. Confirmation 1 signal was less than 'Maximum Allowable PSBC Bars Back' prior
Next Candle
1b. Price retraced
2b. Baseline agrees
3b. Confirmation 1 agrees
4b. Confirmation 2 agrees
5b. Volatility/Volume agrees
Volatility/Volume Entry
1. GKD-V Volatility/Volume gives signal
2. Confirmation 1 agrees
3. Price inside Goldie Locks Zone Minimum
4. Price inside Goldie Locks Zone Maximum
5. Confirmation 2 agrees
6. Baseline agrees
7. Confirmation 1 signal was less than 7 candles prior
1-Candle Volatility/Volume Entry
1a. GKD-V Volatility/Volume gives signal
2a. Confirmation 1 agrees
3a. Price inside Goldie Locks Zone Minimum
4a. Price inside Goldie Locks Zone Maximum
5a. Confirmation 1 signal was less than 'Maximum Allowable PSVVC Bars Back' prior
Next Candle
1b. Price retraced
2b. Volatility/Volume agrees
3b. Confirmation 1 agrees
4b. Confirmation 2 agrees
5b. Baseline agrees
Confirmation 2 Entry
1. GKD-C Confirmation 2 gives signal
2. Confirmation 1 agrees
3. Price inside Goldie Locks Zone Minimum
4. Price inside Goldie Locks Zone Maximum
5. Volatility/Volume agrees
6. Baseline agrees
7. Confirmation 1 signal was less than 7 candles prior
1-Candle Confirmation 2 Entry
1a. GKD-C Confirmation 2 gives signal
2a. Confirmation 1 agrees
3a. Price inside Goldie Locks Zone Minimum
4a. Price inside Goldie Locks Zone Maximum
5a. Confirmation 1 signal was less than 'Maximum Allowable PSC2C Bars Back' prior
Next Candle
1b. Price retraced
2b. Confirmation 2 agrees
3b. Confirmation 1 agrees
4b. Volatility/Volume agrees
5b. Baseline agrees
PullBack Entry
1a. GKD-B Baseline gives signal
2a. Confirmation 1 agrees
3a. Price is beyond 1.0x Volatility of Baseline
Next Candle
1b. Price inside Goldie Locks Zone Minimum
2b. Price inside Goldie Locks Zone Maximum
3b. Confirmation 1 agrees
4b. Confirmation 2 agrees
5b. Volatility/Volume agrees
Continuation Entry
1. Standard Entry, 1-Candle Standard Entry, Baseline Entry, 1-Candle Baseline Entry, Volatility/Volume Entry, 1-Candle Volatility/Volume Entry, Confirmation 2 Entry, 1-Candle Confirmation 2 Entry, or Pullback entry triggered previously
2. Baseline hasn't crossed since entry signal trigger
4. Confirmation 1 agrees
5. Baseline agrees
6. Confirmation 2 agrees
Forex Multi-Factor IndicatorMoving Averages (MA):
Two moving averages are plotted on the chart: a fast MA (blue line) and a slow MA (red line).
The fast MA is calculated using a shorter period (10 periods by default), while the slow MA is calculated using a longer period (30 periods by default).
Moving averages help identify trends by smoothing out price fluctuations. When the fast MA crosses above the slow MA, it suggests a bullish trend, and when the fast MA crosses below the slow MA, it suggests a bearish trend.
Relative Strength Index (RSI):
The RSI indicator (orange line) is plotted on a separate axis.
RSI measures the speed and change of price movements and oscillates between 0 and 100.
RSI values above 70 are considered overbought, indicating a potential reversal to the downside, while RSI values below 30 are considered oversold, indicating a potential reversal to the upside.
Volume Moving Average (Volume MA):
The volume moving average (purple line) is plotted on the same axis as the volume.
The volume moving average is calculated over a specified period (20 periods by default).
Volume analysis provides insights into the strength of price movements. When the volume increases along with price movements, it suggests strong conviction from traders.
Buy and Sell Signals:
Buy signals (green triangle) are generated when all of the following conditions are met:
The fast MA crosses above the slow MA (indicating a bullish trend).
The RSI is below the oversold level (indicating potential upward momentum).
The current price is above the fast MA, and the volume is higher than the volume MA (indicating positive volume trend).
Sell signals (red triangle) are generated when all of the following conditions are met:
The fast MA crosses below the slow MA (indicating a bearish trend).
The RSI is above the overbought level (indicating potential downward momentum).
The current price is below the fast MA, and the volume is lower than the volume MA (indicating negative volume trend).
Overall, this multi-factor indicator combines moving averages, RSI, and volume analysis to identify potential buying and selling opportunities in the Forex market. Traders can use the signals generated by this indicator as part of their trading strategy, but it's important to consider other factors such as risk management and market conditions before making trading decisions

Momentum Candle
bar’s open price (open) from its close price (close). That gives the size of the bar’s body.
The difference between the open and closed is the candle’s body range.
The colour of a candle’s body shows the direction of prices.
if Close > Open then it's Bullish Body Candle & if close < open then it's Bearish Body Candle.
Stronger the interest of buyers or sellers is reflected in the formation of the Body of Candle.
When the body is indeed more than 50% bigger than the average size of a candle
then it will show Momentum on the chart.
we can see the Colour of the candle Changes When it is Stronger than the Average candle & Body size is Bigger than the Average Candle size.
Depending upon Bullish or Bearish the candle Colour Changes to Indicate the Strong Presence of the Buyer or Seller
The Candle which strong but not solid and above Average then it will show Normal Colour Of Candle and the Candle which is Below Average will have no colour on Volume Like Bars on the Chart & chart no effect on the candle colour.
Buyer or Seller's Activity is always reflected in Candle. This helps us to make Trade Decisions.
If Solid Candle at Support or Resistance give or add more Conviction. If Found At Support or resistance will act as Reversal. If found at Swing Low or Retracement, it will help to take trade accordingly with the main trend.
Solid Candle Helps in Good Risk to Reward. Mark the High and Low Of the Strong Candle and observe the Price Action.
as long as the candle is trading below average helps us to take action for Range Breakout & saves us from Taking Entry in Range.
The Distribution at the Top and consolidation at the Bottom can be Observed by the Behaviour of Candles on the Chart.
The candle is always a little first step of price action, Whatever Happens in the market is always first printed in a candle,
The Leader Candle or Momentum Candle with Follow always Decides the Trend.
It's Simple But useful in Day Trading as well as in Swing Trading or Positional Trading too

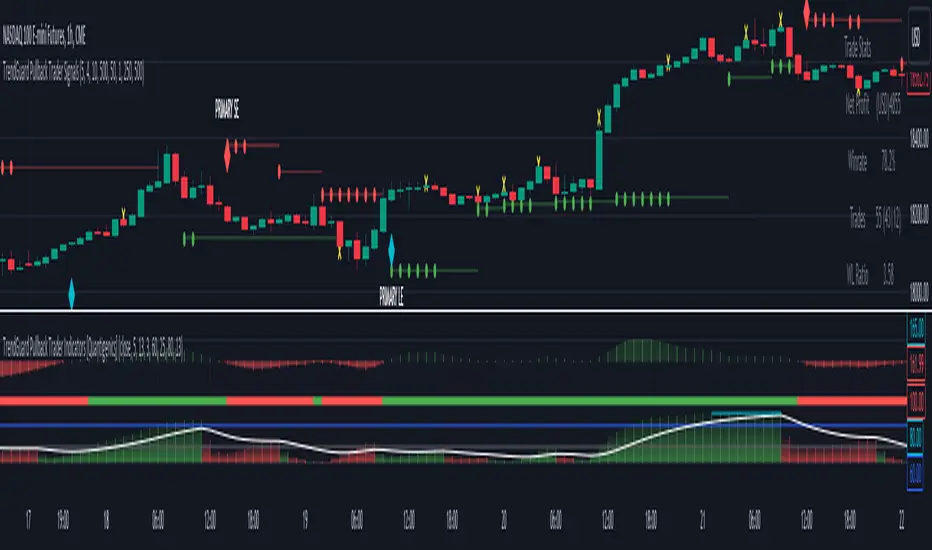
TrendGuard Pullback Trader Signals [Quantigenics]The "TrendGuard Pullback Trader Signals" script, integral to the "TrendGuard Pullback Trader" system, offers a sophisticated suite of trading tools for nearly any market or time frame. Designed to be used alongside the "TrendGuard Pullback Trader Indicators" script, this script is pivotal for identifying Buy/Sell Signals, Profit Target Signals, and Stop Loss Levels.
As with all of our scripts, the "TrendGuard Pullback Trader Signals" script, is designed to work on ANY symbol and time frame. The input parameters can be adjusted to fit your specific trading style.
Methodology and Application:
The script's core methodology lies in identifying primary signals at the onset of a trend and secondary signals during pullbacks or dips. It focuses on pinpointing optimal entry points during market pullbacks, enhancing the "TrendGuard Pullback Trader Indicators" script with well-timed signals for profit targets and stop loss levels.
Technical Composition:
The "TrendGuard Pullback Trader Signals" script combines various technical analysis tools to generate comprehensive trading signals. It calculates stop levels by assessing the highest and lowest bars over a chosen period, defining the market range. Primary signals are derived using a triple exponential moving average (EMA) of logarithmic closing prices, identifying trend changes with stop level plots and directional arrows. For secondary signals, the script uses a sequence of EMAs applied to the average price (HLC3) and an oscillator that measures the extremity of recent price movements, pinpointing potential entry points. The script also incorporates a sideways exit mechanism, comparing short-term and long-term EMAs of the average price to detect significant deviations, suggesting exit opportunities. This layered strategy offers a detailed perspective on market trends, momentum, and possible entry and exit points.
EMA-Based Trend Analysis Algorithm :
Utilizes an advanced algorithm that incorporates exponential moving averages (EMA) with specific length parameters. This algorithm analyzes the slope and direction of EMA lines to identify significant shifts in market trends.
Primary Signal Generation : Logarithmic and Triple EMA Function:
Primary signals are derived from a unique logarithmic function applied to price data, which is then processed through a series of three EMAs with distinct period settings. This combination targets potential trend initiation points by detecting shifts in the logarithmic trend curve.
Dynamic Stop Level Determination :
Employs a methodology involving the calculation of recent high and low price bars, adjusted by a factor that considers market volatility. This factor dynamically alters the sensitivity of the stop levels, aligning them with current market conditions.
Secondary Signal Identification During Pullbacks :
Secondary signals are identified through a complex comparison of the market's relative position to its moving averages. This involves calculating the divergence between price and moving averages, adjusted for the rate of change in the market, to flag strategic entry points during pullbacks.
Composite Market Trend Analysis for Signal Mechanism :
Signal generation integrates a composite of multiple technical indicators, each contributing unique mathematical calculations. This integration enhances the accuracy and reliability of entry and exit signals.
Practical Application in Trading :
> For trade initiation, primary signals are used to identify the start of potential trends, applying a specific mathematical threshold to confirm the trend change. Secondary signals focus on quantifying the pullback depth relative to recent market movements for additional entry opportunities.
> The script's dynamic stop loss adjustment incorporates a calculated moving average of recent highs and lows, providing a responsive and protective mechanism for open positions.
How to Use the Script:
Trade Initiation : Primary signals at trend onset can be used for potential entry points, or to simply establish a trend-bias, to watch for Strategic Entries signals.
Strategic Entries on Pullbacks : Secondary signals provide opportunities for additional entries or scaling into positions during pullbacks within the main trend.
Profit Targets and Exit Strategy : Profit target signals serve as potential exit points. For larger positions, consider partial exits at these targets while adjusting stop loss levels to secure profits, and hold the remaining position for further potential gains.
Dynamic Risk Management : Regularly adjust stop loss levels based on the script's dynamic stop level determination to protect against market reversals and lock in profits.
Integration with TrendGuard Pullback Trader Indicators:
The script is designed and intended to be used in conjunction with the "TrendGuard Pullback Trader Indicators ". This integration ensures a holistic approach to market analysis, combining the strengths of both scripts for a comprehensive understanding of market trends, momentum, and entry points.
Note: The lower indicators are from the 'TrendGuard Pullback Trader Indicators' script, complementing the 'TrendGuard Pullback Trader Signals' script seen here, which generates the 'cloud' and signals on the price chart.
The 'TrendGuard Pullback Traders Indicators” script can be found here :
Input Parameter Settings:
Important Usage Guidance: For seamless integration with its counterpart, the "TrendGuard Pullback Trader Indicators" script, it's crucial to align the input parameter settings across both scripts. When adjusting values from their defaults, ensure that corresponding parameters in both scripts are identically set. This synchronization is key to achieving a cohesive and accurate representation on your charts.
Intra-Bar Order Generation (IntraBar): Determines whether signals are generated within the current bar or only after it closes, enhancing flexibility in signal timing.
Stop Level Strength (StopLvlStr): Sets the strength for calculating stop levels, impacting the sensitivity of the script to market highs and lows for stop placement.
Primary Signal Display (PrimON_OFF): Toggles the visibility of primary signals on the chart, aiding in identifying trend initiation points.
Secondary Signal Display (SecON_OFF): Controls the display of secondary signals for opportunities during pullbacks, allowing traders to capitalize on additional entry points.
Stop Loss Level Display (StopLossLvls): Enables or disables the visualization of stop loss levels, crucial for risk management strategies.
Trend Length (TrendLen): Adjusts the length parameter for the EMA calculations, influencing how the script interprets trend duration and strength.
These parameters allow traders to customize the script’s functionality according to their trading style and preferences, ensuring a tailored approach to signal generation and risk management.
Trade Alerts:
The script includes an advanced alert system designed to notify traders of crucial trading signals. This can Especially be useful when using larger time frames where trade setups can take a longer period of time to develop:
Primary Buy/Sell Alerts: Alerts are triggered at primary signals, indicating potential trend initiation points for entering trades.
Secondary Buy/Sell Alerts: These alerts activate during secondary signals, highlighting opportunities within ongoing trends for strategic entries or exits.
Stop Loss Level Alerts: The script can alert traders when the price reaches or crosses the script-determined stop loss levels, aiding in timely decision-making for risk management.
Sideways Exit Alerts: Alerts for potential exits are generated in sideways market conditions, based on the script’s analysis of average price movements.
To set up these alerts, traders can use TradingView’s alert system to specify the conditions under which they receive notifications, such as when a certain shape (e.g., arrow up for buy, arrow down for sell) appears on the chart. This feature helps traders stay informed and react promptly to the dynamic market conditions.
The "TrendGuard Pullback Trader Signals " script is a meticulously crafted tool, essential for traders aiming to enhance their market analysis and decision-making across diverse trading environments. While the script offers advanced functionalities, it reaches its full potential when used alongside the "TrendGuard Pullback Trader Indicators" script. Traders are advised to familiarize themselves with both scripts for a well-rounded trading strategy.
As always, remember that trading involves risks and past performance is not indicative of future results.
You can see the “Author’s instructions" below to get immediate access to TrendGuard Pullback Trader Signals & the rest of the “Quantigenics Premium Indicator Suite”.
VAcc (Velocity & Acceleration)VAcc (Velocity & Acceleration) is a momentum indicator published by Scott Cong in Stocks & Commodities V. 41:09 (8–15). It applies concepts from physics, namely velocity and acceleration, to financial markets. VAcc functions similarly to the popular MACD (Moving Average Convergence Divergence) indicator when using a longer lookback period, but produces more responsive results. With shorter periods, VAcc exhibits characteristics reminiscent of the stochastic oscillator.
🟠 Algorithm
The average velocity over the past n periods is defined as
((C - C_n) / n + (C - C_{n-1}) / (n - 1) + … + (C - C_i) / i + (C - C_1) / 1) / n
At its core, the velocity is a weighted average of the rate of change over the past n periods.
The calculation of the acceleration follows a similar process, where it’s defined as
((V - V_n) / n + (V - V_{n - 1}) / (n - 1) + … + (V - V_i) / i + (V - V_1) / 1) / n
🟠 Comparison with MACD
A comparison of VAcc and MACD on the daily Nasdaq 100 (NDX) chart from August 2022 helps demonstrate VAcc's improved sensitivity. Both indicators utilized a lookback period of 26 days and smoothing of 9 periods.
The VAcc histogram clearly shows a divergence forming, with momentum weakening as prices reached new highs. In contrast, the corresponding MACD histogram significantly lagged in confirming the divergence, highlighting VAcc's ability to identify subtle shifts in trend momentum more immediately than the traditional MACD.

Momentum EruptionIndicator: Momentum Eruption , using momentum to capture swing trading.
⏩Principle overview:
The core of Momentum Eruption is divided into two parts. One is to identify the trend direction. This is relatively clear. It is usually more effective to identify the direction through moving averages such as SMA or EMA. The second is to identify trading opportunities and use the idea of following the trend in large cycle and reversing the trend in small cycle. For example, when the large cycle is bullish and the small cycle is callback, if there are oversold conditions, a rebound from the previous low support, a long downward pin-bar, and an increase in trading volume at the same time, the extreme value of the price rebound or correction can be calculated. When following the trend, go long at the extreme value of the callback and go short at the extreme value of the rebound.
⏩Usage:
Signal: "B" stands for long buy signal. "S" stands for short sell signal.
Support and resistance: "Purple areas" represent support areas and "yellow areas" represent resistance areas.
🧿Tip I:
Adaptive signal. Take long buying as an example. When the purple area representing the support range appears, the market is bullish. If a "B" signal appears at this time, it means that you can consider buying and do a wave of short-term trading.
Usually there will be many short-term trading opportunities in a wave of rising trend.
🧿Tip II:
Since the market is reciprocating, the indicator will prompt many signals when it is trending. Each signal is observed and used independently, and it does not prompt the closing and profit taking points. Take profit and stop loss can be set according to your own trading cycle and style.
Regardless of whether it rises or falls, there will always be many swings that can be captured in the trend.
*The signals in the indicators are for reference only and not intended as investment advice. Past performance of a strategy is not indicative of future earnings results.

True OscillatorThe True Oscillator is an exceptional trading indicator that provides traders with highly accurate and reliable signals. While the RSI has been a popular indicator for decades, it has limitations, as it only considers closing price action which can be insufficient in providing a complete market trend analysis.
The True Oscillator, on the other hand, has been meticulously crafted to address these limitations. It considers multiple critical data points, including Close, High, Low, Open, Moving Averages, Weighted Moving Averages, Balance of Power, Center of Gravity, Average Sentiment, and Volume Weighted Moving Averages. These data points are perfectly weighted and blended into a single index momentum oscillator, replacing the RSI.
What makes the True Oscillator exceptional is its superior accuracy on individual bars. Since it considers more data points, it provides a more comprehensive picture of market trends, allowing traders to make better trading decisions based on highly accurate signals. Furthermore, the True Oscillator's accuracy throughout market swings ensures that traders have more reliable signals on both the upswing and downswing.
In terms of overall accuracy, the True Oscillator's ability to weigh and blend multiple data points results in a highly robust and reliable indicator that traders can depend on. The True Oscillator's unparalleled accuracy provides traders with a highly dependable indication of market trends.
The True Oscillator is a powerful trading indicator that has taken technical analysis to the next level. Its ability to consider multiple data points makes it a more reliable indicator than other momentum oscillators.

Effortless ContinuationIntroduction:
The Effortless Continuation Indicator is a technical analysis tool designed for traders to identify potential buy and sell signals in the market. This indicator combines three popular technical indicators - Moving Average Convergence Divergence (MACD), Triple Exponential Moving Average (TEMA), and Double Exponential Moving Average (DEMA) - to generate buy and sell signals. It is suitable for use on any time frame, from intraday trading to swing trading and longer-term investing.
Indicator Components:
The indicator comprises of three main components: MACD, TEMA, and DEMA.
Moving Average Convergence Divergence (MACD):
The MACD is a momentum indicator that measures the difference between two moving averages of the price of an asset. It is calculated by subtracting the 26-period Exponential Moving Average (EMA) from the 12-period EMA. The MACD line is used to identify changes in momentum, trends, and potential buy and sell signals.
Triple Exponential Moving Average (TEMA):
The TEMA is a type of Moving Average that takes multiple EMA values and applies a triple smoothing to them. This allows the TEMA to react more quickly to changes in price trends than traditional moving averages. The TEMA line is used as an additional confirmation for potential buy and sell signals.
Double Exponential Moving Average (DEMA):
The DEMA is similar to the TEMA but applies double smoothing to the EMA values. It is used as a signal line to confirm buy and sell signals generated by the MACD and TEMA.
Signal Generation:
The Effortless Continuation Indicator generates buy and sell signals based on the crossover and crossunder of the MACD and DEMA lines, as well as the price being above or below the TEMA line. Long signals are generated when the MACD crosses above the DEMA and the price is above the TEMA. Short signals are generated when the MACD crosses below the DEMA and the price is below the TEMA.
Chop Sensitivity:
The indicator has a user-adjustable "Chop Sensitivity" setting, which allows traders to adjust the ATR sensitivity for long and short signals. ATR is a volatility indicator that measures the average range of price movements over a given period of time. The default value is set to 0.5 ATR, which means that long and short signals will not be generated if the price is within 0.5 ATR of the TEMA.
Alerts:
The Effortless Continuation Indicator has built-in alerts for both long and short signals. It also includes a single alert that will trigger for both long and short signals. This allows traders to stay informed of potential trading opportunities even when they are not actively monitoring the markets.
Conclusion:
The Effortless Continuation Indicator is a powerful technical analysis tool that can help traders identify potential buy and sell signals in the market. It is easy to use and can be customized to suit individual trading styles and preferences. It is important to note that this indicator does not predict the market, but rather provides potential signals that should be confirmed with additional technical and fundamental analysis. With its advanced signal generation and alert features, the Effortless Continuation Indicator can be a valuable addition to any trader's toolbox.
Momentum PlayTraders always need a confirmation of momentum in price action to ride the swings.
Momentum Play Indicator consists of the below:
Bullish Conditions :
1)EMA 8 above EMA 34 and rising
2)Candle close above 5 candle high
3) RSI above 60
4) Volume above 5 candles avg. volume
5) ADX above 20
Bearish Conditions :
1)EMA 8 below EMA 34 and falling
2)Candle close below 5 candle low
3) RSI below 40
4) Volume above 5 candles avg. volume
5) ADX above 20
Traders can change the inputs as per their liking to adjust as per their comfortable timeframe.
Credits: Special Thanks to Mr. DTBHAT for sharing the above conditions.

Momentum Trend Fusion (MTF)The Momentum Trend Fusion (MTF) is a composite indicator that combines the Awesome Oscillator and the Relative Strength Index to provide a unique perspective on market momentum and trend strength. The MTF is calculated by first running the Relative Strength Index (RSI) on the Awesome Oscillator (AO) and then applying an Exponential Moving Average (EMA) on the RSI value. The MTF is designed to help traders detect market phases and confirm trend direction by analyzing the cross of the EMA and RSI, as well as divergences between the AO and price. The MTF can be customized by the user by providing the lengths of the RSI and EMA calculations, making it an ideal tool for traders with different time frames and risk tolerances.

GKD-C LSX on LMA [Loxx]Giga Kaleidoscope LSX on LMA is a Confirmation module included in Loxx's "Giga Kaleidoscope Modularized Trading System".
█ Giga Kaleidoscope Modularized Trading System
What is Loxx's "Giga Kaleidoscope Modularized Trading System"?
The Giga Kaleidoscope Modularized Trading System is a trading system built on the philosophy of the NNFX (No Nonsense Forex) algorithmic trading.
What is an NNFX algorithmic trading strategy?
The NNFX algorithm is built on the principles of trend, momentum, and volatility. There are six core components in the NNFX trading algorithm:
1. Volatility - price volatility; e.g., Average True Range, True Range Double, Close-to-Close, etc.
2. Baseline - a moving average to identify price trend
3. Confirmation 1 - a technical indicator used to identify trends.
4. Confirmation 2 - a technical indicator used to identify trends.
5. Continuation - a technical indicator used to identify trends.
6. Volatility/Volume - a technical indicator used to identify volatility/volume breakouts/breakdown.
7. Exit - a technical indicator used to determine when a trend is exhausted.
How does Loxx's GKD (Giga Kaleidoscope Modularized Trading System) implement the NNFX algorithm outlined above?
Loxx's GKD v1.0 system has five types of modules (indicators/strategies). These modules are:
1. GKD-BT - Backtesting module (Volatility, Number 1 in the NNFX algorithm)
2. GKD-B - Baseline module (Baseline and Volatility/Volume, Numbers 1 and 2 in the NNFX algorithm)
3. GKD-C - Confirmation 1/2 and Continuation module (Confirmation 1/2 and Continuation, Numbers 3, 4, and 5 in the NNFX algorithm)
4. GKD-V - Volatility/Volume module (Confirmation 1/2, Number 6 in the NNFX algorithm)
5. GKD-E - Exit module (Exit, Number 7 in the NNFX algorithm)
(additional module types will added in future releases)
Each module interacts with every module by passing data between modules. Data is passed between each module as described below:
GKD-B => GKD-V => GKD-C(1) => GKD-C(2) => GKD-C(Continuation) => GKD-E => GKD-BT
That is, the Baseline indicator passes its data to Volatility/Volume. The Volatility/Volume indicator passes its values to the Confirmation 1 indicator. The Confirmation 1 indicator passes its values to the Confirmation 2 indicator. The Confirmation 2 indicator passes its values to the Continuation indicator. The Continuation indicator passes its values to the Exit indicator, and finally, the Exit indicator passes its values to the Backtest strategy.
This chaining of indicators requires that each module conform to Loxx's GKD protocol, therefore allowing for the testing of every possible combination of technical indicators that make up the six components of the NNFX algorithm.
What does the application of the GKD trading system look like?
Example trading system:
Backtest: Strategy with 1-3 take profits, trailing stop loss, multiple types of PnL volatility, and 2 backtesting styles
Baseline: Hull Moving Average as shown on the chart above
Volatility/Volume: Average Directional Index (ADX) as shown on the chart above
Confirmation 1: LSX on LMA as shown on the chart above
Confirmation 2: Williams Percent Range
Continuation: Fisher Transform
Exit: Rex Oscillator
Each GKD indicator is denoted with a module identifier of either: GKD-BT, GKD-B, GKD-C, GKD-V, or GKD-E. This allows traders to understand to which module each indicator belongs and where each indicator fits into the GKD protocol chain.
Giga Kaleidoscope Modularized Trading System Signals (based on the NNFX algorithm)
Standard Entry
1. GKD-C Confirmation 1 Signal
2. GKD-B Baseline agrees
3. Price is within a range of 0.2x Volatility and 1.0x Volatility of the Goldie Locks Mean
4. GKD-C Confirmation 2 agrees
5. GKD-V Volatility/Volume agrees
Baseline Entry
1. GKD-B Baseline signal
2. GKD-C Confirmation 1 agrees
3. Price is within a range of 0.2x Volatility and 1.0x Volatility of the Goldie Locks Mean
4. GKD-C Confirmation 2 agrees
5. GKD-V Volatility/Volume agrees
6. GKD-C Confirmation 1 signal was less than 7 candles prior
Continuation Entry
1. Standard Entry, Baseline Entry, or Pullback; entry triggered previously
2. GKD-B Baseline hasn't crossed since entry signal trigger
3. GKD-C Confirmation Continuation Indicator signals
4. GKD-C Confirmation 1 agrees
5. GKD-B Baseline agrees
6. GKD-C Confirmation 2 agrees
1-Candle Rule Standard Entry
1. GKD-C Confirmation 1 signal
2. GKD-B Baseline agrees
3. Price is within a range of 0.2x Volatility and 1.0x Volatility of the Goldie Locks Mean
Next Candle:
1. Price retraced (Long: close < close or Short: close > close )
2. GKD-B Baseline agrees
3. GKD-C Confirmation 1 agrees
4. GKD-C Confirmation 2 agrees
5. GKD-V Volatility/Volume agrees
1-Candle Rule Baseline Entry
1. GKD-B Baseline signal
2. GKD-C Confirmation 1 agrees
3. Price is within a range of 0.2x Volatility and 1.0x Volatility of the Goldie Locks Mean
4. GKD-C Confirmation 1 signal was less than 7 candles prior
Next Candle:
1. Price retraced (Long: close < close or Short: close > close )
2. GKD-B Baseline agrees
3. GKD-C Confirmation 1 agrees
4. GKD-C Confirmation 2 agrees
5. GKD-V Volatility/Volume Agrees
PullBack Entry
1. GKD-B Baseline signal
2. GKD-C Confirmation 1 agrees
3. Price is beyond 1.0x Volatility of Baseline
Next Candle:
1. Price is within a range of 0.2x Volatility and 1.0x Volatility of the Goldie Locks Mean
3. GKD-C Confirmation 1 agrees
4. GKD-C Confirmation 2 agrees
5. GKD-V Volatility/Volume Agrees
█ LSX on LMA
What is LSX on LMA?
LSX on LMA is an RSI-like momentum indicator that is smoothed using three stage moving average combining an adaptive EMA, a Kalman Filter, and a Kauffman adaptive filter.
Requirements
Inputs
Confirmation 1 and Solo Confirmation: GKD-V Volatility / Volume indicator
Confirmation 2: GKD-C Confirmation indicator
Outputs
Confirmation 2 and Solo Confirmation: GKD-E Exit indicator
Confirmation 1: GKD-C Confirmation indicator
Continuation: GKD-E Exit indicator
Additional features will be added in future releases.
This indicator is only available to ALGX Trading VIP group members . You can see the Author's Instructions below to get more information on how to get access.

Momentum Sparkler (MS)Introduction:
In this script, we will be creating an indicator called "Momentum Sparkler" that plots lines on the chart to visualize the momentum of the given source.
Explanation:
First, we define the input "Source" as the source for the data to be plotted, and the input "Length" as an integer determining the number of lines to plot.
We then create an array called "lines" to store the lines we will be plotting.
Using an if statement, we check if the current bar is the last bar in the chart. If it is, we use a for loop to iterate through the range of the "Length" input and add a line to the "lines" array for each iteration. The color of each line is determined by a color gradient, with the first line being the most red and the last line being the most green.
Next, we use another if statement to check if the current bar is confirmed. If it is, we use a for loop to iterate through the "lines" array and delete all the lines. This is to prevent the lines from being carried over to the next bar and potentially being plotted multiple times.
Conclusion:
This script can be useful for quickly visualizing the momentum of the given source and identifying potential trends or reversals. It can be helpful for making trading decisions or for adding an additional layer of analysis to a chart.

1st Gray Cross Signals ━ Histogram SQZMOM [whvntr][LazyBear]This is the Histogram Version of one of my other indicators named: SQZ Momentum + 1st Gray Cross Signals (with arrows) Which is a modification of "Squeeze Momentum Indicator" by user: "LazyBear". In that indicator of his he described, and suggested, the use of his gray cross signals to find points of interest for trading based on the direction of momentum when the first gray cross appears... I have programmed these points, and highlighted them, for ease of use. The 1st gray cross strategy, he said , is from John F. Carter's book, Chapter 11, "Mastering the Trade".
Here we have the Histogram version, with background highlights only, and nothing on the chart, in true SQZ Momentum style.
Disclaimer: using this indicator, or any indicator anywhere, involves risk when trading and isn't a guarantee of 100% accurate results.

Outback RSI & Hull [TTF]This indicator was originally made to help users following along with one of our strategies that we call The Outback (hence the name).
One of the component indicators of that strategy is an RSI with a Hull Moving Average added on top of the RSI as an additional reference for the momentum of the RSI. Many people either had difficulty setting this up correctly, or were having issues with the Indicator on Indicator component, so we built this indicator to assist in that regard.
As we continued to use it, we found it to be a pretty sound momentum indicator that had much to offer by enhancing the more normal RSI, and wanted to make this indicator generally available to the public.
The basic premise of this indicator is as follows:
The core is a traditional RSI with a "normal" (usually Simple) moving average
The "secret sauce" is adding a 2nd moving average (a Hull Moving Average, inspired by Insilico's awesome Hull Suite) based off the RSI
By leveraging the RSI's position relative to both the Simple and Hull moving averages, you can better gauge the relative strength of the current momentum, as well as better visualize longer-term momentum direction and strength based on the moving average slopes and direction.

MTF TMOTMO - (T)rue (M)omentum (O)scillator) MTF (Higher Aggregation) Version
TMO calculates momentum using the DELTA of price. Giving a much better picture of the trend, reversals & divergences than most momentum oscillators using price. Aside from the regular TMO, this study combines four different TMO aggregations into one indicator for an even better picture of the trend. Once you look deeper into this study you will realize how complex this tool is. This version also produce much more information like crosses, divergences, overbought / oversold signals, higher aggregation fades etc. It is probably not even possible to explain them all, there could easily be an entire e-book about this study.
I have been using this tool for a couple of years now, and this is what i have learned so far:
Favorite Time Frame Variations:
1. 1m / 5m / 30m - Great for intraday futures or options scalps. 30m TMO serves as the overall trend gauge for the day. 5min dictates the longer term intraday moves as well as direction of the 1min. 1min is for the scalps. When the 5min TMO is sloping higher focus should be on 1min buy signals (red to green cross) and vice versa for the 5min agg. sloping down.
2. 5m / 30m / 60m - Also an interesting variation for day trading the 3-5 min charts. Producing more cleaner & beginner-friendly signals that lasts couple of minutes instead of seconds.
3. 120m / Day / 2 Day - For the 30m to 1H or 2H timeframes. Daily & 2 Day dictates the overall trend. 120 min for the signals. Great for a multi-day swings.
4. Day / 2 Day / Week - Good for the daily charts, swing trading analysis as the weekly dictates the overall trend, daily dictates the signals and the 2 day cleans out the daily signals. If the daily & 2 day are not aligned togather, daily signal means nothing. Weekly dictates 2 day - 2 day dictates daily.
5. Week / Month / 3 Month - Same thing as the previous variation but for the weekly charts.
TMO Length:
The default vanilla settings are 14,5,3. Some traders prefer 21,5,3 as the TMO length is litle higher = TMO will potenially last little longer which could teoretically produce less false signals but slower crosses which means signals will lag more behind price. The lower the length, the faster the oscillator oscillates. It is the noice vs. the lag debate. The Length can be changed, but i would not personally touch the other two. Few points up or down on length will not drastically change much. But changes on Calc Length and Smooth Length can produce totally different signals from the original.
Tips & Tricks:
1. Observe
- This is the best tip & trick I can give you. The #1 best way to learn how any study operates is to just observe how it works in certain situations from the past. MTF TMO is not
an exception.
2. The Power of the Higher Aggregation
- The higher aggregation ALWAYS dictates the lower one. Best way to see this? Just 2x the current timeframe aggregation = so on daily chart, plot the daily & two day TMOs and you will notice how the higher agg. smooths out the current agg. The higher the aggregation is, the smoother (but slower) will the TMO turn. The real power kicks in when the 3 or 4 aggregations are aligned togather in one direction.
3. Position of the Higher Aggregation in Relation to the Extremes
- Overbought / oversold signals might not really work on the current aggregation. But pay attention to the higher aggregations in relation to the extremes. Ex: on the daily chart - daily TMO inside the OB / OS extremes might not mean much. But once the higher aggregations such as 3 day or Weekly TMO enters OB/OS zone togather with the daily, this can be a very powerful signal for a TMO reversion to the zeroline.
4. Crosses
- Yes, crosses do work. Personally, I never really focused on them. The thing about the crosses is that it is crucial to pick the right higher aggregation to the combination of the current one that would be reliable but also print enough signals. The closer the cross is to the OB / OS extremes, the more bigger move can occur. Crosses around the zero line can be considered as less quality crosses.
5. Divergences
- TMO can print awesome divergences. The best divergences are on the current aggregation (TMO agg. same as the chart) since the current agg. oscillates fast, it can usually produce lower lows & higher highs faster then any higher aggregations. Easy setup: wait for the higher aggregation to reach the OB / OS extremes and watch the current (chart) aggregation to print a divergence.
6. Three is Enough
- I personally find more than three aggregations messy and hard to read. But there is always the option to turn on the 4th one. Just switch the TMO 4 Main, TMO 4 Signal and TMO 4 Fill in the style settings.
Hope it helps.

Normalized Velocity [Loxx]Velocity (which is often called a "smoother momentum" since it is much smoother than momentum without lagging at all) with an addition of ATR normalization
Since velocity is (even when normalization is applied) is not an indicator with fixed bounds, this indicator is uses floating levels for what is usually called overbought and oversold levels (+ a floating "zero" line is added). Something that would look like a "fixed levels" is easily achieved if you use long floating levels period in which case those levels are quite similar to fixed levels.
This indicator can be used like any momentum indicator (in that case recommended coloring mode is to use either slope coloring or "zero" middle level crossing coloring) or it can be used as a "trending" indicator in which case it is better to use coloring on outer level cross, and longer calculation periods are advised in that case.
Included:
Bar coloring
3 signal variations w/ alerts
Loxx's Expanded Source Types
Alerts