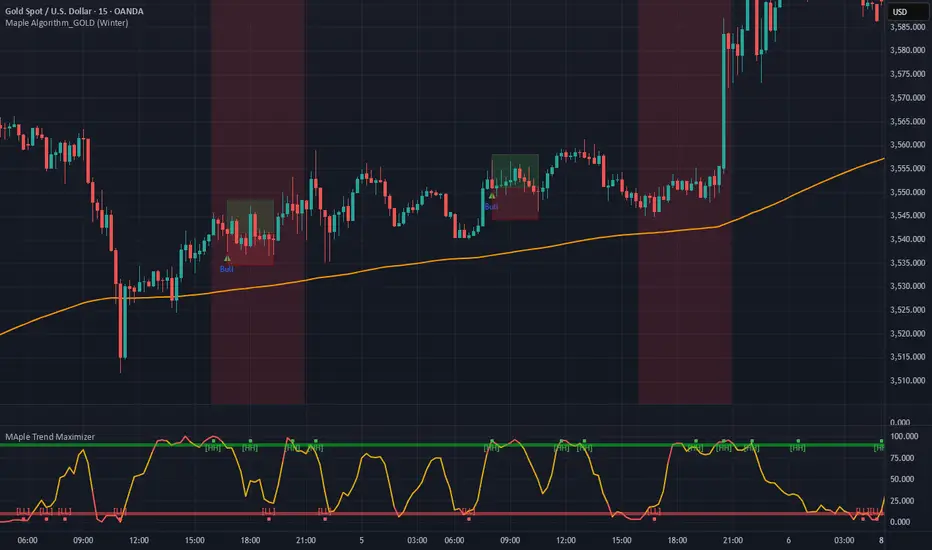
Maple Trend Maximizer – AI-Powered Trend & Entry IndicatorOverview:
Maple Trend Maximizer is an AI-inspired market analysis tool that identifies trend direction, highlights high-probability entry zones, and visually guides you through market momentum. Designed for traders seeking smart, data-driven signals, it combines trend alignment with proprietary AI-style calculations for precise timing.
Key Features:
AI Trend Detection:
Automatically identifies bullish and bearish trends using advanced smoothing and trend alignment techniques.
Momentum & Signal Lines:
Dynamic lines indicate market strength and potential turning points.
Colors change to highlight high-probability entry zones.
Entry Signals:
Optional visual markers suggest precise entries when trend direction and momentum align.
Configurable to reduce noise and focus on strong setups.
Multi-Timeframe Flexibility:
Works on intraday charts or higher timeframes for swing and position trading.
Customizable Settings:
Adjustable smoothing, trend sensitivity, and signal display options.
Lets you fine-tune the indicator to your trading style.
Benefits:
Quickly identifies market direction and optimal entries.
Provides clear, visually intuitive signals.
Can be used standalone or integrated into a larger strategy system.
"momentum" için komut dosyalarını ara
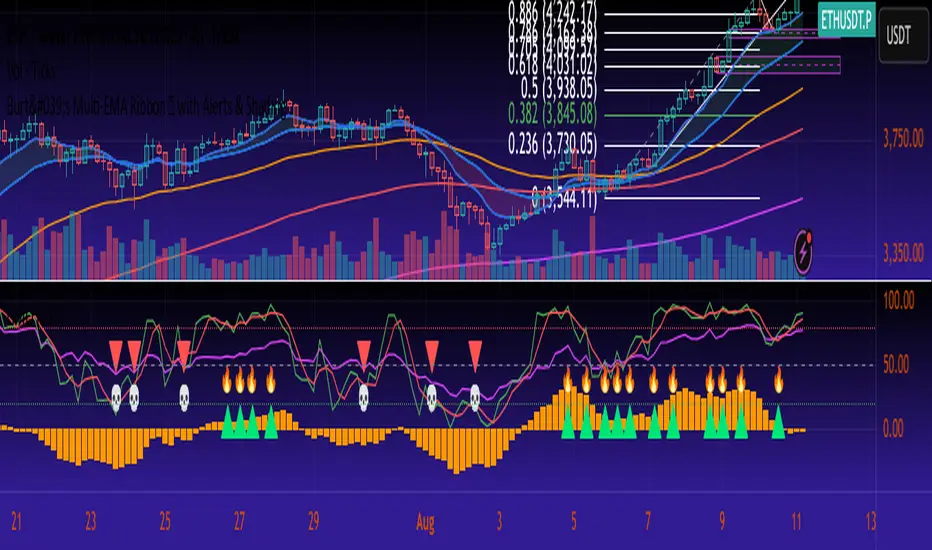
GMO The GMO is a multi-component confluence oscillator that helps traders visualise when several momentum and trend conditions align.
It blends an EMA trend filter, RSI bias, MACD histogram direction, and Stochastic RSI crossovers, with the option to add Fibonacci retracement proximity for additional confidence.
When multiple conditions agree, combined visual markers (triangle + emoji) appear above or below price, and background shading reflects bullish or bearish momentum. Supporting plots display MACD histogram bars, RSI, Stochastic RSI lines, and the chosen Fibonacci level, allowing quick confirmation at a glance.
This tool is best used as part of a broader confluence-based strategy and should be paired with independent analysis and risk management.
Hurst-Based Trend Persistence w/Poisson Prediction
---
# **Hurst-Based Trend Persistence w/ Poisson Prediction**
## **Introduction**
The **Hurst-Based Trend Persistence with Poisson Prediction** is a **statistically-driven trend-following oscillator** that provides traders with **a structured approach to identifying trend strength, persistence, and potential reversals**.
This indicator combines:
- **Hurst Exponent Analysis** (to measure how persistent or mean-reverting price action is).
- **Color-Coded Trend Detection** (to highlight bullish and bearish conditions).
- **Poisson-Based Trend Reversal Probability Projection** (to anticipate when a trend is likely to end based on statistical models).
By integrating **fractal market theory (Hurst exponent)** with **Poisson probability distributions**, this indicator gives traders a **probability-weighted view of trend duration** while dynamically adapting to market volatility.
---
## **Simplified Explanation (How to Read the Indicator at a Glance)**
1. **If the oscillator line is going up → The trend is strong.**
2. **If the oscillator line is going down → The trend is weakening.**
3. **If the color shifts from red to green (or vice versa), a trend shift has occurred.**
- **Strong trends can change color without weakening** (meaning a bullish or bearish move can remain powerful even as the trend shifts).
4. **A weakening trend does NOT necessarily mean a reversal is coming.**
- The trend may slow down but continue in the same direction.
5. **A strong trend does NOT guarantee it will last.**
- Even a powerful move can **suddenly reverse**, which is why the **Poisson-based background shading** helps anticipate probabilities of change.
---
## **How to Use the Indicator**
### **1. Understanding the Rolling Hurst-Based Trend Oscillator (Main Line)**
The **oscillator line** is based on the **Hurst exponent (H)**, which quantifies whether price movements are:
- **Trending** (values above 0 → momentum-driven, persistent trends).
- **Mean-reverting** (values below 0 → price action is choppy, likely to revert to the mean).
- **Neutral (Random Walk)** (values around 0 → price behaves like a purely stochastic process).
#### **Interpreting the Oscillator:**
- **H > 0.5 → Persistent Trends:**
- Price moves tend to sustain in one direction for longer periods.
- Example: Strong uptrends in bull markets.
- **H < 0.5 → Mean-Reverting Behavior:**
- Price has a tendency to revert back to its mean.
- Example: Sideways markets or fading momentum.
- **H ≈ 0.5 → Random Walk:**
- No clear trend; price is unpredictable.
A **gray dashed horizontal line at 0** serves as a **baseline**, helping traders quickly assess whether the market is **favoring trends or mean reversion**.
---
### **2. Color-Coded Trend Signal (Visual Confirmation of Trend Shifts)**
The oscillator **changes color** based on **price slope** over the lookback period:
- **🟢 Green → Uptrend (Price Increasing)**
- Price is rising relative to the selected lookback period.
- Suggests sustained bullish pressure.
- **🔴 Red → Downtrend (Price Decreasing)**
- Price is falling relative to the selected lookback period.
- Suggests sustained bearish pressure.
#### **How to Use This in Trading**
✔ **Stay in trends until a color change occurs.**
✔ **Use color changes as confirmation for trend reversals.**
✔ **Avoid counter-trend trades when the oscillator remains strongly colored.**
---
### **3. Poisson-Based Trend Reversal Projection (Anticipating Future Shifts)**
The **shaded orange background** represents a **Poisson-based probability estimation** of when the trend is likely to reverse.
- **Darker Orange = Higher Probability of Trend Reversal**
- **Lighter Orange / No Shade = Low Probability of Immediate Reversal**
💡 **The idea behind this model:**
✔ Trends **don’t last forever**, and their duration follows **statistical patterns**.
✔ By calculating the **average historical trend duration**, the indicator predicts **how likely a trend shift is at any given time**.
✔ The **Poisson probability function** is applied to determine the **expected likelihood of a reversal as time progresses**.
---
## **Mathematical Foundations of the Indicator**
This indicator is based on **two primary statistical models**:
### **1. Hurst Exponent & Trend Persistence (Fractal Market Theory)**
- The **Hurst exponent (H)** measures **autocorrelation** in price movements.
- If past trends **persist**, H will be **above 0.5** (meaning trend-following strategies are favorable).
- If past trends tend to **mean-revert**, H will be **below 0.5** (meaning reversal strategies are more effective).
- The **Rolling Hurst Oscillator** calculates this exponent over a moving window to track real-time trend conditions.
#### **Formula Breakdown (Simplified for Traders)**
The Hurst exponent (H) is derived using the **Rescaled Range (R/S) Analysis**:
\
Where:
- **R** = **Range** (difference between max cumulative deviation and min cumulative deviation).
- **S** = **Standard deviation** of price fluctuations.
- **Lookback** = The number of periods analyzed.
---
### **2. Poisson-Based Trend Reversal Probability (Stochastic Process Modeling)**
The **Poisson process** is a **probabilistic model used for estimating time-based events**, applied here to **predict trend reversals based on past trend durations**.
#### **How It Works**
- The indicator **tracks trend durations** (the time between color changes).
- A **Poisson rate parameter (λ)** is computed as:
\
- The **probability of a reversal at any given time (t)** is estimated using:
\
- **As t increases (trend continues), the probability of reversal rises**.
- The indicator **shades the background based on this probability**, visually displaying the likelihood of a **trend shift**.
---
## **Dynamic Adaptation to Market Conditions**
✔ **Volatility-Adjusted Trend Shifts:**
- A **custom volatility calculation** dynamically adjusts the **minimum trend duration** required before a trend shift is recognized.
- **Higher volatility → Requires longer confirmation before switching trend color.**
- **Lower volatility → Allows faster trend shifts.**
✔ **Adaptive Poisson Weighting:**
- **Recent trends are weighted more heavily** using an exponential decay function:
- **Decay Factor (0.618 by default)** prioritizes **recent intervals** while still considering historical trends.
- This ensures the model adapts to changing market conditions.
---
## **Key Takeaways for Traders**
✅ **Identify Persistent Trends vs. Mean Reversion:**
- Use the oscillator line to determine whether the market favors **trend-following or counter-trend strategies**.
✅ **Visual Trend Confirmation via Color Coding:**
- **Green = Uptrend**, **Red = Downtrend**.
- Trend changes help confirm **entry and exit points**.
✅ **Anticipate Trend Reversals Using Probability Models:**
- The **Poisson projection** provides a **statistical edge** in **timing exits before trends reverse**.
✅ **Adapt to Market Volatility Automatically:**
- Dynamic **volatility scaling** ensures the indicator remains effective in **both high and low volatility environments**.
Happy trading and enjoy!

Coppock Curve with Pivot Points and Divergence The Coppock Curve is a long-term price momentum indicator used primarily to recognize major downturns and upturns in a stock market index. It is calculated as a 10-month weighted moving average of the sum of the 14-month rate of change and the 11-month rate of change for the index. It is also known as the "Coppock Guide."
The Coppock formula was introduced in Barron's in 1962 by Edwin Coppock.
The Coppock Curve is a technical indicator that provides long-term buy and sell signals for major stock indexes and related ETFs based on shifts in momentum.
What Does the Coppock Curve Tell You?
The Coppock Curve was originally implemented as a long-term buy and sell indicator for major indices such as the S&P 500 and the Wilshire 5000. Often, it is used with long-term time series such as a candlestick chart, but where each candle contains a month's worth of price information.
The Difference Between the Coppock Curve and Rate of Relative Strength Index (RSI)?
The relative strength index looks at how the current price compares to prior prices, though it is calculated differently than the rate of change (ROC) indicator used in the Coppock Curve calculation. Therefore, these indicators will provide different trade signals and information.
What are those circles?
-These are Divergences. Red for Regular-Bearish. Orange for Hidden-Bearish. Green for Regular-Bullish. Aqua for Hidden-Bullish.
What are those triangles?
- These are Pivots . They show when the VPT oscillator might reverse, this is important to know because many times the price action follows this move.
Please keep in mind that this indicator is a tool and not a strategy, do not blindly trade signals, do your own research first! Use this indicator in conjunction with other indicators to get multiple confirmations.

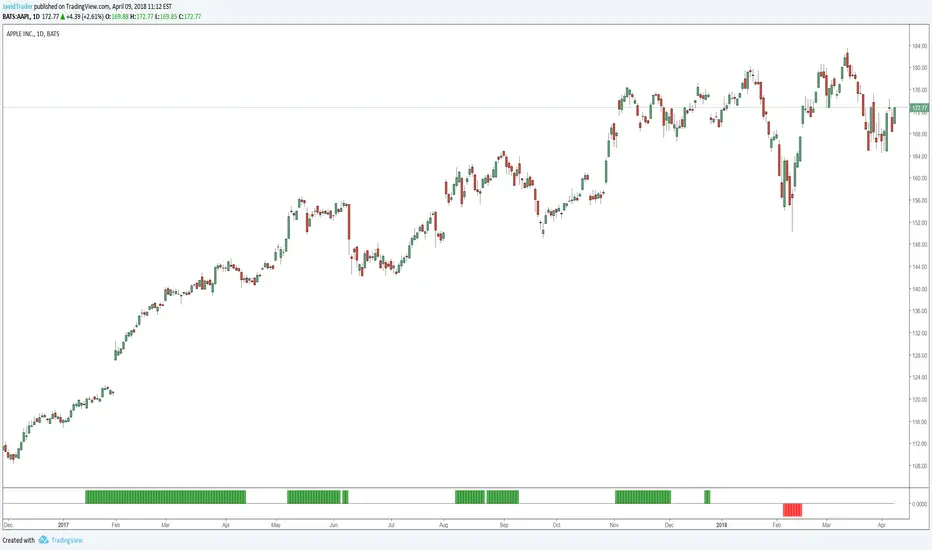
MDX Free Version (MA)This is a free version of the MDX Crypto trading "bot". Note that this indicator and the MDX version are based on simple code available on trading view or via google search.
This indicator is using two exponential moving averages. One average is set over 21 bars (fast) and the other is set over 55 bars (slow). When the plots intersect it represents a change in momentum. MDX refers to this as a confirmation.
Also shown on the chart is the "Super Trend" indicator. This is the red and green line with inflection points highlighted by a red or green arrow. These points are changes in uptrends and downtrends. MDX refers to this as a "long buy" when green, and a "short sell" when red. Commonly these are buy/sell signals. When a buysignal (green arrow) occurs followed by a change in momentum toward a downtrend, MDX refers to this as a "confirmed buy". When a sell signal (red arrow) occurs followed by a change in momentum toward a downtrend, MDX refers to this as a "confirmed sell". This can been seen more clearly on the MDS Crypto Free Version (PA) indicator which is also available. This uses the same information as the MA indicator, but formatted for the candle chart.
Usage:
Caution this indicator is not reliable on its own, especially on low time scales. When looking back in time this indicator will almost always show a "confirmed buy" before a large increase in price, but on many occasions you can have a "confirmed buy" which is followed by a dump in price, that will not trigger sell signal in time.

Jackrabbit.modulus.MovingAveragesThis is the Moving Averages indicator for the Jackrabbit suite and modulus framework.
This indicator supports differential timeframe analysis and confirmational bias. Dynamic timeframes are supported.
Three different algorithms are supported: Crossover/under, The 37 rule, and momentum. For momentum, the fast line is the upper boundary and the slow line is the lower boundrary. When crosses take place, the maximum and minimum vals are calculated properly in relation to the crossing points.
The main indicatior and the confirmational indicator can both be individually tuned for the fast, and slow moving averages with different and independent lengths and 27 different moving average types:
SMA, Double SMA, Triple SMA,
EMA, Double EMA, Triple EMA,
WMA, Double WMA, Triple WMA,
VWMA, Double VWMA, Triple VWMA,
Hull, Double Hull, Triple Hull,
ZLEMA, Double ZLEMA, Triple ZLEMA,
SWMA, Double SWMA, Triple SWMA,
SSMA, Double SSMA, Triple SSMA,
SMMA,Double SMMA, Triple SMMA
All moving averages can also have their own source input: Open, Close, High, Low, HL2, HLC3, and OHLC4
The Jackrabbit modulus framework is a plug in play paradigm built to operate through TradingView's indicator on indicatior (IoI) functionality. As such, this script receives a signal line from the previous script in the IoI chain, and evaluates the buy/sell signals appropriate to the current analysis. The results are either combined with the signal line, or used as confirmation to the signal line. A new signal line is generated for the next script in the link.
Buy/Sell alerts are produced by the main Jackrabbit script, or the modulus AlertSystem script. This script is not designed or meant to function outside my framework and contains no alert capabilities.
By default, the signal line is visible and the charts are turned off. Signal line visibility is controlled by the Style tab, and the charts display is controlled by the indicator settings tab.
This script is by invitation only. To learn more about accessing this script, please see my signature or send me a PM. Thank you.
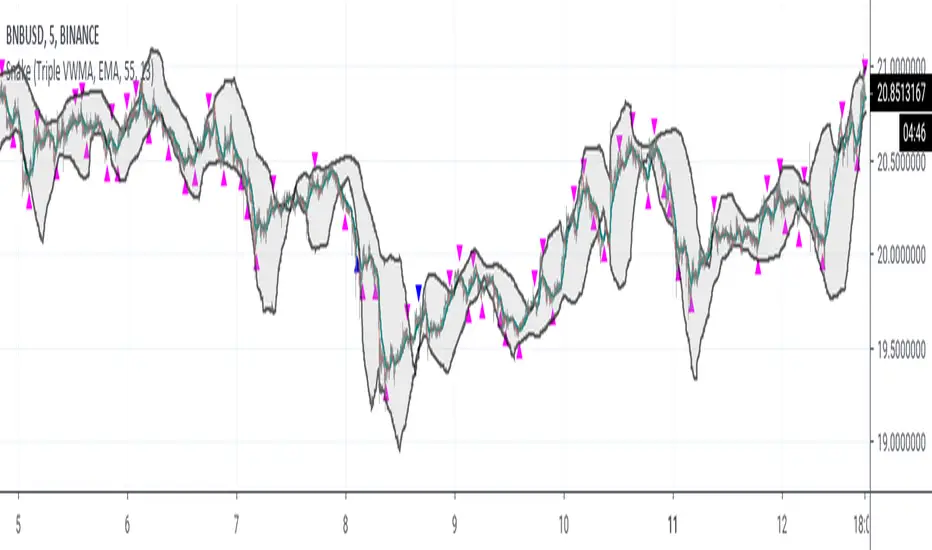
SnakeWhile moving averages are a good way to visualize price action, they are, in general, very poor indicators to trade against. Usually, the lowest prices occur before the cross over of multiple moving averages, while the best profits occur just before the crossunders of the moving averages.
This study captures the buy signals before the cross overs and sells just prior to the cross unders, when prices are lowest and highest respectively.
This is accomplished by treating the moving average as a "snake", specifically looking for the "head" of the snake to turn upwards when buying is most opportunistic. Note the the body must still be trending downward.
For selling, the "snake's head" must be turning down while the body is trending up.
This script uses blue arrows, pointing up, at the bottom, to indicate a buy signal, sending an alert of BUY ASSET.
Blue arrows, point down, at the top, represent sell signals with an alert of SELL ASSET.
The gray bar or strip is momentum. The snake's head must be above momentum for a sell, and below for a buy. This study does NOT work well with stable coins.
The longer the momentum, the more likely weak signals will be weeded out, but also presents less opportunities for buys.
The longer the length of the snake, the more likely cascading down turns will be ignored, but requires a longer trend to identify buy signals.
Momentum & Williams %R This strategy join 2 power study indicators on the same plot: Willian %R and Momentum.
Willian %R can indicate the good time for you buy or sale. Less than -80 indicate good buying opportunity . Greater than -20 good sale opportunity.
Momentum can indicate the good price for buy or sale, in other words, can indicate the speed the price goes down or goes up.
By Baldasso, March 2019.

Momentum Analysis Package by JCTThis all-in-one script is designed for traders and investors seeking maximum charting power in a single indicator—especially for those using TradingView’s free plan, where only one or two indicators are allowed per chart tab.
Why This Script Stands Out:
- Unified Solution: Combines most of the popular and essential indicators— EMA, SMA, RS Rating, Buyable Gap Up detection, Pattern Recognition, Inside Bar signals , and more—into one comprehensive package.
- Ideal for Free Users: No need to choose between different overlays or switch scripts; everything you require for detailed technical analysis is now accessible in a single chart tab .
- Pattern Recognition: Robust candlestick , base , cup with handle , and double bottom set-up detection—plus gap up signals —help you spot trade opportunities and monitor market momentum.
Key Features Included:
- Multi-timeframe customizable moving averages (EMA/SMA)
- RS Rating with new high/low detection
- Buyable Gap Up signal identification
- Chart pattern detection
- Bullish/bearish inside bar highlights
Hope you guys do enjoy it!!!

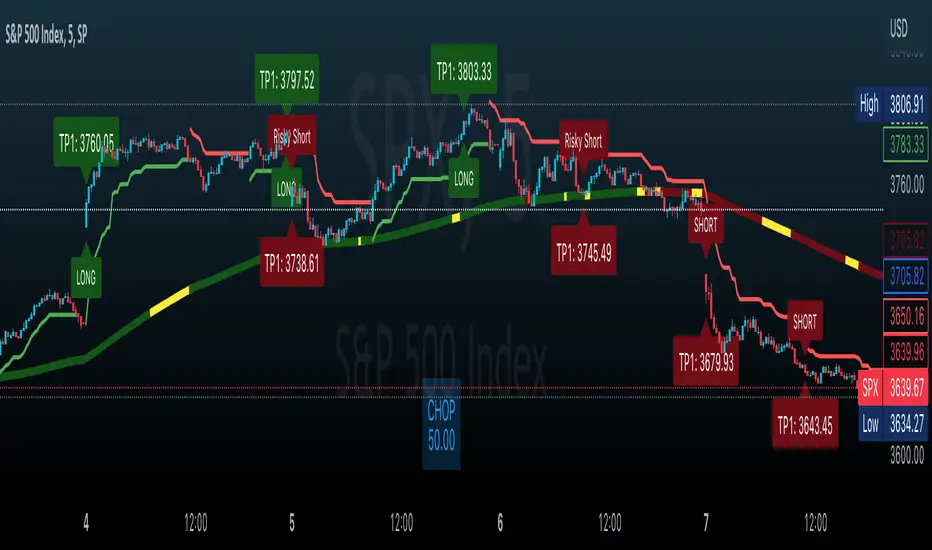
Effortless ScalpingEffortless Scalping is an indicator that primarily is used for stock options trading.
Effortless Scalping is based off of momentum. Our script takes into account the price action, volume, and historical data points of a stock to give potential "buy" and "sell" areas.
Effortless Scalping is a protected script because its Buy and Sell signals are based off of custom coded confirmations. This is what makes our script unique. We also have custom coded CHOP Filters in the indicator.
Effortless Scalping has a custom EMA line that flows with the trend of the market. It also changes colors to indicate a bullish or bearish trend . It also will change into a yellow color if the CHOP of the market exceeds your allowance. This EMA line is the only "classic" element of our custom coded script.
You can easily use Effortless Scalping by applying it straight to your chart. You can customize several visual effects in the settings menu.
Effortless Scalping also has two types of signals--RISKY signals and normal signals. Risky signals have a higher risk, but also a higher reward.
Effortless Scalping also features take profit levels based off of ATR levels.
Effortless Scalping also has custom support and resistance lines to better help you analyze the movement of a stock. These levels are based off of pivot levels.
Effortless Scalping can not predict the future move of a stock. Our script uses historical data points to alert POTENTIAL entries. These historical data points by NO MEANS predict the future movement of the market.
Effortless Scalping was created to help me understand the movement of a stock and why it may be moving in that direction. I personally found success using this script. I am sharing it because I am hoping that others find success in this script as well. I also like to trade quite frequently, and several times a day, so I made an indicator that is both accurate and alerts frequently.
This indicator does NOT provide financial advice. It is intended for general use only.
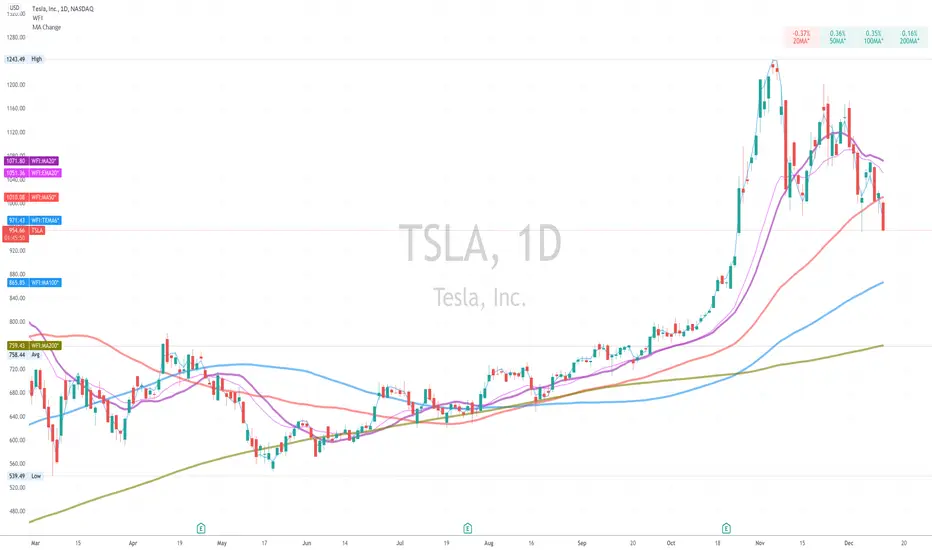
Change of Moving Averages - TableChange of Moving Averages is a companion table that shows the change of the major moving averages rather than the moving averages themselves in order to more easily interpret momentum.
It can be used for an SMA , EMA , TEMA or VWMA averages with an adjustable source, length and time offset. It uses a daily interval but it can be disabled in settings in order to show the selected interval. The number of days used to calculate the change can be adjusted however this may produce unexpected results if the change is calculated across a peak or trough of the moving average.
More interested in the change of the moving averages over time? Check out "Change in Moving Averages - Chart":
Have modification ideas for this indicator? Just let me know and I will gladly consider them!
Change of Moving Averages - ChartChange of Moving Averages charts the change of the major moving averages rather than the moving averages themselves. This is done in a separate panel, rather than being overlaid in order to more easily interpret momentum.
Change of Moving Averages has dual colored lines, in order to better see when the MA has crossed zero(dotted line). It can be used for an SMA , EMA , TEMA or VWMA averages with an adjustable source, length and time offset. It uses a daily interval but it can be disabled in settings in order to show the selected interval. The number of days used to calculate the change can be adjusted however this may produce unexpected results if the change is calculated across a peak or trough of the moving average.
More interested in just the latest change in the moving averages? Check out the "Change in Moving Averages - Table", which is a simple overlay table:
Have modification ideas for this indicator? Just let me know and I will gladly consider them!

Momentum Sentiment Indicator by mattzabThis indicator uses 3 moving averages and includes volume to display sentiment and momentum.
By default, a 5, 8, and 13 SMA is displayed (black lines).
The colored bands are the corresponding volume weighted moving averages.
When the colored band is above the black line, sentiment is bullish.
Think of the color as being a show of volume, and the black lines as support and resistance.
When the lines are trending up, and colors are above the black lines, an uptrend is in progress.
When the colors are mixed above and below, and the lines are intertwined, it is a ranging market.
The lines operate similar to the Williams Alligator.

Composite Buy/Sell Score [-100 to +100] by LMComposite Buy/Sell Score (Stabilized + Sensitivity) by LM
Description:
This indicator calculates a composite trend strength score ranging from -100 to +100 by combining multiple popular technical indicators into a single, smoothed metric. It is designed to give traders a clear view of bullish and bearish trends, while filtering out short-term noise.
The score incorporates signals from:
PPO (Percentage Price Oscillator) – measures momentum via the difference between fast and slow EMAs.
ADX (Average Directional Index) – detects trend strength.
RSI (Relative Strength Index) – identifies short-term momentum swings.
Stochastic RSI – measures RSI momentum and speed of change.
MACD (Moving Average Convergence Divergence) – detects momentum shifts using EMA crossovers.
Williams %R – highlights overbought/oversold conditions.
Each component is weighted, smoothed, and optionally confirmed across a configurable number of bars, producing a stabilized composite score that reacts more reliably to significant trend changes.
Key Features:
Smoothed Composite Score
The final score is smoothed using an EMA to reduce volatility and emphasize meaningful trends.
A Sensitivity Multiplier allows traders to exaggerate the score for stronger trend signals or dampen it for quieter markets.
Customizable Inputs
You can adjust each indicator’s parameters, smoothing lengths, and confirm bars to suit your preferred timeframe and trading style.
The sensitivity multiplier allows fine-tuning the responsiveness of the trend line without changing underlying indicator calculations.
Visual Representation
Score Line: Green for positive (bullish) trends, red for negative (bearish) trends, gray near neutral.
Reference Lines:
0 = neutral
+100 = maximum bullish
-100 = maximum bearish
Adaptive Background: Optionally highlights the background intensity proportional to trend strength. Strong green for bullish trends, strong red for bearish trends.
Multi-Indicator Integration
Combines momentum, trend, and overbought/oversold signals into a single metric.
Helps identify clear entry/exit trends while avoiding whipsaw noise common in individual indicators.
Recommended Use:
Trend Identification: Look for sustained movement above 0 for bullish trends and below 0 for bearish trends.
Exaggerated Trends: Use the Sensitivity Multiplier to emphasize strong trends.
Filtering Noise: The smoothed score and confirmBars settings help reduce false signals from minor price fluctuations.
Inputs Overview:
Input Purpose
PPO Fast EMA / Slow EMA / Signal Controls PPO momentum sensitivity
ADX Length / Threshold Detects trend strength
RSI Length / Overbought / Oversold Measures short-term momentum
Stoch RSI Length / %K / %D Measures speed of RSI changes
MACD Fast / Slow / Signal Measures momentum crossover
Williams %R Length Detects overbought/oversold conditions
Final Score Smoothing Length EMA smoothing for final composite score
Confirm Bars for Each Signal Number of bars used to confirm individual indicator signals
Sensitivity Multiplier Scales the final composite score for exaggerated trend response
Highlight Background by Trend Strength Enables adaptive background coloring
This indicator is suitable for traders looking for a single, clear trend metric derived from multiple indicators. It can be applied to any timeframe and can help identify both strong and emerging trends in the market.

Momentum ContinuationMomentum Continuation - By racy_1
The Momentum Continuation indicator helps traders identify high-probability continuation points in established trends — where momentum is likely to resume after a controlled pullback or brief pause.
Concept
At its core, the indicator tracks the relationship between two EMAs (fast and slow) to define the local trend direction, then checks whether multiple higher-timeframe trends support that trend.
When alignment occurs across all selected timeframes, and price confirms a continuation move, the script highlights the corresponding bar — signalling potential momentum re-entry opportunities.
Key Features
Dual EMA Band: Visual representation of short- and medium-term trend structure, with optional shading for clarity.
Multi-Timeframe Alignment: Up to 3 configurable higher timeframes ensure trend agreement before signalling continuation.
Continuation Triggers: Highlights candles where momentum resumes after a pullback or reclaim, confirming that trend structure remains intact.
Optional Distance Filter: Adds a configurable minimum distance (by % or ATR multiples) from the fast EMA to improve signal quality.
Pierce-and-Reclaim Logic: Optionally allows signals where price briefly violated the EMA band but reclaimed direction without breaking alignment.
No-Repaint Option: Choose between *Closed-Bar HTF Mode* (safer, slightly delayed) and *Live HTF Mode* (faster, may flicker).
Built-in Alerts: Receive notifications for both continuation triggers and trend-state changes (e.g., Trending Up / Trending Down).
How to Use
Select your fast and slow EMA lengths (default 8 / 24).
Configure HTF1–3 to define which higher timeframes must align (or leave any blank to ignore).
Enable “Continuation Logic” to activate triggers, bar highlights, and alerts.
Optionally enable Pierce-and-Reclaim or apply a distance filter for stricter setups.
Look for highlighted bars (and alerts) confirming momentum continuation in the prevailing trend direction.
Tips
Works on any asset and timeframe, but performs best on clean, trending instruments.
Combine with market structure or liquidity analysis to time entries more precisely.
The HTF Closed-Bar option is recommended for backtesting and signal reliability.
Disclaimer
This script is for educational and informational purposes only.
It does not constitute financial advice. Always manage risk appropriately before making any trading decision.
Momentum-Based Fair Value Gaps [BackQuant]Momentum-Based Fair Value Gaps
A precision tool that detects Fair Value Gaps and color-codes each zone by momentum, so you can quickly tell which imbalances matter, which are likely to fill, and which may power continuation.
What is a Fair Value Gap
A Fair Value Gap is a 3-candle price imbalance that forms when the middle candle expands fast enough that it leaves a void between candle 1 and candle 3.
Bullish FVG : low > high . This marks a bullish imbalance left beneath price.
Bearish FVG : high < low . This marks a bearish imbalance left above price.
These zones often act as magnets for mean reversion or as fuel for trend continuation when price respects the gap boundary and runs.
Why add momentum
Not all gaps are equal. This script measures momentum with RSI on your chosen source and paints each FVG with a momentum heatmap. Strong-momentum gaps are more likely to hold or propel continuation. Weak-momentum gaps are more likely to fill.
Core Features
Auto FVG Detection with size filters in percent of price.
Momentum Heatmap per gap using RSI with smoothing. Multiple palettes: Gradient, Discrete, Simple, and scientific schemes like Viridis, Plasma, Inferno, Magma, Cividis, Turbo, Jet, plus Red-Green and Blue-White-Red.
Bull and Bear Modes with independent toggles.
Extend Until Filled : keep drawing live to the right until price fully fills the gap.
Auto Remove Filled for a clean chart.
Optional Labels showing the smoothed RSI value stored at the gap’s birth.
RSI-based Filters : only accept bullish gaps when RSI is oversold and bearish gaps when RSI is overbought.
Performance Controls : cap how many FVGs to keep on chart.
Alerts : new bullish or bearish FVG, filled FVG, and extreme RSI FVGs.
How it works
Source for Momentum : choose Returns, Close, or Volume.
Returns computes percent change over a short lookback to focus on impulse quality.
RSI and Smoothing : RSI length and a small SMA smooth the signal to stabilize the color coding.
Gap Scan : each bar checks for a 3-candle bullish or bearish imbalance that also clears your minimum size filter in percent of price.
Heatmap Color : the gap is painted at creation with a color from your palette based on the smoothed RSI value, preserving the momentum signature that formed it.
Lifecycle : if Extend Unfilled is on, the zone projects forward until price fully trades through the far edge. If Auto Remove is on, a filled gap is deleted immediately.
How to use it
Scan for structure : turn on both bullish and bearish FVGs. Start with a moderate Min FVG Size percent to reduce noise. You will see stacked clusters in trends and scattered singletons in chop.
Read the colors : brighter or stronger palette values imply stronger momentum at gap formation. Weakly colored gaps are lower conviction.
Decide bias : bullish FVGs below price suggest demand footprints. Bearish FVGs above price suggest supply footprints. Use the heatmap and RSI value to rank importance.
Choose your playbook :
Mean reversion : target partial or full fills of opposing FVGs that were created on weak momentum or that sit against higher timeframe context.
Trend continuation : look for price to respect the near edge of a strong-momentum FVG, then break away in the direction of the original impulse.
Manage risk : in continuation ideas, invalidation often sits beyond the opposite edge of the active FVG. In reversion ideas, invalidation sits beyond the gap that should attract price.
Two trade playbooks
Continuation - Buy the hold of a bullish FVG
Context uptrend.
A bullish FVG prints with strong RSI color.
Price revisits the top of the gap, holds, and rotates up. Enter on hold or first higher low inside or just above the gap.
Invalidation: below the gap bottom. Targets: prior swing, measured move, or next LV area.
Reversion - Fade a weak bearish FVG toward fill
Context range or fading trend.
A bearish FVG prints with weak RSI color near a completed move.
Price fails to accelerate lower and rotates back into the gap.
Enter toward mid-gap with confirmation.
Invalidation: above gap top. Target: opposite edge for a full fill, or the gap midline for partials.
Key settings
Max FVG Display : memory cap to keep charts fast. Try 30 to 60 on intraday.
Min FVG Size % : sets a quality floor. Start near 0.20 to 0.50 on liquid markets.
RSI Length and Smooth : 14 and 3 are balanced. Increase length for higher timeframe stability.
RSI Source :
Returns : most sensitive to true momentum bursts
Close : traditional.
Volume : uses raw volume impulses to judge footprint strength.
Filter by RSI Extremes : tighten rules so only the most stretched gaps print as signals.
Heatmap Style and Palette : pick a palette with good contrast for your background. Gradient for continuous feel, Discrete for quick zoning, Simple for binary, Palette for scientific schemes.
Extend Unfilled - Auto Remove : choose live projection and cleanup behavior to match your workflow.
Reading the chart
Bullish zones sit beneath price. Respect and hold of the upper boundary suggests demand. Strong green or warm palette tones indicate impulse quality.
Bearish zones sit above price. Respect and hold of the lower boundary suggests supply. Strong red or cool palette tones indicate impulse quality.
Stacking : multiple same-direction gaps stacked in a trend create ladders. Ladders often act as stepping stones for continuation.
Overlapping : opposing gaps overlapping in a small region usually mark a battle zone. Expect chop until one side is absorbed.
Workflow tips
Map higher timeframe trend first. Use lower timeframe FVGs for entries aligned with the higher timeframe bias.
Increase Min FVG Size percent and RSI length for noisy symbols.
Use labels when learning to correlate the RSI numbers with your palette colors.
Combine with VWAP or moving averages for confluence at FVG edges.
If you see repeated fills and refills of the same zone, treat that area as fair value and avoid chasing.
Alerts included
New Bullish FVG
New Bearish FVG
Bullish FVG Filled
Bearish FVG Filled
Extreme Oversold FVG - bullish
Extreme Overbought FVG - bearish
Practical defaults
RSI Length 14, Smooth 3, Source Returns.
Min FVG Size 0.25 percent on liquid majors.
Heatmap Style Gradient, Palette Viridis or Turbo for contrast.
Extend Unfilled on, Auto Remove on for a clean live map.
Notes
This tool does not predict the future. It maps imbalances and momentum so you can frame trades with clearer context, cleaner invalidation, and better ranking of which gaps matter. Use it with risk control and in combination with your broader process.

MomentumMap — Relative Strength Visual Quadrant (RRG-Inspired)🔍 What is MomentumMap?
MomentumMap brings the concept of Relative Rotation Graphs (RRG) directly to your chart.
It helps you instantly see whether a symbol is leading, improving, weakening, or lagging — without scanning dozens of charts.
Unlike traditional RS indicators, this tool plots RS Ratio and RS Momentum together, classifying the current condition into clear quadrants.
🧩 Quadrant Logic
Zone Conditions Market Behavior
🟢 Power Zone RS > 1, Momentum > 0 Strong, leading, expanding trend
🟡 Drift Zone RS > 1, Momentum < 0 Cooling off after leadership
🔵 Lift Zone RS < 1, Momentum > 0 Early signs of strength emerging
🔴 Dead Zone RS < 1, Momentum < 0 Weak and lagging phase
Each bar’s background color reflects the active zone — giving instant visual feedback on rotation strength.
⚙️ Key Features
Benchmark-based RS Ratio & RS Momentum mapping
Auto-classified quadrant display with live background coloring
Optional Power Zone alert (with volume confirmation)
Adjustable RS smoothing and momentum periods
Works on all instruments and timeframes
💡 How to Use
Apply the indicator to any chart.
Choose your benchmark symbol (default: NSE:CNX500).
Observe the color-coded zones to assess strength rotation.
Use transitions between zones to identify:
New leadership → 🟢 Power Zone
Early rotation → 🔵 Lift Zone
Loss of strength → 🟡 Drift Zone
Weak performers → 🔴 Dead Zone
⚠️ Notes & Disclaimer
MomentumMap is an analytical visualization tool, not a buy/sell signal generator.
Choose benchmarks and timeframes that match your trading universe.
The script does not repaint and uses only confirmed bar data.
Past quadrant behavior does not guarantee future results.
Complies with TradingView’s open-source and originality guidelines.
📚 Credits
Concept inspired by Julius de Kempenaer’s RRG framework
Implementation and logic developed independently by Paritosh Gupta

LBR 3/10 'Sardine' Oscillator (ATR-Normalized)LBR 3/10 Oscillator - Short-Term Momentum Indicator
The LBR 3/10 "Sardine" Oscillator is a short-term momentum indicator developed by Linda Bradford Raschke. This ATR-normalized version provides cross-market comparability and consistent extreme levels across all timeframes and asset classes.
What is the LBR 3/10 Oscillator?
The LBR 3/10 is designed to capture very short-term momentum shifts by measuring the difference between a 3-period and 10-period moving average. Named after Linda Bradford Raschke's "Trading Sardines" book, this oscillator excels at identifying rapid momentum changes and potential reversal points.
Formula: / ATR(10) × 100
Where MA can be either Simple Moving Average (SMA) or Exponential Moving Average (EMA).
Why ATR Normalization?
Problem with Traditional Oscillators:
Traditional momentum oscillators produce values that vary dramatically across different markets and time periods. A reading of 5 might be extreme for one asset but insignificant for another.
Solution:
ATR normalization divides the raw momentum value by the Average True Range, creating standardized readings that are:
Comparable Across Markets: Same interpretation whether analyzing stocks, forex, commodities, or crypto
Comparable Across Time: Readings maintain consistent meaning regardless of price levels
Universal Extreme Levels: The ±125 levels work consistently across all assets and timeframes
Statistical Research
Extensive statistical analysis across multiple markets identified the ±125 extreme levels:
+125 Level: Reached approximately 4% of the time (extreme bullish momentum)
-125 Level: Reached approximately 2% of the time (extreme bearish momentum)
These statistically-validated levels provide objective definitions for overbought and oversold conditions, eliminating subjective interpretation.
Key Features
Core Components
LBR 3/10 Line: Main oscillator showing normalized short-term momentum
Signal Line: Smoothed moving average of the oscillator (default: 9-period)
Extreme Levels: Horizontal lines at ±125 marking statistical extremes
Zero Line: Separates bullish and bearish momentum regimes
Visual Elements
Blue Line: LBR 3/10 oscillator (main momentum line)
Red Line: Signal line (smoothed moving average of oscillator)
Fill Area: Light blue shaded region between oscillator and signal line
Background Zones: Light red (overbought above +125) or light green (oversold below -125)
Horizontal Lines: Gray dashed lines at +125, -125, and 0 (zero line solid)
Divergence Markers: Green/red circles marking price/oscillator divergences
Signal Crosses: Small green/red triangles marking oscillator/signal line crossovers
Pullback Markers: Yellow diamond shapes with white "↑PB" or "↓PB" text for first pullback signals
Std Dev Bands: Orange circles marking statistical extreme levels (optional, disabled by default)
Advanced Features
MA Type Selection: Choose between SMA or EMA for both oscillator and signal line
Standard Deviation Bands: Optional adaptive extreme levels based on statistical volatility
Pullback Detection: Identifies high-probability counter-trend entries during established trends
First Pullback Filter: Noise reduction system that highlights initial pullback after trend change
Trading Applications
1. Extreme Level Reversals
When the oscillator reaches ±125, it indicates stretched momentum conditions:
Above +125: Overbought - watch for bearish reversal signals
Below -125: Oversold - watch for bullish reversal signals
2. Signal Line Crossovers
Bullish Cross: Oscillator crosses above signal line (momentum shift up)
Bearish Cross: Oscillator crosses below signal line (momentum shift down)
3. Zero Line Crosses
Signal line crossing zero indicates trend regime changes:
Cross Above 0: Transition to bullish trend
Cross Below 0: Transition to bearish trend
4. Divergence Trading
Bullish Divergence: Price makes lower low, oscillator makes higher low
Bearish Divergence: Price makes higher high, oscillator makes lower high
Best used in combination with other momentum indicators for confirmation
5. Pullback Strategy (High-Probability Setup)
Uptrend Pullback: Signal line positive + oscillator crosses below (buy opportunity)
Downtrend Pullback: Signal line negative + oscillator crosses above (sell opportunity)
First Pullback: Initial counter-trend signal after trend change (highest probability)
6. "Anti" Setup
Linda Bradford Raschke's classic setup:
Wait for extreme reading (±125)
Enter on first pullback signal in opposite direction
Captures momentum exhaustion reversals
Comprehensive Alert System
Extreme Level Alerts
Crossed above +125 (overbought)
Crossed below -125 (oversold)
Divergence Alerts
Bullish divergence detected
Bearish divergence detected
Signal Cross Alerts
Bullish cross (oscillator above signal)
Bearish cross (oscillator below signal)
Trend Change Alerts
Signal line crossed above zero (trend change to bullish)
Signal line crossed below zero (trend change to bearish)
Pullback Alerts
Pullback in uptrend (potential buy)
Pullback in downtrend (potential sell)
FIRST pullback in uptrend (high-probability buy)
FIRST pullback in downtrend (high-probability sell)
Settings & Parameters
LBR 3/10 Settings
Fast MA Length: Short-term period (default: 3)
Slow MA Length: Baseline period (default: 10)
ATR Length: Volatility normalization period (default: 10)
MA Type: SMA or EMA selection
Extreme High Level: Overbought threshold (default: 125)
Extreme Low Level: Oversold threshold (default: -125)
Signal Line
Show Signal Line: Enable/disable display (default: true)
Signal Line Length: Smoothing period (default: 9)
Divergence Detection
Show Divergences: Enable/disable detection (default: true)
Divergence Lookback: Pivot detection period (default: 5)
Standard Deviation Bands
Show Std Dev Bands: Enable/disable adaptive levels (default: false)
Std Dev Multiplier: Band width adjustment (default: 1.5)
Std Dev Length: Calculation period (default: 100)
Best Practices
Trending Markets
Focus on pullback signals in direction of trend
Use first pullback filter for highest-probability entries
Watch for extreme levels as profit-taking zones
Ranging Markets
Trade reversals at extreme levels (±125)
Use divergences with additional momentum indicator confirmation
Avoid signal line crosses near zero (low-quality signals)
Multi-Timeframe Analysis
Higher timeframe: Identify trend direction (signal line above/below zero)
Lower timeframe: Time precise entries using pullback signals
Confirmation: Use additional momentum indicators for signal validation
Risk Management
Reduce position size at extreme levels (increased reversal risk)
Use ATR-based stops (e.g., 2× ATR from entry)
Exit on opposite extreme level or signal line zero cross
Chart Legend - Visual Signal Guide
Lines and Fills
🔵 Blue Line: LBR 3/10 oscillator value
🔴 Red Line: Signal line (9-period MA of oscillator)
💠 Light Blue Fill: Area between oscillator and signal line (visual momentum gauge)
Background Colors
🟥 Light Red Background: Extreme overbought zone (LBR > +125)
🟩 Light Green Background: Extreme oversold zone (LBR < -125)
Horizontal Reference Lines
➖ +125 (Gray Dashed): Overbought extreme level
➖ 0 (Gray Solid): Zero line - trend separator
➖ -125 (Gray Dashed): Oversold extreme level
Signal Markers
🟢 Green Circle: Bullish divergence detected (price lower low, oscillator higher low)
🔴 Red Circle: Bearish divergence detected (price higher high, oscillator lower high)
▲ Green Triangle Up: Bullish signal cross (oscillator crosses above signal line)
▼ Red Triangle Down: Bearish signal cross (oscillator crosses below signal line)
Yellow Diamond "↑PB": First pullback in uptrend (high-probability buy setup)
Yellow Diamond "↓PB": First pullback in downtrend (high-probability sell setup)
Combining with MACD-V+ Indicator
LBR 3/10 and MACD-V+ work together as a powerful two-timeframe momentum system:
Indicator Roles
MACD-V+: Strategic direction (12-26 period) - identifies market regime and lifecycle state
LBR 3/10: Tactical timing (3-10 period) - pinpoints precise entry and exit moments
Key Principles
Strategic Filter: MACD-V+ determines IF you should trade (market regime)
Tactical Timing: LBR 3/10 determines WHEN to enter (precise timing)
Confirmation Reduces Risk: Trade only when both indicators agree
Respect Lifecycle Changes: Exit when MACD-V+ state changes against your position
Methodology
The LBR 3/10 indicator implements statistical analysis and volatility normalization techniques to create a universal short-term momentum tool. This approach enables consistent interpretation across all markets and timeframes.
The indicator implements:
ATR-based normalization for cross-market comparability
Statistical extreme level validation (±125 levels)
Noise reduction through first pullback filtering
Dual MA type support (SMA/EMA) for flexibility
Standard deviation bands for adaptive threshold levels
LBR 3/10 provides traders with a precise tool for short-term momentum analysis and tactical entry timing. Combined with proper risk management and multi-timeframe analysis, it offers objective signals for both trend-following and reversal trading strategies.
This indicator is designed for educational and analytical purposes. Past performance does not guarantee future results. Always conduct thorough research and consider consulting with financial professionals before making investment decisions.

MACD-V+MACD-V+ Indicator - Advanced Momentum Analysis
The MACD-V+ indicator is an enhanced version of the volatility-normalized MACD methodology developed by Alex Spiroglou. This approach addresses critical limitations of traditional MACD through ATR-based volatility normalization, providing comparable values across time and markets.
What is MACD-V?
MACD-V applies Average True Range (ATR) normalization to traditional MACD, creating a universal momentum indicator that works consistently across all markets and timeframes. The methodology was developed through extensive statistical research analyzing multiple markets and timeframes.
Formula: × 100
This normalization transforms MACD from price-dependent values into standardized momentum readings.
Traditional MACD Limitations
Limitation 1: Non-Comparable Values Across Time
Traditional MACD values cannot be compared across different time periods due to varying price levels. S&P 500 maximum MACD was 1.56 in 1957-1971, but reached 86.31 in 2019-2021 - not indicating 55x stronger momentum, but simply different price scales.
Solution: MACD-V provides comparable historical values where a reading of 100 today has the same mathematical meaning as 100 in any previous period.
Limitation 2: Non-Comparable Across Markets
Traditional MACD cannot compare momentum between different assets. S&P 500 MACD of 65 versus EUR/USD MACD of -0.5 reflects price differences, not relative strength.
Solution: MACD-V creates universal levels that work across all markets. The ±150 extreme levels apply consistently whether analyzing stocks, bonds, commodities, or currencies.
Limitation 3: No Objective Momentum System
Traditional MACD lacks universal overbought or oversold level definitions, making systematic analysis difficult.
Solution: MACD-V provides an objective 7-stage momentum lifecycle system with clearly defined zones and state transitions.
Limitation 4: Signal Line False Signals
In low momentum environments, traditional MACD generates multiple false signals as the line oscillates near zero.
Solution: MACD-V filters signal quality by identifying neutral zones (-50 to +50) where signal reliability is lower.
Limitation 5: Signal Line Timing Lag
During extreme momentum, traditional MACD signal line lags significantly due to large separation from the MACD line.
Solution: MACD-V anticipates timing issues in extreme momentum environments (±150) through zone-based analysis and lifecycle states.
Universal Application
MACD-V+ works across:
Individual Stocks
Forex Pairs
Commodity Futures
Cryptocurrencies
All Timeframes
Key Features
Zone System
Overbought Zone: Above +150 (extreme bullish momentum)
Rally Zone: +50 to +150 (strong bullish momentum)
Ranging Zone: -50 to +50 (neutral/low momentum)
Rebound Zone: -50 to -150 (strong bearish momentum)
Oversold Zone: Below -150 (extreme bearish momentum)
7-Stage Lifecycle States
Ranging: Neutral momentum in -50 to +50 zone
Rallying: Rally zone + MACD above Signal + rising momentum
Overbought: Extreme zone above +150
Retracing: Rally zone + MACD below Signal (pullback from overbought)
Reversing: Rebound zone + MACD below Signal + falling momentum
Oversold: Extreme zone below -150
Rebounding: Rebound zone + MACD above Signal (recovery from oversold)
Visual Status Display
Real-Time State Table: Shows current lifecycle state name
Color-Coded States: Blue (Rallying/Rebounding), Red (Overbought/Oversold), Orange (Retracing/Reversing), Gray (Ranging)
Strength Multiplier: Live histogram strength indicator (e.g., "x 1.45")
Enhanced Features (Plus)
Absolute Histogram MA: ATR-length moving average of absolute histogram values for strength measurement
Direction-Aware Display: MA line follows histogram sign (positive above 0, negative below 0)
Strength Multiplier: Current momentum vs. average strength ratio (always positive value)
Histogram Extreme Levels: Short-term overbought/oversold (±40) for pullback detection
Chart Legend - Visual Signal Guide
Lines and Histogram
🔵 Blue Line: MACD-V value (ATR-normalized momentum)
🟠 Orange Line: Signal line (9-period EMA of MACD-V)
📊 Histogram Bars: MACD-V minus Signal line (momentum differential)
Histogram Colors: Green shades (positive momentum), Red shades (negative momentum)
🟡 Yellow Line: Dynamic MA of absolute histogram values (follows histogram sign)
Background Colors
🟥 Light Red Background: Extreme overbought zone (MACD-V > +150)
🟩 Light Green Background: Extreme oversold zone (MACD-V < -150)
Horizontal Reference Lines
➖ +150 (Gray Dashed): Overbought extreme level
➖ +50 (Gray Dashed): Rally zone entry level
➖ 0 (Gray Solid): Zero line - trend separator
➖ -50 (Gray Dashed): Rebound zone entry level
➖ -150 (Gray Dashed): Oversold extreme level
Optional Histogram Levels
➖ +40 (Yellow Dashed): Histogram short-term overbought
➖ -40 (Yellow Dashed): Histogram short-term oversold
Status Table
📋 Top-Center Table: Current lifecycle state display
State Name: RANGING / RALLYING / OVERBOUGHT / RETRACING / REVERSING / OVERSOLD / REBOUNDING
Histogram Warning: Short-term overbought/oversold alerts (±40 levels)
State Label
📊 Label at MACD/Signal Midpoint: Current lifecycle state with strength analysis
State Name: RANGING / RALLYING / OVERBOUGHT / RETRACING / REVERSING / OVERSOLD / REBOUNDING
Strength Multiplier Interpretation:
- Strong acceleration (>1.75): Powerful momentum, trend continuation likely
- Moderate progression (1.25-1.75): Normal trend strength
- Trend continuation (0.75-1.25): Stable momentum near average
- Watch for reversal (0.25-0.75): Weakening momentum
- Trend exhaustion (<0.25): Very weak momentum, reversal possible
Trading Applications
1. Lifecycle State Trading
Enter Long: When state changes to "RALLYING" (strong bullish momentum established)
Enter Short: When state changes to "REVERSING" (strong bearish momentum established)
Exit/Reduce: When state reaches "OVERBOUGHT" or "OVERSOLD" (extreme levels)
Avoid Trading: When state is "RANGING" (low momentum, unreliable signals)
2. Zone-Based Trading
Rally Zone (+50 to +150): Look for pullback entries (histogram dips)
Rebound Zone (-50 to -150): Look for bounce entries (histogram rises)
Extreme Zones (±150+): Prepare for reversal or take profits
Ranging Zone (-50 to +50): Wait for breakout confirmation
3. Signal Line Crossovers
Bullish Cross: MACD-V crosses above Signal line (momentum shift up)
Bearish Cross: MACD-V crosses below Signal line (momentum shift down)
Quality Filter: Trust crossovers in Rally/Rebound zones, ignore in Ranging zone
4. Zero Line Crosses
Cross Above 0: Transition to bullish regime
Cross Below 0: Transition to bearish regime
Trend Confirmation: Strong trends keep MACD-V on same side of zero
5. Histogram Extreme Strategy
Above +40: Short-term overbought - potential pullback
Below -40: Short-term oversold - potential bounce
Use with Trend: Buy dips to -40 in uptrend, sell rallies to +40 in downtrend
6. Strength Multiplier Analysis
> 1.75: Strong acceleration - powerful momentum, trend continuation highly likely
1.25 to 1.75: Moderate progression - normal healthy trend strength
0.75 to 1.25: Trend continuation - stable momentum near average strength
0.25 to 0.75: Watch for reversal - momentum weakening significantly
< 0.25: Trend exhaustion - very weak momentum, reversal possible
Comprehensive Alert System
Lifecycle State Change Alerts
Range Entered (low momentum warning)
Rally Started (bullish momentum established)
Overbought Reached (extreme bullish level)
Overbought Exit (leaving extreme zone)
Retracing Started (pullback from overbought)
Reversal Started (bearish momentum established)
Oversold Reached (extreme bearish level)
Oversold Exit (leaving extreme zone)
Rebounding Started (recovery from oversold)
Alert Builder Integration
Binary outputs (1/0) for external alert systems:
Individual state flags for each of 7 lifecycle states
Strength multiplier value for programmatic trend assessment
Settings & Parameters
MACD Configuration
MACD Fast: Fast EMA period (default: 12)
MACD Slow: Slow EMA period (default: 26)
Signal Line: Signal smoothing period (default: 9)
Source: Price source (default: Close)
Zone Boundaries
Overbought: Extreme bullish level (default: 150)
Oversold: Extreme bearish level (default: -150)
Rally: Strong bullish zone entry (default: 50)
Rebound: Strong bearish zone entry (default: -50)
Histogram Bounds
Histogram OB: Short-term overbought (default: 40)
Histogram OS: Short-term oversold (default: -40)
Trend Filters
MA Type: Histogram strength MA calculation method (None / SMA / EMA)
Show Elder Impulse Plus: Bar color system based on EMA(13) + histogram direction
200 EMA trend: Trend Filter v1 - Bull/Bear classification (adaptive MACD-V levels)
50/200 EMA 6-stage: Trend Filter v2 - Chuck Dukas Diamond 6-stage market classification
Best Practices
Trending Markets
Focus on "RALLYING" or "REVERSING" states for entries
Use histogram pullbacks (±40) for position additions
Monitor strength multiplier - exit if drops below 0.25
Take profits in extreme zones (±150+)
Yellow MA crossing histogram warns of momentum shift
Ranging Markets
Avoid trading when state is "RANGING"
Wait for clear zone entry (Rally/Rebound zone)
Use shorter timeframes for precision
Reduce position sizes due to lower reliability
Multi-Timeframe Analysis
Higher timeframe: Identify market regime (lifecycle state)
Lower timeframe: Time precise entries (histogram pullbacks)
Alignment: Trade only when both timeframes agree on direction
Risk Management
Reduce position size in extreme zones (±150+)
Use lifecycle state changes for stop-loss placement
Scale out of positions when strength multiplier < 0.25
Avoid counter-trend trades in strong states (RALLYING/REVERSING)
Watch yellow MA - when it crosses below histogram absolute value, momentum weakening
Combining with LBR 3/10-V Indicator
MACD-V+ and LBR 3/10-V create a powerful two-timeframe momentum system for strategic direction and tactical timing.
Strategic Filter: MACD-V+ determines WHETHER to trade (market regime)
Tactical Precision: LBR 3/10-V determines WHEN to enter (timing)
Double Confirmation: Both indicators must agree on direction
Lifecycle Management: Exit when MACD-V+ state changes
Strength Validation: Use MACD-V+ multiplier for position sizing
Extreme Respect: Both hitting extremes = high reversal probability
Methodology
MACD-V methodology is based on volatility normalization using Average True Range (ATR). This approach transforms traditional MACD into a universal momentum indicator with statistically-validated zones and objectively-defined states.
The indicator implements:
ATR-based normalization for cross-market comparability
Statistical analysis for universal zone definitions (±150, ±50)
Lifecycle state system for objective trend identification
Absolute histogram MA with direction-aware visualization (ATR-length period)
Strength multiplier: ratio of current to average absolute momentum (always positive)
Dynamic status table adapting to active trend filters
MACD-V+ transforms momentum analysis from subjective interpretation into objective, quantifiable measurements. Combined with LBR 3/10-V for tactical timing, it provides a complete framework for systematic trading across all financial markets and timeframes.
This indicator is designed for educational and analytical purposes. Past performance does not guarantee future results. Always conduct thorough research and consider consulting with financial professionals before making investment decisions.

Momentum Volume Analyzer [CHE] Momentum Volume Analyzer — Adaptive momentum with volume-gated signals and expressive visual cues
Summary
This indicator combines a normalized momentum oscillator with a volume Z-score gate and adaptive gradient visuals. The oscillator centers around a midline and scales between a lower and an upper bound. Intensity is derived from the distance to the midline and is normalized inside a rolling window, which helps keep contrast consistent across regimes. Volume pressure is compressed to a discrete level between one and ten and is used to qualify momentum flips and extremes. Layered “burst” markers and optional background gradients provide immediate visual emphasis without adding new data sources. Pine version is v6. The script runs in a separate pane.
Motivation: Why this design?
Common oscillators flip rapidly during noisy conditions or flatten during calm periods, which obscures actionable shifts. A rolling normalization keeps the visual intensity stable across different regimes, and a volume gate reduces reactions when participation is weak. The goal is clearer momentum shifts that are supported by measurable activity rather than cosmetic smoothing alone.
What’s different vs. standard approaches?
Baseline reference: Classical RSI-style oscillators or simple filtered momentum without volume gating.
Architecture differences:
Local window normalization with gamma control for contrast.
Volume converted to a Z-score and compressed into a discrete level between one and ten with a configurable cap.
Directional color gradients that intensify with distance from the midline.
Layered glow markers with optional trail and an internal label budget to avoid UI overload.
Practical effect: Signals are visually stronger only when both momentum and volume align; background and line colors convey regime strength at a glance.
How it works (technical)
Momentum core: A high-pass path with automatic gain control produces a bounded oscillator centered around a midline. A simple moving average smooths the result over a short window.
Normalization and contrast: The absolute distance from the midline is scaled inside a rolling window and limited between zero and one. Two gamma parameters separately shape contrast for the line and for labels.
Coloring: When the oscillator is above the midline, a green gradient is used; below the midline, a red gradient is used. Intensity increases with normalized distance. Optional area fill to the midline and a background gradient reinforce strength.
Volume levels: Volume is standardized over a lookback window, clipped by a user cap, and mapped to a level between one and ten. Only positive excursions are considered; non-positive values map to zero.
Event markers: When the oscillator reaches extreme zones and the volume level is positive, the script spawns layered circular labels at fixed y-positions. A small trail can extend behind the event. An internal queue discards the oldest labels when a user-defined maximum is exceeded.
Alerts: Alerts fire on overbought and oversold spikes, midline shifts with minimum intensity and volume, and continuation patterns inside strong zones.
Parameter Guide
TFRSI length (default six): Core momentum lookback. Shorter values react faster but are less stable.
Signal SMA (default two): Light smoothing of the oscillator. Larger values reduce jitter.
Gradient window (default one hundred): Normalization window for intensity. Longer values produce steadier contrast but slower adaptation.
Line/marker transparency (default zero): Visual prominence of drawings. Higher values reduce dominance.
Background on and BG transparency (defaults true and eighty-five): Enables and tunes the pane background gradient.
Area fill to fifty and Fill transparency (defaults true and eighty): Fills between the oscillator and the midline.
Gamma bars/labels and Gamma plot (defaults zero point seven and zero point eight): Contrast shapers for markers and line. Higher values compress low intensities.
Bottom marker and Show last N (defaults true and three hundred thirty-three): Optional compact heat markers with a display cap.
Up/Down colors: Dark and neon pairs for positive and negative regimes.
Lookback (default two hundred) and Z cap (default five): Volume standardization window and clipping level before scaling to one through ten.
Enable bursts, Layers, Trail, Trail transparency, Max live labels, Size scale: Control the layered glow effect, trail length, opacity, label budget, and size multiplier. Reducing the size scale lowers visual dominance.
Spike min level, Shift min level, Min intensity, Rise/Fall length: Gates for alerts; adjust to balance sensitivity and false positives.
Reading & Interpretation
Line color and intensity: Green shades above the midline indicate bullish pressure; red shades below indicate bearish pressure. Stronger color corresponds to stronger normalized distance.
Background and fill: Reinforce regime strength; consider reducing transparency when the pane feels too busy.
Bursts and trails: Emphasize volume-backed extremes. Larger bursts reflect stronger volume levels or scaling choices.
Volume level: Internal level between one and ten. Levels near the upper bound signal exceptional activity.
Practical Workflows & Combinations
Trend following: Use midline cross upward with minimum shift level and intensity as a trigger. Confirm with structure such as higher highs and higher lows. For shorts, reverse the conditions.
Exits and risk: Fade exposure when intensity weakens toward the midline or when volume level drops below the shift threshold. Consider disabling bursts when monitoring many symbols.
Multi-asset and multi-timeframe: Defaults are designed to travel across liquid futures, large-cap equities, and major crypto pairs. For higher timeframes, increase the lookback window and consider reducing the Z cap.
Behavior, Constraints & Performance
Repaint and confirmation: Signals are evaluated on the live bar. They can appear and withdraw before bar close. For confirmed signals, require closed-bar alerts or manual confirmation.
Higher-timeframe sources: Not used. No `security` calls.
Resources: `max_bars_back` is two thousand. The script uses arrays and label objects, including loops for trails. The label budget mitigates clutter.
Known limits: Very illiquid symbols with unstable volume can reduce the usefulness of the Z-score. Sharp regime changes can still produce brief flips.
Sensible Defaults & Quick Tuning
Starting point: TFRSI length six, Signal two, Gradient window one hundred, Z cap five, Spike level six, Shift level four, Min intensity zero point four, Rise length three, Size scale zero point five.
Too many flips: Increase Signal, increase Gradient window, or raise Shift level.
Too sluggish: Decrease TFRSI length or reduce Gradient window.
Bursts too dominant: Lower Size scale or reduce Layers; increase Trail transparency or set Trail length to zero.
What this indicator is—and isn’t
This is a visualization and signal layer that couples momentum with a volume gate and adaptive visuals. It is not a complete trading system, optimizer, or predictor. Use it together with market structure, risk controls, and position management.
Disclaimer
The content provided, including all code and materials, is strictly for educational and informational purposes only. It is not intended as, and should not be interpreted as, financial advice, a recommendation to buy or sell any financial instrument, or an offer of any financial product or service. All strategies, tools, and examples discussed are provided for illustrative purposes to demonstrate coding techniques and the functionality of Pine Script within a trading context.
Any results from strategies or tools provided are hypothetical, and past performance is not indicative of future results. Trading and investing involve high risk, including the potential loss of principal, and may not be suitable for all individuals. Before making any trading decisions, please consult with a qualified financial professional to understand the risks involved.
By using this script, you acknowledge and agree that any trading decisions are made solely at your discretion and risk.
Best regards and happy trading
Chervolino

Momentum Concepts [A1TradeHub]ℹ️ General Information — TSI + Stochastic Z-Score (Momentum Duo)
Purpose: A two-oscillator stack that blends trend strength (TSI) with extreme-move normalization (Stochastic Z-Score) to time entries with confirmation instead of guessing tops/bottoms.
Components
Stochastic Z-Score (SZ): Converts price stretch into a bounded curve.
Red zone ≈ overbought supply, Green zone ≈ oversold demand.
The hook out of a band often marks turning points.
True Strength Index (TSI): Measures momentum quality and direction.
Signal/line cross = timing, Zero-line = trend filter, slope = acceleration.
Core Read
Alignment = edge: SZ leaves a band and TSI agrees (cross/slope).
Divergences: Higher-low on SZ/TSI vs lower-low in price (bullish). Lower-high on SZ/TSI vs higher-high in price (bearish). Best when near bands.
Mid-range = chop: Avoid trades when SZ is centered and TSI is flat.
Best Practices
Use structure (PDH/PDL, EMAs 13/48/200, trendlines) as context.
Scale profits into opposing SZ band or on TSI flatten/cross-back.
Place stops beyond the last swing or key EMA; skip high-volatility news.
Timeframes
Works on intraday (e.g., 5–15m) and swings (1h/4h). Use higher TF for bias, lower TF for entries.
This combo is designed to keep you on the right side of momentum, act at band hooks with TSI confirmation, and stand down when conditions are indecisive.
I. 🔴🟢 TSI Oscillator — Quick Guide
What you’re seeing
Lines: Fast TSI + slow Signal (both EMA-smoothed momentum).
Zones: 🟢 Green = oversold, 🔴 Red = overbought, 0-line = trend regime.
Long: 🟢 hook up → fast crosses above slow → ideally reclaim 0.
Short: 🔴 roll down → fast crosses below slow → ideally lose 0.
Exits: Trim into the opposite zone or on a cross back.
Divergence: TSI ↑ vs price ↓ = bullish; TSI ↓ vs price ↑ = bearish.
Avoid: Both lines chopping around 0.
II. Stochastic Z-Score — Quick Guide
Zones: 🔴 Red = overbought/supply, 🟢 Green = oversold/demand.
Curve: Watch the hook out of a zone for the turn.
Signals
🟢 Green Arrow (from Green zone): Momentum turns up → call/long bias. Enter on first pullback; stop under last swing/13-EMA.
🔻 Red/Bearish Arrow (from Red zone): Momentum rolls down → put/short bias. Enter on first lower-high; stop above last swing/13-EMA.
⚪ Ball = Momentum Shift: Early heads-up (slope change). Use as confirmation/add-on, not a standalone entry.

Momentum RS | QuantumResearch🚀 Momentum RS | QuantumResearch
Momentum RS is a relative strength-based momentum rotation system developed by QuantumResearch. Unlike traditional relative strength tools that rely on static ratio comparisons (e.g., ETH/BTC), this script focuses on trend confirmation and momentum acceleration to dynamically rotate into the strongest trending asset across a customizable basket.
🔍 Key Highlights
✅ Trend-Validated Momentum Scoring:
Each asset is scored using trend following indicator. Only assets in a confirmed uptrend are eligible for rotation. No blind allocation into a pumping asset without trend validation.
🔄 Dynamic Asset Rotation:
The system selects the asset with the highest momentum among those currently in a bullish TPI state, switching only when a new asset becomes dominant.
💹 Backtestable Strategy:
Includes full equity curve tracking, swap count, and customizable fees. Automatically calculates:
Sharpe Ratio
Sortino Ratio
Omega Ratio
Max Drawdown
Net Profit vs HODL
📈 Momentum Visualization:
Each selected asset’s momentum score is displayed in a custom performance table, along with current trend signal (LONG or CASH) and overall strategy metrics.
⚙️ How It Works
Select up to 4 assets (e.g., BTC, ETH, SOL, SUI).
For each, the script computes:
Trend State via trend following indicator (1 = Bullish, -1 = Bearish)
Momentum Score to asses the winner
The strategy allocates 100% exposure to the asset with the highest momentum among those in an uptrend.
If no asset is trending, the strategy holds CASH.
📊 What Makes This Unique?
Most “relative strength” indicators compare the price ratio between two assets over time. This often leads to late rotations.
This tool is different:
It uses momentum and trend detection, not simple ratio analysis.
It’s designed to avoid false breakouts by requiring trend confirmation before rotating.
Ideal for rotational trading, momentum investing, and trend-following systems.
🧠 Best Use Cases
Rotational Crypto Strategies (BTC vs ETH vs SOL vs SUI)
Smart Trend Allocation with drawdown awareness
Backtest-ready edge validation vs HODL strategies
Low-frequency rebalancing with high signal quality
🛑 Disclaimer
This indicator is for educational purposes only. It does not constitute financial advice. Past performance does not guarantee future returns. Always use proper risk management.
