Multi Time Frame Trend, Volume and Momentum ProfileWHAT DOES THIS INDICATOR DO?
I created this indicator to address some of the significant inconveniences when analyzing a security, such as continually switching between different time frames to determine the trend and potential pullbacks, adding volume or volume-derived indicators, and finally, something that would help me determine the strength of the trend (maybe two additional indicators here). So I decided to code this all-in-one indicator that you can add multiple times to your chart depending on the settings you want to use, or just optimize the parameters for the particular asset and then switch between the options.
As the name suggests, it consists of three main sections - Trend , Volume , and Momentum . You have complete control over the parameters, including the Time Frames you want to use for each one (they can be different). So, let me explain each section in more detail.
HOW DOES THE INDICATOR WORK?
1. Trend Settings
In order to determine the trend, you need to set up two Moving Averages. You have a wide choice here - SMA, EMA, WMA, RMA, HMA, DEMA, TEMA, VWMA, and ALMA. Since the indicator does not plot the moving averages on the chart, I strongly suggest using this indicator along with the free "Trend Indicator for Directional Trading(main)" , which you can find in the Public Library. Once you set up the Trend Resolution, the Types of MAs, and their lengths, the indicator will generate a histogram of their convergences and divergences.
The change in colors should help you more easily determine the trend:
a) Bright Green - bull trend and price trending up (a good place to open long)
b) Dark Green - bull trend and price trending down (stay flat or open a long position with great caution)
c) Bright Red - bear trend and price trending down (a good place to open short)
d) Dark Red - bear trend and price trending up (stay flat or open a short position with great caution)
e) In addition, you can change the color palette to reflect the bull/bear trend momentum by scrolling to the bottom and selecting "Color Based on Bull/Bear Momentum", but I will discuss this in more detail below.
This part of the indicator is useful for opening a trade in the direction of the trend or for spotting a potential divergence. Both cases are illustrated below.
2. Volume Settings
The calculations for this part of the indicator are partially taken from "Multi Time Frame Effective Volume Profile" . I will quickly outline the specifics here, but if you want a more thorough understanding of how it works, please check the description of the MTF Effective Volume Profile indicator .
You have three elements with the following default settings - Resolution (5-min), Lookback (100), and Average (1). This means that the indicator will analyze the last one hundred 5-min bars and will plot a sum of only those that are at least 1 times bigger than the average. Those that are smaller than the average will be left out from the calculation. What you get is a trend line showing you accumulation/distribution based on modified volume parameters.
This part of the indicator is useful for spotting exhaustions and increased buying/selling volume that is opposite to the price trend. As you will see in the picture below, in frame 1 the selling pressure is decreasing, while buying volume is increasing. At one point supply dries out and the bulls take control, thus reverting the price. In frame 2, however, you can see that the higher high is not met with nearly as much buying volume as in the previous peak, showing that the bulls are exhausted and maybe a trend change will follow or at the very least that the bull trend will take a break.
3. Momentum Settings
The final part is an RSI smoothed through a Moving Average with the addition of some minor optimizations. Thus, the parameters you have to configure here aside from the resolution are the RSI length, the moving average that will be used, and its length. Out of the three, this is the most lagging component, but it's also the most accurate one. I must mention that due to the modified nature of this RSI, overbought and oversold levels carry less weight to the trading signals. Rather, pay attention to the change of colors, as they do so when the RSI changes direction based on preset parameters. The picture below shows such instances.
4. Additional Settings
This section consists of 4 elements:
a) Length of Trend - filters out the noise and gives a signal only when the trend becomes more established
b) ADX Threshold - filters out trading ranges and indecision zones when it's not recommended to open a trade
c) Select Analysis - choose what part of the indicator you want to see from a drop-down menu
d) Color Based on Bull/Bear Momentum - a global setting that will override the preset coloring of each indicator and will replace it with colors based on bull/bear strength and momentum - green for bulls, red for bears, and gray for non-trading zones.
The last part of this indicator is a combination of all of the above and is called a Points-Based System . It generates 3 rows of dots that go light green when bull criteria are met, orange when bear criteria are met, or gray when it's neither of the two. When you get a column of 3 green dots you get a buy signal. Similarly, a column of 3 orange dots gives you a sell signal. Grey zones are non-tradeable. It goes without saying that the frequency and quality of the signals you get will almost entirely depend on your settings, so feel free to experiment and adjust the indicator to catch the best moves for the given security.
In terms of indicator adjustments, I have left almost every part open to configuration. That is 15 parameters and 35 adjustable colors.
HOW MUCH DOES THE INDICATOR COST ?
As much as I would like to offer it for free (as some of my other ones), a great deal of work, trading logic, and testing have gone into creating this indicator. More than a few hundred iterations and a few dozen branches were required to reach the end result which is a precise combination of usefulness, simplicity, and practicality. Furthermore, this indicator will continue to be updated and user-requested features that improve its performance will be added.
Disclaimer: The purpose of all indicators is to indicate potential setups, which may lead to profitable results. No indicator is perfect and certainly, no indicator has a 100% success rate. They are subject to flaws, wrongful interpretation, bugs, etc. This indicator makes no exception. It must be used with a sound money management plan that puts the main emphasis on protecting your capital. Please, do not rely solely on any single indicator to make trading decisions instead of you. Indicators are storytellers, not fortune tellers. They help you see the bigger picture, not the future.
To find out more about how to gain access to this indicator, please use the provided information below or just message me. Thank you for your time.
"momentum" için komut dosyalarını ara

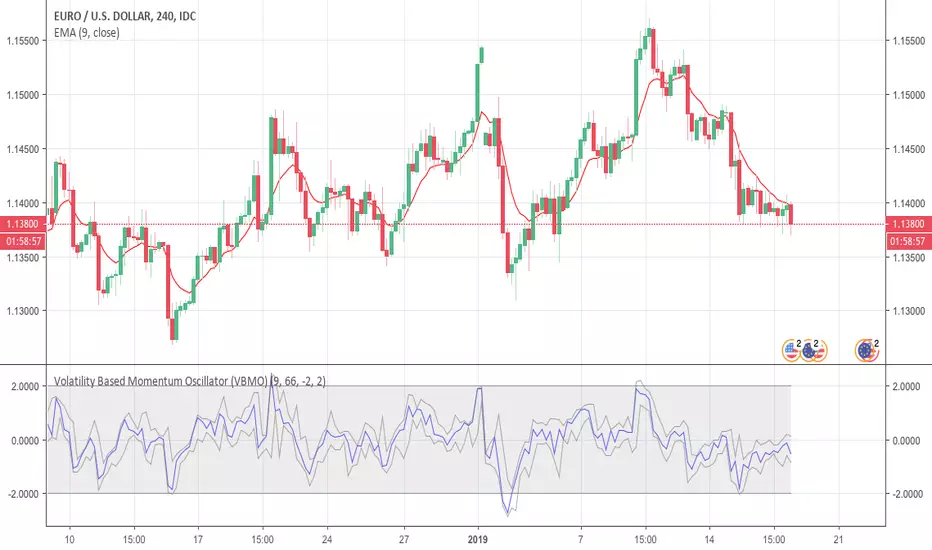
Volatility Based Momentum Oscillator (VBMO)There is a frequent and definitive pattern in price movement, whereby price will steadily drift lower, then accelerate before bottoming out. Similarly, price will often steadily rise, then accelerate into a climax top.
The Volatility Based Momentum Oscillator (VBMO) is designed to delineate between steady versus more accelerated and climactic price movements.
VBMO is calculated using a short-term moving average, the distance of price from this moving average, and the trading instrument’s historical volatility. Even though VBMO’s calculation is relatively simple, the resulting values can help traders identify, analyze and act upon many scenarios, such as climax tops, reversals, and capitulation. Moreover, since the units and scale for VBMO are always the same, the indicator can be used in a consistent manner across multiple timeframes and instruments.
For more details, there is an article further describing VBMO and its applicability.
Gaussian Kernel Smoothing MomentumOverview:
The Gaussian Kernel Smoothing Momentum indicator analyzes and quantifies market momentum by applying statistical techniques to price and returns data. This indicator uses Gaussian kernel smoothing to filter noise and provide a more accurate representation of momentum. Additionally, it includes a option to evaluate the absolute score of the momentum to determine if the beginning of a "trend" is likely or if you can expect a "trend" to come to an end.
Kernels and Their Role In Time Series Analysis:
In statistical analysis, a kernel is a weighting function used to estimate the properties of a dataset. Kernels are particularly useful in non-parametric methods, where they serve to smooth data or estimate probability density functions without assuming a specific underlying distribution. The Gaussian kernel, one of the most commonly used, is characterized by its smooth, bell-shaped curve which provides a natural way to give more weight to data points closer to the target value and less weight to those further away.
Uses of Kernels in Time Series Analysis
Kernels play a significant role in time series analysis, especially in the context of smoothing and filtering. With kernel functions, you can reduce noise and extract the underlying systematic component or signal from the data. This process is essential for identifying long-term patterns in the data, which is often obscured by short-term fluctuations and random noise.
Kernel Smoothing
Kernel smoothing is a technique that applies a kernel function to a set of data points to create a smooth curve, effectively reducing the impact of random variations. In time series analysis, kernel smoothing helps to filter out short-term noise while retaining significant trends and "patterns". The Gaussian kernel, with its emphasis on nearby points, is particularly effective for this purpose, as it smooths the data in a way that highlights the underlying structure without overfitting to random fluctuations.
Additionally, kernels are used in non-parametric volatility estimation, option pricing models, and for detecting anomalies in financial data. Their flexibility and ability to handle complex, non-linear relationships make them well-suited for the often noisy data encountered in financial markets.
Momentum Component
The momentum component of the indicator is designed to quantify the directional movement of asset prices by applying the Gaussian kernel smoothing to the expected return of the price data. The data then has the variance stabilized and normalizes the distribution of price changes to be able to more efficiently analyze the momentum.
The Gaussian kernel smoothing function serves to filter out high-frequency noise, isolating the underlying systematic component of the momentum. This is achieved by weighting the data points based on their proximity to the current observation, with closer data points exerting a stronger influence. The resulting smoothed momentum provides a clearer of the directional bias in the market, devoid of short-term volatility.
Absolute Move Component
The absolute move component is a extension of the momentum analysis, focusing on the magnitude rather than the direction of the price movements. This component captures the absolute score of the smoothed momentum series, providing a measure of strength or intensity of the price movement, independent from its direction. The absolute move component also incorporates a Kalman filter to further smooth and refine the signal. The Kalman filter dynamically adjusts based on the observed variance in the data, to reduce the impact of outliers.
What to make of this indicator
The smoothed momentum line helps determine whether the market is experiencing upward and downward momentum. If the momentum line is above zero and rising, this suggest a positive expected returns. Conversely, if the momentum line is below zero and falling, it indicates negative expected returns.
You should also pay attention to changes in the slope of the momentum line and the moving average of the smoothed momentum(weighted with an optimal sampling size algorithm). A flattening or reversal of the slope may signal a potential shift in market direction. For example, if the momentum line and moving average transitions from rising to falling, it means that the expected return is going from positive to negative so you can see the "trend" as weakening or forming a trend of negative expected returns.
The absolute move component is designed to measure the intensity or strength of the current market movement. A low absolute move value, especially when they are negative or at the lower end of their band, indicates that the momentum and expected return is close to zero, which suggest that the market is experiencing minimal directional movement, which can be a sign of consolidation. High absolute values signal that the market is undergoing a significant price movement. When the absolute move is high and/or rising, it indicates that the movement of the momentum is strong, regardless of whether it is bullish or bearish.
If the absolute move reaches unusually high levels, it could indicate that the market is experiencing an exceptional price move, which might be unsustainable. Traders can anticipate potential reversals or profit taking targets. However, you should avoid trying to trade reversals as exceptionally high values in a time series do not guarantee an immediate reversal. This high values often occur during periods of strong trends or significant events, which can continue longer than expected, and you cant time when it will return to its mean. The mean-reverting nature of some statistical models can suggest a return to the mean, but this assumption can be misleading in financial markets, where trends can persist despite overextending conditions.

Squeeze Momentum TD - A Revisited Version of the TTM SqueezeDescription:
The "Squeeze Momentum TD" is our unique take on the highly acclaimed TTM Squeeze indicator, renowned in the trading community for its efficiency in pinpointing market momentum. This script is a tribute and an extension to the foundational work laid by several pivotal figures in the trading industry:
• John Carter, for his creation of the TTM Squeeze and TTM Squeeze Pro, which revolutionized the way traders interpret volatility and momentum.
• Lazybear, whose original interpretation of the TTM Squeeze, known as the "Squeeze Momentum Indicator", provided an invaluable foundation for further development.
• Makit0, who evolved Lazybear's script to incorporate enhancements from the TTM Squeeze Pro, resulting in the "Squeeze PRO Arrows".
Our script, "Squeeze Momentum TD", represents a custom version developed after reviewing all variations of the TTM Squeeze indicator. This iteration focuses on a distinct visualization approach, featuring an overlay band on the chart for an user-friendly experience. We've distilled the essence of the TTM Squeeze and its advanced version, the TTM Squeeze Pro, into a form that emphasizes intuitive usability while retaining comprehensive analytical depth.
Features:
-Customizable Bollinger Bands and Keltner Channels: These core components of the TTM Squeeze.
-Dynamic Squeeze Conditions: Ranging from No Squeeze to High Compression.
-Momentum Oscillator: A linear regression-based momentum calculation, offering clear insights into market trends.
-User-Defined Color Schemes: Personalize your experience with adjustable colors for bands and plot shapes.
-Advanced Alert System: Alerts for key market shifts like Bull Watch Out, Bear Watch Out, and Momentum shifts.
-Adaptive Band Widths: Modify the band widths to suit your preference.
How to use it?
• Transition from Light Green to Dark Green: Indicates a potential end to the bullish momentum. This 'Bull Watch Out' signal suggests that traders should be cautious about continuing bullish trends.
• Transition from Light Red to Dark Red: Signals that the bearish momentum might be fading, triggering a 'Bear Watch Out' alert. It's a hint for traders to be wary of ongoing bearish trends.
• Shift from Dark Green to Light Green: This change suggests an increase in bullish momentum. It's an indicator for traders to consider bullish positions.
• Change from Dark Red to Light Red: Implies that bearish momentum is picking up. Traders might want to explore bearish strategies under this condition.
• Rapid Change from Light Red to Light Green: This swift shift indicates a quick transition from bearish to bullish sentiment. It's a strong signal for traders to consider switching to bullish positions.
• Quick Shift from Light Green to Light Red: Demonstrates a speedy change from bullish to bearish momentum. It suggests that traders might want to adjust their strategies to align with the emerging bearish trend.
Acknowledgements:
Special thanks to Beardy_Fred for the significant contributions to the development of this script. This work stands as a testament to the collaborative spirit of the trading community, continuously evolving to meet the demands of diverse trading strategies.
Disclaimer:
This script is provided for educational and informational purposes only. Users should conduct their own due diligence before making any trading decisions.

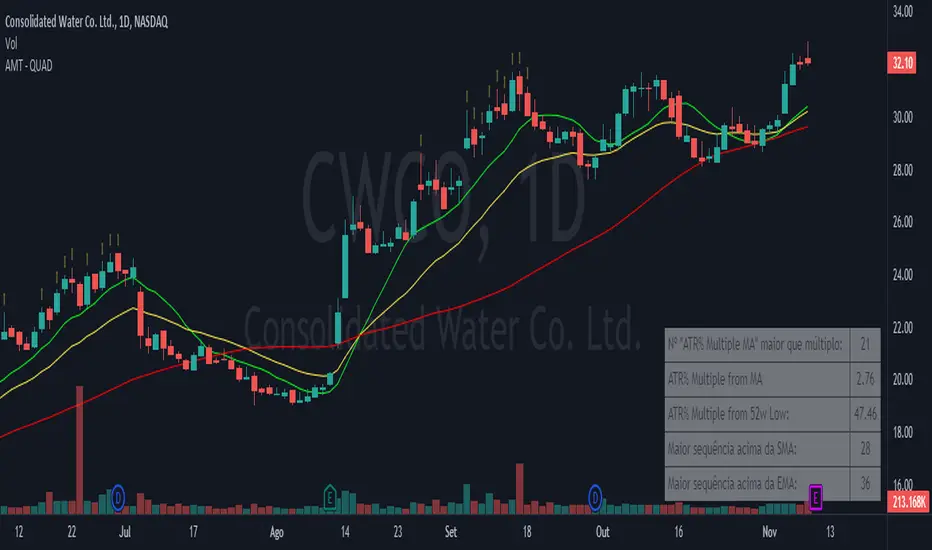
Alpha Momentum Trade - AMT (QUAD Financial)The "Alpha Momentum Trend" indicator was conceived by Tiago Friedrich and programmed by Conrado Villaça.
The indicator description applies to the daily chart. When used on other timeframes, the indicator also changes its signals based on the timeframe used.
It has five fields, from top to bottom:
1. "ATR Multiple MA" greater than multiple: shows how many candles the asset stayed 7 times the ATR (average true range) above the 50-period simple moving average (SMA) in the last 126 candles. The purpose is to identify the strength of the asset because the more times it stayed at this distance from the SMA 50, the greater the acceleration of its prices tends to be, indicating a high momentum asset. You can change the period of the SMA in the indicator settings.
2. ATR% Multiple from MA: shows the multiple of ATR that the asset is from the same SMA as in the upper field. The default is the SMA 50, and the indicator helps identify interesting regions to take profits from long positions. When the asset is more than 7 ATRs above the SMA 50, the asset is considered "stretched," and a correction or price consolidation becomes likely. For high beta assets with a very strong trend, you can use a multiple of 10 ATRs for this purpose.
3. ATR% Multiple from 52w Low: shows the multiple of ATR that the asset is in relation to the 52-week low price. The higher the number, the more the asset has risen relative to its volatility standards, indicating a stronger trend. For momentum traders, it's ideal for the asset to be at least 15 ATRs above the minimum for this period to ensure that it's in a strong uptrend and far from the lows.
4. Longest streak above SMA: within the last 126 candles, it shows the longest streak of days when the asset didn't close below a specific simple moving average. The default definition is with the 10-day SMA, but you can change it in the indicator settings. The more consecutive days the asset can stay above the SMA10, the sign that its trend is consistent and not very volatile, which is desirable. Ideally, an asset should have previously formed an uptrend by staying at least 20 consecutive days above the SMA10.
5. Longest streak above EMA: within the last 126 candles, it shows the longest streak of days when the asset didn't close below a specific exponential moving average. The default definition is with the 21-day EMA, but you can change it in the indicator settings. The more consecutive days the asset can stay above the EMA21, the sign that its trend is consistent and not very volatile, which is desirable. Ideally, an asset should have previously formed an uptrend by staying at least 35 consecutive days above the EMA21.
It's also possible to visualize on the chart the moving averages used for the calculation of the "ATR Multiple MA," "Longest streak above SMA," and "Longest streak above EMA". In the default configuration, this results in a simple 50-day moving average, a simple 10-day moving average, and an exponential 21-day moving average being displayed on the chart, respectively.
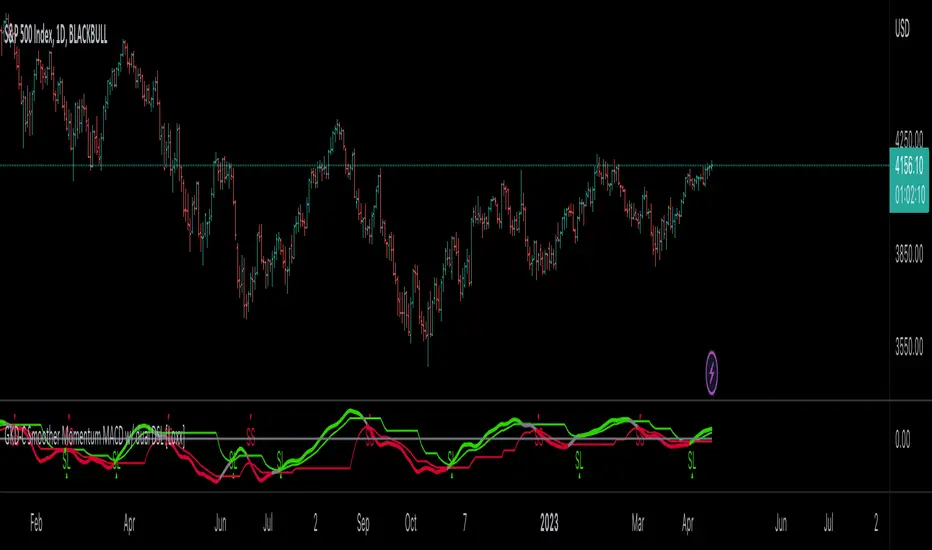
GKD-C Smoother Momentum MACD w/ dual DSL [Loxx]Giga Kaleidoscope GKD-C Smoother Momentum MACD w/ dual DSL is a Confirmation module included in Loxx's "Giga Kaleidoscope Modularized Trading System".
█ GKD-C Smoother Momentum MACD w/ dual DSL
What is Smoother Momentum?
Smoother Momentum is a technical indicator used to evaluate the momentum of financial assets over a specific period. It is a popular tool among traders and analysts as it helps filter out noise from the price data and provides a clearer understanding of the underlying trend. The code snippet provided is a function, smmom(), that calculates the Smoother Momentum using a combination of Exponential Moving Averages (EMAs). In the following, we will delve into the concept of Smoother Momentum, its formulation, and the rationale behind the calculations.
Smoother Momentum Formula:
The Smoother Momentum calculation involves three EMAs with different smoothing factors. The function smmom() takes two input parameters: src, which represents the source data (such as price), and per, which represents the period for smoothing.
smmom(float src, float per)=>
float alphareg = 2.0 / (1.0 + per)
float alphadbl = 2.0 / (1.0 + math.sqrt(per))
float ema = src
float ema21 = src
float ema22 = src
if bar_index > 0
ema := nz(ema ) + alphareg * (src - nz(ema ))
ema21 := nz(ema21 ) + alphadbl * (src - nz(ema21 ))
ema22 := nz(ema22 ) + alphadbl * (ema21 - nz(ema22 ))
float out = (ema22 - ema)
out
The smoothing factors for the three EMAs are as follows:
alphareg = 2.0 / (1.0 + per)
alphadbl = 2.0 / (1.0 + sqrt(per))
These factors determine the degree of smoothing applied to the input data. The alphareg factor provides regular smoothing, while the alphadbl factor introduces a double smoothing effect.
The three EMAs are calculated as follows:
ema = src
ema21 = src
ema22 = src
For each bar index greater than zero, the EMAs are updated using the following formulas:
ema := nz(ema ) + alphareg * (src - nz(ema ))
ema21 := nz(ema21 ) + alphadbl * (src - nz(ema21 ))
ema22 := nz(ema22 ) + alphadbl * (ema21 - nz(ema22 ))
The Smoother Momentum (out) is then calculated as the difference between ema22 and ema:
out = (ema22 - ema)
Rationale Behind Smoother Momentum:
The Smoother Momentum indicator is designed to provide a refined view of an asset's momentum by employing multiple levels of smoothing. By incorporating the regular EMA (ema) and the double smoothed EMAs (ema21 and ema22), the indicator minimizes the impact of price fluctuations, resulting in a smoother momentum line.
The use of different smoothing factors allows the indicator to capture both short-term and long-term price movements, making it a valuable tool for various trading strategies. The Smoother Momentum provides traders with a better understanding of the underlying trend and helps them identify potential entry and exit points.
Smoother Momentum is a powerful technical indicator that offers valuable insights into an asset's momentum by leveraging a combination of Exponential Moving Averages with different smoothing factors. The smmom() function is an efficient implementation of the Smoother Momentum indicator, providing traders and analysts with a clear and concise view of the asset's underlying trend. By incorporating this indicator into their trading strategies, market participants can make more informed decisions and improve their overall performance.
What is the Moving Average Convergence Divergence (MACD)?
The Moving Average Convergence Divergence (MACD) is a widely-used technical indicator that measures the relationship between two Exponential Moving Averages (EMAs) of an asset's price. Developed by Gerald Appel in the 1970s, the MACD is employed by traders and analysts to identify trend reversals, bullish or bearish momentum, and potential entry or exit points in the market. This following will provide an in-depth understanding of the MACD, its formulation, and the rationale behind its calculations.
MACD Formula:
The MACD is derived from two Exponential Moving Averages of different periods, usually 12 and 26. The MACD line is calculated as the difference between the short-term (12-period) EMA and the long-term (26-period) EMA. Alongside the MACD line, a signal line, typically a 9-period EMA of the MACD line, is calculated. The interaction between the MACD line and the signal line forms the basis for generating trading signals.
Here are the formulas for calculating the MACD components:
1. Short-term EMA (12-period): EMA_short = EMA(price, 12)
2. Long-term EMA (26-period): EMA_long = EMA(price, 26)
3. MACD Line: MACD = EMA_short - EMA_long
4. Signal Line (9-period EMA of MACD): Signal = EMA(MACD, 9)
5. Additionally, the MACD Histogram represents the difference between the MACD line and the signal line, visualizing the degree of separation between the two lines.
MACD Histogram: Histogram = MACD - Signal
Rationale Behind MACD:
The MACD indicator is based on the principle that moving averages can provide insights into an asset's trend and momentum. By calculating the difference between two EMAs of different periods, the MACD line oscillates around the zero line, capturing the underlying trend and momentum of the asset. When the short-term EMA is above the long-term EMA, the MACD line is positive, indicating bullish momentum. Conversely, when the short-term EMA is below the long-term EMA, the MACD line is negative, signifying bearish momentum.
The signal line, a 9-period EMA of the MACD line, serves as a smoothing factor and a trigger for trading signals. When the MACD line crosses above the signal line, it generates a bullish signal, suggesting a potential buying opportunity. On the other hand, when the MACD line crosses below the signal line, it produces a bearish signal, indicating a possible selling opportunity.
The MACD Histogram visualizes the divergence between the MACD line and the signal line, helping traders assess the strength of the trend and the momentum. A widening histogram signifies an increasing divergence between the two lines, indicating stronger momentum, while a narrowing histogram denotes decreasing divergence, suggesting weakening momentum.
The Moving Average Convergence Divergence (MACD) is a powerful and versatile technical indicator that offers valuable insights into an asset's trend and momentum. By examining the interactions between the MACD line, the signal line, and the MACD Histogram, traders can identify potential trend reversals, bullish or bearish momentum, and entry or exit points in the market. The MACD's effectiveness in various market conditions and its compatibility with different trading strategies make it an indispensable tool for market participants seeking to make well-informed decisions and enhance their overall performance.
What is a Discontinued Signal Line (DSL)?
Many indicators employ signal lines to more easily identify trends or desired states of the indicator. The concept of a signal line is straightforward: by comparing a value to its smoothed, slightly lagging state, one can determine the current momentum or state.
The Discontinued Signal Line builds on this fundamental idea by extending it: rather than having a single signal line, multiple lines are used based on the indicator's current value.
The "signal" line is calculated as follows:
When a specific level is crossed in the desired direction, the EMA of that value is calculated for the intended signal line.
When that level is crossed in the opposite direction, the previous "signal" line value is "inherited," becoming a sort of level.
This approach combines signal lines and levels, aiming to integrate the advantages of both methods.
In essence, DSL enhances the signal line concept by inheriting the previous signal line's value and converting it into a level.
You can select between anchored and unanchored DSL, as well as utilize zero-line crosses without DSL.
What is the Smoother Momentum MACD w/ dual DSL?
This indicator uses the Smoother Momentum algorithm to calculate a MACD. Signals are created by middle crosses, signal crosses, or DSL crosses.
█ Giga Kaleidoscope Modularized Trading System
Core components of an NNFX algorithmic trading strategy
The NNFX algorithm is built on the principles of trend, momentum, and volatility. There are six core components in the NNFX trading algorithm:
1. Volatility - price volatility; e.g., Average True Range, True Range Double, Close-to-Close, etc.
2. Baseline - a moving average to identify price trend
3. Confirmation 1 - a technical indicator used to identify trends
4. Confirmation 2 - a technical indicator used to identify trends
5. Continuation - a technical indicator used to identify trends
6. Volatility/Volume - a technical indicator used to identify volatility/volume breakouts/breakdown
7. Exit - a technical indicator used to determine when a trend is exhausted
What is Volatility in the NNFX trading system?
In the NNFX (No Nonsense Forex) trading system, ATR (Average True Range) is typically used to measure the volatility of an asset. It is used as a part of the system to help determine the appropriate stop loss and take profit levels for a trade. ATR is calculated by taking the average of the true range values over a specified period.
True range is calculated as the maximum of the following values:
-Current high minus the current low
-Absolute value of the current high minus the previous close
-Absolute value of the current low minus the previous close
ATR is a dynamic indicator that changes with changes in volatility. As volatility increases, the value of ATR increases, and as volatility decreases, the value of ATR decreases. By using ATR in NNFX system, traders can adjust their stop loss and take profit levels according to the volatility of the asset being traded. This helps to ensure that the trade is given enough room to move, while also minimizing potential losses.
Other types of volatility include True Range Double (TRD), Close-to-Close, and Garman-Klass
What is a Baseline indicator?
The baseline is essentially a moving average, and is used to determine the overall direction of the market.
The baseline in the NNFX system is used to filter out trades that are not in line with the long-term trend of the market. The baseline is plotted on the chart along with other indicators, such as the Moving Average (MA), the Relative Strength Index (RSI), and the Average True Range (ATR).
Trades are only taken when the price is in the same direction as the baseline. For example, if the baseline is sloping upwards, only long trades are taken, and if the baseline is sloping downwards, only short trades are taken. This approach helps to ensure that trades are in line with the overall trend of the market, and reduces the risk of entering trades that are likely to fail.
By using a baseline in the NNFX system, traders can have a clear reference point for determining the overall trend of the market, and can make more informed trading decisions. The baseline helps to filter out noise and false signals, and ensures that trades are taken in the direction of the long-term trend.
What is a Confirmation indicator?
Confirmation indicators are technical indicators that are used to confirm the signals generated by primary indicators. Primary indicators are the core indicators used in the NNFX system, such as the Average True Range (ATR), the Moving Average (MA), and the Relative Strength Index (RSI).
The purpose of the confirmation indicators is to reduce false signals and improve the accuracy of the trading system. They are designed to confirm the signals generated by the primary indicators by providing additional information about the strength and direction of the trend.
Some examples of confirmation indicators that may be used in the NNFX system include the Bollinger Bands, the MACD (Moving Average Convergence Divergence), and the MACD Oscillator. These indicators can provide information about the volatility, momentum, and trend strength of the market, and can be used to confirm the signals generated by the primary indicators.
In the NNFX system, confirmation indicators are used in combination with primary indicators and other filters to create a trading system that is robust and reliable. By using multiple indicators to confirm trading signals, the system aims to reduce the risk of false signals and improve the overall profitability of the trades.
What is a Continuation indicator?
In the NNFX (No Nonsense Forex) trading system, a continuation indicator is a technical indicator that is used to confirm a current trend and predict that the trend is likely to continue in the same direction. A continuation indicator is typically used in conjunction with other indicators in the system, such as a baseline indicator, to provide a comprehensive trading strategy.
What is a Volatility/Volume indicator?
Volume indicators, such as the On Balance Volume (OBV), the Chaikin Money Flow (CMF), or the Volume Price Trend (VPT), are used to measure the amount of buying and selling activity in a market. They are based on the trading volume of the market, and can provide information about the strength of the trend. In the NNFX system, volume indicators are used to confirm trading signals generated by the Moving Average and the Relative Strength Index. Volatility indicators include Average Direction Index, Waddah Attar, and Volatility Ratio. In the NNFX trading system, volatility is a proxy for volume and vice versa.
By using volume indicators as confirmation tools, the NNFX trading system aims to reduce the risk of false signals and improve the overall profitability of trades. These indicators can provide additional information about the market that is not captured by the primary indicators, and can help traders to make more informed trading decisions. In addition, volume indicators can be used to identify potential changes in market trends and to confirm the strength of price movements.
What is an Exit indicator?
The exit indicator is used in conjunction with other indicators in the system, such as the Moving Average (MA), the Relative Strength Index (RSI), and the Average True Range (ATR), to provide a comprehensive trading strategy.
The exit indicator in the NNFX system can be any technical indicator that is deemed effective at identifying optimal exit points. Examples of exit indicators that are commonly used include the Parabolic SAR, the Average Directional Index (ADX), and the Chandelier Exit.
The purpose of the exit indicator is to identify when a trend is likely to reverse or when the market conditions have changed, signaling the need to exit a trade. By using an exit indicator, traders can manage their risk and prevent significant losses.
In the NNFX system, the exit indicator is used in conjunction with a stop loss and a take profit order to maximize profits and minimize losses. The stop loss order is used to limit the amount of loss that can be incurred if the trade goes against the trader, while the take profit order is used to lock in profits when the trade is moving in the trader's favor.
Overall, the use of an exit indicator in the NNFX trading system is an important component of a comprehensive trading strategy. It allows traders to manage their risk effectively and improve the profitability of their trades by exiting at the right time.
How does Loxx's GKD (Giga Kaleidoscope Modularized Trading System) implement the NNFX algorithm outlined above?
Loxx's GKD v1.0 system has five types of modules (indicators/strategies). These modules are:
1. GKD-BT - Backtesting module (Volatility, Number 1 in the NNFX algorithm)
2. GKD-B - Baseline module (Baseline and Volatility/Volume, Numbers 1 and 2 in the NNFX algorithm)
3. GKD-C - Confirmation 1/2 and Continuation module (Confirmation 1/2 and Continuation, Numbers 3, 4, and 5 in the NNFX algorithm)
4. GKD-V - Volatility/Volume module (Confirmation 1/2, Number 6 in the NNFX algorithm)
5. GKD-E - Exit module (Exit, Number 7 in the NNFX algorithm)
(additional module types will added in future releases)
Each module interacts with every module by passing data between modules. Data is passed between each module as described below:
GKD-B => GKD-V => GKD-C(1) => GKD-C(2) => GKD-C(Continuation) => GKD-E => GKD-BT
That is, the Baseline indicator passes its data to Volatility/Volume. The Volatility/Volume indicator passes its values to the Confirmation 1 indicator. The Confirmation 1 indicator passes its values to the Confirmation 2 indicator. The Confirmation 2 indicator passes its values to the Continuation indicator. The Continuation indicator passes its values to the Exit indicator, and finally, the Exit indicator passes its values to the Backtest strategy.
This chaining of indicators requires that each module conform to Loxx's GKD protocol, therefore allowing for the testing of every possible combination of technical indicators that make up the six components of the NNFX algorithm.
What does the application of the GKD trading system look like?
Example trading system:
Backtest: Strategy with 1-3 take profits, trailing stop loss, multiple types of PnL volatility, and 2 backtesting styles
Baseline: Hull Moving Average
Volatility/Volume: Hurst Exponent
Confirmation 1: Smoother Momentum MACD w/ dual DSL as shown on the chart above
Confirmation 2: Williams Percent Range
Continuation: Fisher Transform
Exit: Rex Oscillator
Each GKD indicator is denoted with a module identifier of either: GKD-BT, GKD-B, GKD-C, GKD-V, or GKD-E. This allows traders to understand to which module each indicator belongs and where each indicator fits into the GKD protocol chain.
Giga Kaleidoscope Modularized Trading System Signals (based on the NNFX algorithm)
Standard Entry
1. GKD-C Confirmation 1 Signal
2. GKD-B Baseline agrees
3. Price is within a range of 0.2x Volatility and 1.0x Volatility of the Goldie Locks Mean
4. GKD-C Confirmation 2 agrees
5. GKD-V Volatility/Volume agrees
Baseline Entry
1. GKD-B Baseline signal
2. GKD-C Confirmation 1 agrees
3. Price is within a range of 0.2x Volatility and 1.0x Volatility of the Goldie Locks Mean
4. GKD-C Confirmation 2 agrees
5. GKD-V Volatility/Volume agrees
6. GKD-C Confirmation 1 signal was less than 7 candles prior
Volatility/Volume Entry
1. GKD-V Volatility/Volume signal
2. GKD-C Confirmation 1 agrees
3. Price is within a range of 0.2x Volatility and 1.0x Volatility of the Goldie Locks Mean
4. GKD-C Confirmation 2 agrees
5. GKD-B Baseline agrees
6. GKD-C Confirmation 1 signal was less than 7 candles prior
Continuation Entry
1. Standard Entry, Baseline Entry, or Pullback; entry triggered previously
2. GKD-B Baseline hasn't crossed since entry signal trigger
3. GKD-C Confirmation Continuation Indicator signals
4. GKD-C Confirmation 1 agrees
5. GKD-B Baseline agrees
6. GKD-C Confirmation 2 agrees
1-Candle Rule Standard Entry
1. GKD-C Confirmation 1 signal
2. GKD-B Baseline agrees
3. Price is within a range of 0.2x Volatility and 1.0x Volatility of the Goldie Locks Mean
Next Candle:
1. Price retraced (Long: close < close or Short: close > close )
2. GKD-B Baseline agrees
3. GKD-C Confirmation 1 agrees
4. GKD-C Confirmation 2 agrees
5. GKD-V Volatility/Volume agrees
1-Candle Rule Baseline Entry
1. GKD-B Baseline signal
2. GKD-C Confirmation 1 agrees
3. Price is within a range of 0.2x Volatility and 1.0x Volatility of the Goldie Locks Mean
4. GKD-C Confirmation 1 signal was less than 7 candles prior
Next Candle:
1. Price retraced (Long: close < close or Short: close > close )
2. GKD-B Baseline agrees
3. GKD-C Confirmation 1 agrees
4. GKD-C Confirmation 2 agrees
5. GKD-V Volatility/Volume Agrees
1-Candle Rule Volatility/Volume Entry
1. GKD-V Volatility/Volume signal
2. GKD-C Confirmation 1 agrees
3. Price is within a range of 0.2x Volatility and 1.0x Volatility of the Goldie Locks Mean
4. GKD-C Confirmation 1 signal was less than 7 candles prior
Next Candle:
1. Price retraced (Long: close < close or Short: close > close)
2. GKD-B Volatility/Volume agrees
3. GKD-C Confirmation 1 agrees
4. GKD-C Confirmation 2 agrees
5. GKD-B Baseline agrees
PullBack Entry
1. GKD-B Baseline signal
2. GKD-C Confirmation 1 agrees
3. Price is beyond 1.0x Volatility of Baseline
Next Candle:
1. Price is within a range of 0.2x Volatility and 1.0x Volatility of the Goldie Locks Mean
2. GKD-C Confirmation 1 agrees
3. GKD-C Confirmation 2 agrees
4. GKD-V Volatility/Volume Agrees
]█ Setting up the GKD
The GKD system involves chaining indicators together. These are the steps to set this up.
Use a GKD-C indicator alone on a chart
1. Inside the GKD-C indicator, change the "Confirmation Type" setting to "Solo Confirmation Simple"
Use a GKD-V indicator alone on a chart
**nothing, it's already useable on the chart without any settings changes
Use a GKD-B indicator alone on a chart
**nothing, it's already useable on the chart without any settings changes
Baseline (Baseline, Backtest)
1. Import the GKD-B Baseline into the GKD-BT Backtest: "Input into Volatility/Volume or Backtest (Baseline testing)"
2. Inside the GKD-BT Backtest, change the setting "Backtest Special" to "Baseline"
Volatility/Volume (Volatility/Volume, Backte st)
1. Inside the GKD-V indicator, change the "Testing Type" setting to "Solo"
2. Inside the GKD-V indicator, change the "Signal Type" setting to "Crossing" (neither traditional nor both can be backtested)
3. Import the GKD-V indicator into the GKD-BT Backtest: "Input into C1 or Backtest"
4. Inside the GKD-BT Backtest, change the setting "Backtest Special" to "Volatility/Volume"
5. Inside the GKD-BT Backtest, a) change the setting "Backtest Type" to "Trading" if using a directional GKD-V indicator; or, b) change the setting "Backtest Type" to "Full" if using a directional or non-directional GKD-V indicator (non-directional GKD-V can only test Longs and Shorts separately)
6. If "Backtest Type" is set to "Full": Inside the GKD-BT Backtest, change the setting "Backtest Side" to "Long" or "Short
7. If "Backtest Type" is set to "Full": To allow the system to open multiple orders at one time so you test all Longs or Shorts, open the GKD-BT Backtest, click the tab "Properties" and then insert a value of something like 10 orders into the "Pyramiding" settings. This will allow 10 orders to be opened at one time which should be enough to catch all possible Longs or Shorts.
Solo Confirmation Simple (Confirmation, Backtest)
1. Inside the GKD-C indicator, change the "Confirmation Type" setting to "Solo Confirmation Simple"
1. Import the GKD-C indicator into the GKD-BT Backtest: "Input into Backtest"
2. Inside the GKD-BT Backtest, change the setting "Backtest Special" to "Solo Confirmation Simple"
Solo Confirmation Complex without Exits (Baseline, Volatility/Volume, Confirmation, Backtest)
1. Inside the GKD-V indicator, change the "Testing Type" setting to "Chained"
2. Import the GKD-B Baseline into the GKD-V indicator: "Input into Volatility/Volume or Backtest (Baseline testing)"
3. Inside the GKD-C indicator, change the "Confirmation Type" setting to "Solo Confirmation Complex"
4. Import the GKD-V indicator into the GKD-C indicator: "Input into C1 or Backtest"
5. Inside the GKD-BT Backtest, change the setting "Backtest Special" to "GKD Full wo/ Exits"
6. Import the GKD-C into the GKD-BT Backtest: "Input into Exit or Backtest"
Solo Confirmation Complex with Exits (Baseline, Volatility/Volume, Confirmation, Exit, Backtest)
1. Inside the GKD-V indicator, change the "Testing Type" setting to "Chained"
2. Import the GKD-B Baseline into the GKD-V indicator: "Input into Volatility/Volume or Backtest (Baseline testing)"
3. Inside the GKD-C indicator, change the "Confirmation Type" setting to "Solo Confirmation Complex"
4. Import the GKD-V indicator into the GKD-C indicator: "Input into C1 or Backtest"
5. Import the GKD-C indicator into the GKD-E indicator: "Input into Exit"
6. Inside the GKD-BT Backtest, change the setting "Backtest Special" to "GKD Full w/ Exits"
7. Import the GKD-E into the GKD-BT Backtest: "Input into Backtest"
Full GKD without Exits (Baseline, Volatility/Volume, Confirmation 1, Confirmation 2, Continuation, Backtest)
1. Inside the GKD-V indicator, change the "Testing Type" setting to "Chained"
2. Import the GKD-B Baseline into the GKD-V indicator: "Input into Volatility/Volume or Backtest (Baseline testing)"
3. Inside the GKD-C 1 indicator, change the "Confirmation Type" setting to "Confirmation 1"
4. Import the GKD-V indicator into the GKD-C 1 indicator: "Input into C1 or Backtest"
5. Inside the GKD-C 2 indicator, change the "Confirmation Type" setting to "Confirmation 2"
6. Import the GKD-C 1 indicator into the GKD-C 2 indicator: "Input into C2"
7. Inside the GKD-C Continuation indicator, change the "Confirmation Type" setting to "Continuation"
8. Inside the GKD-BT Backtest, change the setting "Backtest Special" to "GKD Full wo/ Exits"
9. Import the GKD-E into the GKD-BT Backtest: "Input into Exit or Backtest"
Full GKD with Exits (Baseline, Volatility/Volume, Confirmation 1, Confirmation 2, Continuation, Exit, Backtest)
1. Inside the GKD-V indicator, change the "Testing Type" setting to "Chained"
2. Import the GKD-B Baseline into the GKD-V indicator: "Input into Volatility/Volume or Backtest (Baseline testing)"
3. Inside the GKD-C 1 indicator, change the "Confirmation Type" setting to "Confirmation 1"
4. Import the GKD-V indicator into the GKD-C 1 indicator: "Input into C1 or Backtest"
5. Inside the GKD-C 2 indicator, change the "Confirmation Type" setting to "Confirmation 2"
6. Import the GKD-C 1 indicator into the GKD-C 2 indicator: "Input into C2"
7. Inside the GKD-C Continuation indicator, change the "Confirmation Type" setting to "Continuation"
8. Import the GKD-C Continuation indicator into the GKD-E indicator: "Input into Exit"
9. Inside the GKD-BT Backtest, change the setting "Backtest Special" to "GKD Full w/ Exits"
10. Import the GKD-E into the GKD-BT Backtest: "Input into Backtest"
Baseline + Volatility/Volume (Baseline, Volatility/Volume, Backtest)
1. Inside the GKD-V indicator, change the "Testing Type" setting to "Baseline + Volatility/Volume"
2. Inside the GKD-V indicator, make sure the "Signal Type" setting is set to "Traditional"
3. Import the GKD-B Baseline into the GKD-V indicator: "Input into Volatility/Volume or Backtest (Baseline testing)"
4. Inside the GKD-BT Backtest, change the setting "Backtest Special" to "Baseline + Volatility/Volume"
5. Import the GKD-V into the GKD-BT Backtest: "Input into C1 or Backtest"
6. Inside the GKD-BT Backtest, change the setting "Backtest Type" to "Full". For this backtest, you must test Longs and Shorts separately
7. To allow the system to open multiple orders at one time so you can test all Longs or Shorts, open the GKD-BT Backtest, click the tab "Properties" and then insert a value of something like 10 orders into the "Pyramiding" settings. This will allow 10 orders to be opened at one time which should be enough to catch all possible Longs or Shorts.
Requirements
Inputs
Confirmation 1: GKD-V Volatility / Volume indicator
Confirmation 2: GKD-C Confirmation indicator
Continuation: GKD-C Confirmation indicator
Solo Confirmation Simple: GKD-B Baseline
Solo Confirmation Complex: GKD-V Volatility / Volume indicator
Solo Confirmation Super Complex: GKD-V Volatility / Volume indicator
Stacked 1: None
Stacked 2+: GKD-C, GKD-V, or GKD-B Stacked 1
Outputs
Confirmation 1: GKD-C Confirmation 2 indicator
Confirmation 2: GKD-C Continuation indicator
Continuation: GKD-E Exit indicator
Solo Confirmation Simple: GKD-BT Backtest
Solo Confirmation Complex: GKD-BT Backtest or GKD-E Exit indicator
Solo Confirmation Super Complex: GKD-C Continuation indicator
Stacked 1: GKD-C, GKD-V, or GKD-B Stacked 2+
Stacked 2+: GKD-C, GKD-V, or GKD-B Stacked 2+ or GKD-BT Backtest
Additional features will be added in future releases.
Uptrick: Momentum Channel Indicator
### 🌟 **Uptrick: Momentum Channel Indicator (MC_Ind)** 🌟
The **"Uptrick: Momentum Channel Indicator"** is a powerful tool designed to help traders gauge market momentum and identify potential overbought or oversold conditions. Whether you're a day trader, swing trader, or long-term investor, this indicator can be your compass 🧭 in the complex world of trading.
### 🎯 **Purpose of the Indicator**
The primary goal of the **Momentum Channel Indicator** is to measure the deviation of price from its moving average (the mid-point) and to smooth this deviation to identify momentum shifts. By plotting overbought and oversold levels, the indicator helps traders spot potential reversal points where the market might change direction, offering valuable entry or exit signals.
### 🔧 **Inputs & Parameters**
Let's break down the input parameters that you can adjust to tailor the indicator to your trading style:
1. **`length1` (Channel Length) 📏**: This is the period over which the moving average (mid-point) and price deviation are calculated. The default value is 14, meaning the last 14 bars are considered for calculations.
2. **`length2` (Smoothing Length) 🧘**: This parameter controls the smoothing of the channel index, with a default value of 28. The higher the value, the smoother the momentum line, reducing noise and making trends more visible.
3. **`overbought1` & `overbought2` (Overbought Levels) 🔴**: These levels, set at 70 and 65 by default, represent the threshold above which the market is considered overbought, potentially signaling a selling opportunity.
4. **`oversold1` & `oversold2` (Oversold Levels) 🟢**: Similarly, these levels, set at -70 and -65, mark the threshold below which the market is considered oversold, indicating a potential buying opportunity.
### 🛠️ **How the Indicator Works**
Now, let's dive into the mechanics of the Momentum Channel Indicator:
1. **Mid-Point Calculation 🏁**: The mid-point is calculated using a simple moving average (SMA) of the closing prices over the `length1` period. This mid-point acts as a reference line from which deviations are measured.
2. **Price Deviation 📊**: The price deviation is the absolute difference between the closing price and the mid-point, smoothed over the same period (`length1`). This represents the typical price movement away from the mid-point.
3. **Channel Index 📉**: The channel index is calculated by dividing the price deviation by a fraction (0.01) of the mid-point, providing a normalized measure of how far the price has deviated from the average.
4. **Smoothing of the Channel Index 🌊**: The smoothed index (`mci1`) is calculated by applying a smoothing filter (SMA) over the channel index using the `length2` parameter. This helps reduce noise and highlight the true momentum of the market.
5. **Momentum Lines 📈**:
- **`mci1`**: The main momentum line, representing the smoothed channel index.
- **`mci2`**: A secondary momentum line, which is a further smoothed version of `mci1` using a 6-period SMA.
6. **Signal Lines 🚦**:
- **Overbought & Oversold Levels**: Horizontal lines plotted at `overbought1`, `overbought2`, `oversold1`, and `oversold2` levels serve as visual cues for overbought and oversold conditions.
- **Zero Line**: A central reference line at 0, indicating neutral momentum.
### 📈 **How to Use the Indicator**
#### 1. **Day Traders ⚡**
For day traders, the Momentum Channel Indicator can be a quick signal generator for short-term trades. Here's how you can use it:
- **Identify Entry Points 🎯**: Look for a **bullish crossover** when `mci1` crosses above `mci2` from below the `oversold1` level. This signals a potential upward reversal.
- **Spot Exit Points 🏁**: Watch for a **bearish crossunder** when `mci1` crosses below `mci2` from above the `overbought1` level. This could indicate a downward reversal.
- **Scalping 🔄**: In a fast-moving market, use the indicator to scalp by entering and exiting trades at these crossover points, with a tight stop-loss strategy.
#### 2. **Swing Traders 🎢**
Swing traders benefit from using the Momentum Channel Indicator to identify potential reversal points over a longer period:
- **Trend Confirmation 📊**: Use the smoothing effect of `mci2` to confirm trends. If `mci2` remains consistently above 0, it indicates a strong bullish trend, and vice versa.
- **Overbought/Oversold Reversals 🚀**: Enter trades when the price approaches the overbought or oversold levels (`overbought1`, `oversold1`). Combine this with other indicators, such as RSI, for more reliable signals.
- **Hold Positions 🧗**: Let the momentum lines guide your hold strategy. If the momentum lines stay aligned (both `mci1` and `mci2` are moving in the same direction), consider holding the position until a crossover or reversal signal appears.
#### 3. **Long-Term Investors 🏦**
For long-term investors, the Momentum Channel Indicator helps in fine-tuning entry and exit points based on broader market momentum:
- **Divergence Analysis 📐**: Look for divergence between the price and the momentum lines. If the price makes new highs but the momentum lines do not, it could signal a weakening trend and a potential reversal.
- **Strategic Entry/Exit 🏹**: Use the `overbought2` and `oversold2` levels to strategically enter or exit positions. These secondary levels provide an early warning before the market reaches extreme conditions.
- **Risk Management 🛡️**: The indicator can also be used as part of a risk management strategy by identifying when to reduce exposure in overbought markets or increase exposure in oversold markets.
### 🖼️ **Visualization & Interpretation**
The Momentum Channel Indicator is visually intuitive, with each component providing key insights:
1. **Momentum Lines (MCI1 & MCI2) 📈**:
- **Blue Line (`mci1`)**: Represents the main momentum line, providing immediate insights into market direction.
- **Orange Line (`mci2`)**: A secondary momentum line, further smoothed to confirm trends.
2. **Overbought/Oversold Levels 🔴🟢**:
- **Solid & Dashed Lines**: These lines highlight overbought and oversold regions, guiding traders on when to consider entering or exiting trades.
3. **MCI Difference (Purple Area) 🌌**:
- **Shaded Area**: The difference between `mci1` and `mci2`, shaded in purple, helps visualize the strength of the momentum. The larger the shaded area, the stronger the momentum.
### 🚀 **Advanced Tips & Tricks**
For those looking to maximize the potential of the Momentum Channel Indicator, here are some advanced strategies:
1. **Combine with Volume Indicators 📊**: Use volume indicators like OBV (On-Balance Volume) or Volume Oscillator to confirm momentum signals. For instance, a bullish crossover combined with increasing volume can reinforce a buy signal.
2. **Multiple Timeframe Analysis 🕒**: Apply the Momentum Channel Indicator across multiple timeframes (e.g., daily and weekly) to get a more comprehensive view of the market. This can help in aligning short-term trades with long-term trends.
3. **Adjusting Parameters 🔄**: Depending on market conditions, tweak the `length1` and `length2` parameters. In a highly volatile market, shorter lengths might provide quicker signals, whereas in a stable market, longer lengths could smooth out noise.
4. **Divergence & Convergence 📐**: Watch for divergence between price and momentum lines as a leading indicator of potential reversals. Convergence (when the price and momentum move in sync) can confirm the strength of the trend.
### **Conclusion**
The **Uptrick: Momentum Channel Indicator** is a versatile tool that can be customized for various trading styles and market conditions. Whether you're trading in fast-paced environments or analyzing long-term trends, this indicator offers a clear and intuitive way to gauge market momentum, identify potential reversals, and make informed trading decisions.
By understanding and applying the principles outlined above, you can harness the full power of this indicator, transforming your trading strategy from good to great! 🌟

Filtered Momentum Indicator (FMI)The Filtered Momentum Indicator (FMI) is a tool created to assist traders in identifying changes in momentum and gaining insights into potential shifts in price trends. By combining the concepts of momentum and Bollinger Bands, the FMI offers a unique perspective on momentum values and their relationship to price movements, helping traders make informed trading decisions. The FMI is calculated using two main components:
-- Momentum Calculation : Momentum measures the strength and velocity of price changes. It is calculated by comparing the current price to the price 14 (default) periods ago and expressing it as a percentage.
-- Bollinger Bands Calculation : Bollinger Bands are based on the momentum values and provide a range within which the momentum is expected to fluctuate. The upper and lower bands are determined using a specified period (default of 20) and deviations (default of 2.0).
The FMI consists of two lines : F+ (Filtered Plus) and F- (Filtered Minus). These lines help gauge the strength of bullish and bearish momentum:
-- F+ represents the difference between the upper Bollinger Band and the momentum values. It indicates the strength of bullish momentum. F+ is colored aqua.
-- F- represents the difference between the momentum values and the lower Bollinger Band. It indicates the strength of bearish momentum. F- is colored yellow.
When analyzing the FMI, pay attention to the relationship between F+ and F-:
-- If F- is greater than F+ , it suggests potential bullish momentum, indicating that prices may have room to rise.
-- If F+ is greater than F- , it suggests potential bearish momentum, indicating that prices may have room to decline.
Coloration of the FMI enhances its interpretability - when F- is greater than F+, the indicator color is set to lime (green), signaling potential bullish momentum; when F+ is greater than F-, the indicator color is set to fuchsia (purple), signaling potential bearish momentum.
The FMI can be applied in various ways for trading strategies:
-- Identifying Potential Reversals : Watch for crossovers between the F- and F+ lines, as they may indicate a potential shift in momentum and offer opportunities to enter or exit trades.
-- Confirmation Tool : Combine the FMI with other technical indicators or price patterns to validate potential trend reversals or continuations. By aligning signals from different indicators, you can strengthen your trading decisions.
-- Trade Timing : Consider taking trades in the direction of the dominant FMI color. When the indicator shows strong bullish momentum (F- > F+), consider going long. Conversely, when it shows strong bearish momentum (F+ > F-), consider going short.
It is essential to be aware of the limitations of the FMI:
-- False Signals : The FMI, like any indicator, may generate false signals, especially during low volatility or choppy market conditions. Always use the FMI in conjunction with other analysis techniques for confirmation.
-- Lagging Nature : The FMI relies on historical price data, causing it to lag behind sudden market moves. Keep in mind that the FMI provides insights based on past momentum and may not capture immediate changes in market conditions.
By combining momentum and Bollinger Bands, this indicator provides a unique perspective for making informed trading decisions. Utilize the FMI in conjunction with other analysis techniques, considering its limitations, to enhance your trading strategy and improve decision-making.

Matrix Momentum Expansion [IkkeOmar]The indicator consists of several features:
Candlestick chart: The indicator plots a candlestick chart based on the input parameters of the user. The candlesticks are colored blue or orange depending on whether the closing price is above or below the upper and lower bands.
Support and Resistance levels: The indicator also plots support and resistance levels based on the CCI (Commodity Channel Index) of the asset's price. These levels are dynamic and change based on the user's input parameters.
Momentum: The indicator calculates the momentum of the market based on the smoothed and standard deviation of the asset's price. It uses this momentum to calculate upper and lower bands that are plotted on the chart.
Warning signals: The indicator can also be used to identify potential warning signals. When the closing price of the asset moves above the upper band, it could indicate that the market is overbought and a potential reversal could occur. Conversely, when the closing price moves below the lower band, it could indicate that the market is oversold and a potential reversal could occur.
Contractions and expansions in the bands can provide important information to traders about potential price movements.
When the bands contract, it indicates that the market is experiencing low volatility and the price is likely to move sideways. During these periods, traders may look for other signals, such as support and resistance levels or price patterns, to determine potential entry and exit points.
On the other hand, when the bands expand, it indicates that the market is experiencing high volatility and the price is likely to move in a particular direction. Traders can use this information to identify potential trend reversals or continuation patterns. When the upper and lower bands move further apart, it indicates that the trend is becoming stronger, while when they move closer together, it indicates that the trend may be weakening.
When the price moves outside of the bands, it can also provide important information to traders. If the price moves above the upper band, it could indicate that the market is overbought and a potential reversal could occur. Conversely, if the price moves below the lower band, it could indicate that the market is oversold and a potential reversal could occur.
Very important note!
When you see contractions, please understand that it's a wonderful opportunity to pivot into position to catch a good trade because we will see an expansion after!

Trend and Momentum DashboardI created this indicator to tell me when it's time to trade (going long) and when it's time to wait (or going short).
You can enter up to 13 ticker (default is S&P500 and key market segments).
For each ticker, fibonacci levels are calculated and represented either in 5 color or 3 color mode as single lines.
(Thanks to eykpunter for the fibonacci level implementation. I'm using his code and modified it slightly).
Color coding (5 color mode) explanation:
blue = in uptrend area
light blue = in prudent buyers area
gray = in center area
light red = in prudent sellers area
red = in downtrend area
The topline is a combination of all ticker and shows if the market is either bullish or bearish (threshold adjustable in settings)
The bullish/bearish trend can also be used as background color. Alternatively the last bar in the selected time period is been highlighted.
How to use it:
The indicator works on all timeframes. Use the color coding explanation above to see the status of each asset.
a) You can evaluate "long" term trend using day or week timeframe. e.g. I'm usually trading only long and stay out of the market when it is not bullish (top line & background = blue). I'm also using it to know which segments/assets are currently "hot".
b) You can evaluate short term momentum (using 1h or lower timeframe) and see in which direction the market/assets are moving. e.g. I use this when the exchanges open to see how the day is going to move.
I've attached 3 examples in the screenshot - first is the default, in the second one I'm using different asset classes and the third one is for crypto.
Limitations:
There are security request limits as well as string limitations for the security calls in pine script, so I went to the maximum what is currently possible.
(No financial advise, for testing purposes only)

Indicator: Intrady Momentum IndexThe Intraday Momentum Index (IMI), developed by Tushar Chande, is a cross-breed between RSI and candlestick analysis. IMI determines the candle type that dominated the recent price action, using that to pinpoint the extremes in intraday momentum.
As the market tries to bottom after a sell off, there are gradually more candles with green bodies, even though prices remain in a narrow range. IMI can be used to detect this shift, because its values will increase towards 70. Similarly, as the market begins to top, there will be more red candles, causing IMI to decline towards 20. When the market is in trading range, IMI values will be in the neutral range of 40 to 60.
Usually intraday momentum leads interday momentum. QStick can show interday momentum, it complements IMI. You will find it in my published indicators.
I have added volatility bands based OB/OS, in addition to static OB/OS levels. You can also turn on IMI Ehlers smoothing. BTW, all parameters are configurable, so do check out the options page.
List of my other indicators:
-
- Google doc: docs.google.com

WaveRider Momentum OscillatorWaveRider Momentum Oscillator
The WaveRider Momentum Oscillator applies principles inspired by fluid dynamics to model price momentum as a flowing system, rather than relying on traditional static calculations. By interpreting market movement through the lens of velocity, viscosity, and turbulence—core concepts in fluid mechanics—this indicator offers a more adaptive and nuanced view of momentum that adjusts dynamically to changing market conditions.
Conceptual Foundation
Velocity: Just as fluid velocity measures the speed of flow at a point, WaveRider calculates momentum velocity by measuring the rate of price change over a specified period, smoothed to reduce noise.
Viscosity: In fluid dynamics, viscosity represents internal friction that resists flow. Here, viscosity is modeled based on volatility, modulating momentum signals to account for the “thickness” or noise level of the market. High volatility increases viscosity’s damping effect, reducing false signals during turbulent price action.
Turbulence: Turbulence characterizes sudden, chaotic changes in fluid flow. WaveRider detects rapid acceleration bursts in momentum analogous to turbulence, highlighting moments when momentum is shifting sharply and potentially signaling strong upcoming price moves.
Technical Features and Interpretation
Adaptive Momentum Calculation: Momentum is scaled by volatility-adjusted viscosity, making the oscillator less prone to whipsaws and more responsive during stable trends.
Turbulence Burst Detection: The oscillator incorporates a turbulence factor, identifying abrupt momentum accelerations that traditional oscillators often miss. This feature provides early warning signals of potential breakout or reversal points.
HSV Gradient Color Mapping: The oscillator visualizes acceleration using a continuous hue gradient—ranging from red (deceleration) through yellow (neutral) to green (acceleration). This continuous color transition provides intuitive, real-time insight into momentum dynamics beyond mere numeric values.
Pivot Point Identification: WaveRider automatically marks momentum pivots, signaling local maxima and minima in momentum flow. These points serve as critical confirmation markers for potential entry and exit decisions.
How to Interpret WaveRider
Colors:
Green hues indicate positive acceleration — momentum is increasing, favoring bullish positions.
Yellow hues represent neutral momentum — the market is consolidating or pausing.
Red hues signal negative acceleration — momentum is weakening, suggesting caution or bearish bias.
Oscillator Direction:
An upward sloping oscillator line reflects strengthening momentum.
A downward slope indicates weakening momentum or a potential reversal.
Pivot Labels:
▲ (Pivot Low): Denotes local momentum troughs; potential points to consider initiating long positions.
▼ (Pivot High): Marks local momentum peaks; useful for identifying possible short entries or profit-taking zones.
Summary
By grounding momentum analysis in fluid dynamics, WaveRider transcends the limitations of traditional oscillators. It accounts for the market’s inherent volatility and captures real-time acceleration changes, enabling traders to detect meaningful momentum shifts with greater accuracy and clarity.
WaveRider is designed for traders seeking a scientifically informed tool that adapts fluidly with market conditions—offering deeper insight into momentum flow and better timing for entries and exits.

Adaptive Sharp Momentum█ Introduction
The Adaptive Sharp Momentum Study has the following all-in-one features:
• A noise-free, trend-following indicator.
• Automatically detects implied tops and bottoms within fast price cycles.
• It identifies price consolidations and periods of indecision; often challenging to spot.
• Includes a unique feature for detecting directional price squeezes.
• An integrated volatility measure helps avoid false signals and clarifies trend direction.
• Lastly, it alerts traders when a volume climax is likely reached during a move.
This study primarily focuses on capturing momentum while concurrently alerting traders to shifting market dynamics, thereby aiding in the decision to either extend a position’s duration or optimize exit timing. The set of analytical tools, deployed alongside the trend-following indicator, are integrated to reflect the concepts outlined above. Furthermore, this framework utilizes distinctive methods for trend identification, consolidation recognition, directional squeeze assessment, and volume climax analysis—approaches that are not currently documented in publicly available resources.
█ Explanation of Core Components
1. Trend Following Consolidated Adaptive Moving Average:
At the core of the study is the Jurik Adaptive Average Curve, a fast-response adaptive moving average refined with an adaptive Relative Strength Index (RSX) function, known as Jurik RSX. This curve displays three trend modes—bullish, bearish, and indecisive—each customizable in color.
Users can adjust parameters such as the Phase and Consolidation Period:
• Phase: Influences the timing of trend signals, accommodating various trading styles. A lower phase value can produce leading signals, while a higher value may result in lagging signals.
• Consolidation Period: Helps filter out false signals. Optimize this period based on the time frame and instrument.
• Momentum Slope Threshold: As mentioned earlier, the Jurik moving average values are consolidated against the Dynamic Jurik RSX. Crossing the slope threshold of the Jurik RSX will trigger consolidation.
The main curve in the middle represents the overall trend. The issue with moving averages is that they work well in trends but when market is in consolidation, many false signals can be generated. The consolidation period acts as a second fast signal curve that helps eliminate the false signals generated through the standard adaptive moving average. This is basically done by measuring the momentum of the move itself through the Jurik RSX. There are other tools in this study that should also help the trader avoid false signals which will be fully described below.
2. Implied Tops and Bottoms
The study also detects Implied Tops and Bottoms during market cycles using the Composite Momentum and Projections. It offers three detection modes:
• Strong Signals: Indicate significant potential reversal points.
• Medium Signals: Typically displayed near the end of a trend, suggesting traders should prepare to exit.
• Rolling Signals: Alert traders to set tight stop losses to secure profits, as the market may be approaching a turning point.
By default, the colors of Rolling Signals and Medium Signals are the same for simplicity.
Note the following:
• The fast and slow period have the most effect on implied tops and bottoms detection.
• Adjusting the main period will also have an overall effect.
The above chart shows rolling tops, rolling bottoms, strong tops, and strong bottoms. A rolling top of bottom indicate an increase in momentum in that direction and thus a tight stoploss would be recommended, while a strong top/bottom indicates that an exit is warranted.
3. Consolidation and Volatility
If enabled, '+' will appear above the ceiling and floor plots if consolidation is detected. Consolidation is detected by using lookback function that determine if price is below a threshold or not. If below, then consolidation would be confirmed. This is accomplished by adjusting the ' Price Consolidation Threshold ' period
The above chart demonstrates detection of consolidation on a 1-minute chart. Also, note the ceiling and floor plot, it expands when volatility is high.
Consolidation detection helps weed out long and short signals indicated by the main curve.
4. Directional Squeeze
Another unique feature of this indicator is the detection of directional price squeeze. Directional squeeze is defined as a price push in the direction indicated by momentum whether upward or downward. This is different from the common squeeze indicators found on the web since this one is detecting a directional push.
The Directional Squeeze feature, indicated by up and down triangles above the main curve, highlights strong trends in the market's current direction:
• Trend Continuation: Allows traders to stay in profitable trades longer during strong trending markets.
• Multiple Modes: Offers single-bar (short-term) and longer-term squeezes. Single-bar squeezes can signal potential market reversals, while longer-term squeezes are useful in sustained trends.
Be mindful that under certain conditions, the directional squeeze could be directionless(sideways) if consolidation is outlined by the indicator. This is another useful feature the trader could utilize. The chart above mostly demonstrates directional squeeze but directionless can also be observed.
5. Volume Volatility and Volume Climax Detection
An essential feature of the Adaptive Sharp Momentum Study is its ability to measure Volume Volatility and detect Volume Climax moments:
• Volume Volatility Measure: Integrated into the study to help avoid false signals by assessing the strength of market moves. It provides better clarity on trend direction by indicating when the market is experiencing significant volume changes.
• Volume Climax Alerts: The study alerts traders when a volume climax is likely reached during a move, which is helpful for identifying potential reversal points or the culmination of a trend. Brighter confirmation signal dots indicate these climaxes, helping traders make timely entry/exit decisions.
• Adjustable Parameters: Traders can set the Volume Volatility Threshold and adjust the Volume Lookback Period to tailor the sensitivity of volume climax detection according to their trading strategy.
5. The indicator contains other useful features:
• Cycles: Helps determine when to enter long or short trades based on upward or downward market cycles. It also aids in recognizing retracement levels during a trend, allowing traders to capitalize on brief counter-trend movements. Those cycles can be observed as the up and down gray lines on the chart.
• Real-Time Table: The table is another visual aid that summarizes the status of each feature in real-time.
█ How to Use this Study Effectively
The main curve in the middle is your final decision point. Prior to entering a trade look for the following:
• Is the market in consolidation? If yes, then you'd be advised not to enter the trade until the study clearly shows no consolidation
• Is the ceil or floor plots showing a strong top or bottom, or even a volume climax in the direction to intend to enter? If yes, then either ensure you enter at a tight stop or don't enter
• Is there an indication of a directional squeeze with no consolidation or volume climax? Then this would be an ideal place to enter. Be mindful though that entering directional squeeze too late is not recommended.
• Once you are in the trade, look at consolidation, implied tops and bottoms, and volume climax to determine exit point. You will quickly realize if you entered a trade prematurely.
• Utilize the directional squeeze and the prevalent trend to help you stay in the trade longer.
• Adjust your stop losses depending on whether you are seeing a rolling implied top/bottom or a strong top/bottom.
• Also, at volume climaxes, be ready to exit. The approach with volume climax detection should be the same as the implied tops/bottoms.
Below is a chart demonstrating trading on a 1-minute chart. The study could be used for any time frame:
** Important Note **
This study relies on volume readings. Incorrect evaluation will be concluded without proper volume data.
█ How the Adaptive Sharp Momentum Works?
---Main Curve - Jurik Moving Average and RSX---
The Jurik Moving Average (JMA) and the Jurik RSX with Fisher transform (Relative Strength Index Extended) are technical tools designed to enhance data processing efficiency. The JMA uses an adaptive smoothing algorithm to dynamically adjust to market conditions, reducing lag while maintaining high responsiveness to price changes. the JMA incorporates a mechanism that determines smoothness based on input volatility. The RSX, on the other hand, tracks relative strength without introducing the overshoots and noise commonly seen in other momentum indicators. It achieves this by applying a yet another JMA smoothing function that ensures stability and consistency, making it a better candidate for identifying shifts.
This is a unique approach, but can simply be equated to two moving averages crossing over, except in this case, the RSX is crossing over with the JMA.
The process of determining market trends and consolidation for the main curve revolves around evaluating multiple conditions and rankings of indicators such as Jurik RSX, Fisher Transform, and Volume-based metrics (Adaptive On Balance Volume and Price Volatility). Here's how consolidation and trends are identified:
1. Trend Override Logic: The core logic evaluates whether specific conditions override the default trend determined by the JMA.
• Bearish Overrides: A trend is classified as bearish if specific conditions involving negative slopes of the RSX, bearish Fisher Transform readings, and other auxiliary rankings (AOBV trend rank or volatility ranks) are met.
• Bullish Overrides: Similarly, bullish trends are determined by the presence of positive RSX slopes, bullish Fisher readings, and supporting AOBV and volatility ranks.
• Neutral Overrides: If neither bullish nor bearish overrides dominate, and conflicting conditions are detected (e.g., a bearish Fisher with a bullish OBV), the trend can be overridden to neutral.
2. Dynamic Slope and Rank Analysis: RSX and Jurik Slopes: The slopes of the RSX and Jurik indicators play an important role. Increasing slopes suggest bullish momentum, while decreasing slopes imply bearish momentum.
3. Narrow Spread Analysis: Consolidation zones are identified by examining conditions like narrow spreads in price action and mixed indicator signals (e.g., a positive RSX slope alongside a neutral or bearish AOBV).
• When consolidation is detected, the system looks for confirming signals (AOBV or Fisher alignment) to determine whether the next move is likely to be bullish or bearish.
4.Fallback Logic:
If no explicit conditions are met for bullish, bearish, or neutral trends, the system defaults to comparing the current and previous values of the Jurik Moving Average. If the JMA is rising, the trend is set to bullish; otherwise, it defaults to bearish.
The process of consolidating The RSX with JMA, attempts to confirm the trend suggested by the Jurik moving average. As shown above, several factors play into this, but it is mostly motivated by the RSX and its slope
-- Detecting Tops and Bottoms --
• Composite Momentum
The Composite Momentum indicator analyzes the market's directional strength to identify implied tops and bottoms, especially at extreme values. It evaluates momentum by categorizing it into ranges that reflect moderate or strong trends for both bullish and bearish conditions. When momentum exceeds a positive threshold, it indicates a strong top, whereas values below a negative threshold then it's a strong bottom.
• Laguerre Dynamic Projection Bands
The Laguerre Dynamic Projection Bands focuses on price positioning within calculated dynamic boundaries. By applying linear regression, it projects upper and lower price bands, which serve as potential resistance and support levels. The oscillator value ranges from 0 to 100, representing the relative position of the current price. A value above 70 indicates the price is near a projected top, while a value below 30 suggests proximity to a projected bottom. Through custom Laguerre smoothing, the setup ensures that its signals remain stable and actionable.
• How They Work Together
The Composite Momentum and Projection Oscillator complement each other in detecting market tops and bottoms. The Projection Oscillator provides an early indication when price nears a critical level, while the Composite Momentum confirms whether the momentum supports the formation of a significant top or bottom.
-- Consolidation Detection, Volatility, and Volume Climax Detection --
• Summary of Consolidation Detection:
Consolidation is identified through a combination of statistical and smoothing applied to price data. The approach calculates deviations around the main plot using squared price inputs, smoothed averages, and adaptive multipliers. These deviations form dynamic upper and lower boundaries that adapt to changing market conditions. The system further evaluates these boundaries against historical bars to calculate a volume percentage, which indicates how often recent price action remains within these bands. A low percentage suggests consolidation, characterized by reduced volatility and price movement confined within a tighter range.
The bands around the main plot are derived from the calculated maximum deviations, creating adaptive ceilings and floors that expand or contract based on market dynamics. The Ceiling and Floor plots represent the outermost boundaries, while additional retracement plots are drawn based on the Composite Momentum wave rank. For example, during an uptrend, the retrace levels adjust upward in fractional steps relative to the deviation, signaling possible resistance levels. In downtrends, similar logic applies in reverse to determine support levels. These bands visually represent the volatility envelope and help contextualize price movements relative to expected ranges. Whenever, low volatility is detected, a visual "+" indicator is added to the plot to highlight that the market is likely in consolidation mode.
• How the Adaptive OBV Applies the Same Logic:
The Adaptive On-Balance Volume (OBV) uses a similar mechanism to detect volume climaxes by analyzing deviations in volume data. Instead of price, the OBV logic applies the squared input and smoothing methods to volume flows. By comparing these deviations to historical norms, the system identifies periods of high or low volatility in volume, which often coincide with potential breakouts or consolidation zones.
• How They Work Together
The consolidation detection process and the adaptive bands work in tandem to provide traders with a clear visualization of market conditions. When consolidation is detected, the dynamic bands narrow and a "+" sign is visualized, signaling reduced volatility and potential breakout opportunities. Similarly, volume-based analysis through the adaptive OBV helps confirm whether a breakout is accompanied by significant volume, adding confidence to trade decisions. Together, they enable anticipation of market shifts.
-- Directional Squeeze --
A directional price squeeze refers to a market condition where price compresses in a particular direction. This provides traders with an opportunity to stay in trades longer by aligning with the prevailing directional bias. This unique concept generates dynamic limits based on lookback period. Their convergence upward or downward is typically a strong indication of a price push toward the respective direction.
In this approach, the system looks at the highest and lowest values of a smoothed momentum reading over a recent period and measures the distance between them. Instead of relying on a static “overbought” or “oversold” line, it calculates new boundaries as a fraction of that distance, scaling the thresholds to match the price behavior. When these dynamically adjusted limits converge, it suggests a “directional squeeze”—meaning price is moving within a more compressed or focused range. Because these boundaries adapt to the market’s own highs and lows, they provide a more responsive indication of when price may be shifting into or out of a strong directional move.
• Determining the Directional Squeeze
Directional squeeze is identified using dynamic limits derived from two key factors:
Schaff Trend Cycle (STC) for single-bar squeezes. and the Slow RSI (SRSI) for multi-bar or longer-term squeezes. Both are utilizing a custom alpha factor for adaptability and conformance with the JMA and Dynamic RSX studies.
• Directional Trend Confirmation:
If the SRSI or STC approaches the limits, additional conditions such as Fisher RSX (momentum signals) and AOBV (volume signals) and the trend already established by the JMA are aligned. If so, then a squeezed in that trend directional is established.
█ Why These Components All Work Together?
The Adaptive Sharp Momentum Study integrates multiple components to provide a framework for analyzing market dynamics. Each feature addresses specific challenges in trading:
• Core Trend Identification:
The Jurik Adaptive Moving Average (JMA) and Jurik RSX ensure better trend detection by reducing noise and dynamically confirming momentum, thus minimizing lag and false signals.
• Implied Tops and Bottoms:
The combination of Composite Momentum and Laguerre Dynamic Projection Bands highlights critical turning points. This dual-layered approach identifies potential reversals and key support/resistance levels with improved clarity.
• Consolidation and Volatility:
Adaptive ceilings, floors, and consolidation detection filter out indecisive market phases. This helps avoid unreliable signals and provides a better perspective on potential breakouts or continuations.
• Directional Squeeze:
The Directional Squeeze feature identifies directional bias in price compression. Its dynamic thresholds adapt to market conditions, aiding in the assessment of strong directional moves.
• Volume Climax:
Volume volatility and climax detection highlight key moments of market activity, aiding in the evaluation of trend strength and potential turning points.
• Integrated Framework:
The integration of these components creates a system where each element complements the others.
This study offers a methodical approach to analyzing trends, momentum, and volatility while filtering noise. It is a tool designed to assist traders in navigating complex market conditions.
█ Disclaimer
This script is provided for educational and informational purposes only and should not be considered financial advice. Trading financial instruments carries a high level of risk and may not be suitable for all investors. Before using this script, please consult with a qualified financial advisor to ensure it aligns with your individual circumstances. The author does not guarantee the accuracy or completeness of the script and is not responsible for any losses or damages that may occur from its use. Use this script at your own risk.
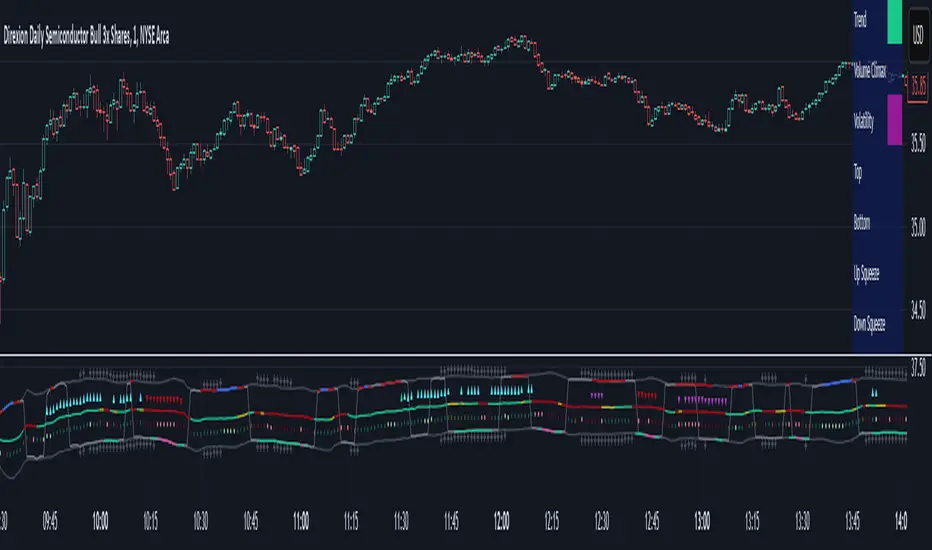
Adaptive Momentum Oscillator [BackQuant]Adaptive Momentum Oscillator
Please take time to read the following.
Conceptual Foundation and Innovation
The Adaptive Momentum Oscillator brings a new approach to momentum trading by introducing percentile-based adaptive thresholding. Unlike traditional momentum oscillators that rely on static overbought and oversold levels, this indicator adjusts dynamically to changing market conditions, providing more relevant signals in real-time. By combining percentile-based thresholds with a smoothed momentum oscillator, this tool allows traders to detect trend shifts with a higher degree of accuracy.
Technical Composition and Calculation
The core of this oscillator uses a lookback period to calculate the highest and lowest values of a smoothed price source (using a non-robust moving average). These values are then used to compute the oscillator, which normalizes the current price between the lookback high and low. The true innovation lies in its adaptive thresholds, which adjust based on percentiles of past oscillator values over a user-defined lookback period.
Lookback Period: The indicator checks the highest and lowest smoothed price over a set period, which becomes the basis for calculating momentum.
Percentile-Based Thresholds: The upper and lower thresholds are dynamically set at user-defined percentiles of historical momentum values, allowing the oscillator to adapt to the volatility and strength of the market.
Smoothing Length: Users can adjust the smoothing of the source input to fine-tune the sensitivity of the oscillator.
Features and User Inputs offer a host of customizable settings to suit different market conditions and trading strategies:
Adaptive Thresholding: Traders can set the lookback period and define the percentile levels for the upper (long) and lower (short) thresholds. This provides the ability to dynamically adjust to changing market conditions and avoid static thresholds that may become irrelevant over time.
Signal Line Customization: Users can configure the signal line width, colors for long, short, and neutral conditions, and choose whether to display adaptive threshold lines on the chart.
Candle Coloring: An optional feature allows traders to color the price bars based on the oscillator's trend signal, adding a visual confirmation layer for trend shifts.
Practical Applications
This oscillator is particularly effective in markets where the strength and direction of momentum are essential for identifying potential trend reversals or confirming ongoing trends. Traders can leverage the Adaptive Momentum Oscillator to:
Capture Adaptive Trends: The percentile-based thresholds adjust dynamically, ensuring that traders catch significant trends while filtering out market noise.
Avoid False Signals: By adapting to historical momentum levels, the oscillator reduces the risk of false breakouts or breakdowns, allowing for more reliable entries and exits.
Optimize Entries and Exits: With dynamically adjusting thresholds, the oscillator helps traders time their positions more effectively, minimizing the risk of getting caught in choppy or uncertain markets.
Advantages and Strategic Value
It offers a clear advantage over traditional static oscillators by continuously adjusting its sensitivity to market conditions. The adaptive percentile thresholds ensure that the indicator remains relevant, regardless of changes in volatility or market direction. This feature, combined with a customizable UI, makes the Adaptive Momentum Oscillator a powerful tool for traders looking to refine their momentum-based strategies with dynamic thresholds.
Summary and Usage Tips
The Adaptive Momentum Oscillator is a versatile tool for both trend-following and contrarian traders. Its dynamic nature allows for better alignment with current market conditions, while its user-friendly inputs offer extensive customization options. Traders are encouraged to experiment with the percentile-based threshold settings to find the optimal balance between signal sensitivity and noise reduction, particularly in fast-moving or volatile markets.
This indicator is best used in combination with other trend-confirmation tools, offering a dynamic layer to your trading system.
Thus following all of the key points here are some sample backtests on the 1D Chart
Disclaimer: Backtests are based off past results, and are not indicative of the future.
INDEX:BTCUSD
INDEX:ETHUSD
BINANCE:SOLUSD

Squeeze Momentum DeluxeThe Squeeze Momentum Deluxe is a comprehensive trading toolkit built with features of momentum, volatility, and price action. This script offers a suite for both mean reversion and trend-following analysis. Developed based on the original TTM Squeeze implementation by @LazyBear, this indicator introduces several innovative components to enhance your trading insights.
🔲 Components and Features
Momentum Oscillator - as rooted in the TTM Squeeze, quantifies the relationship between price and its extremes over a defined period. By normalizing the calculation, the values become comparable throughout time and across securities, allowing for a nuanced assessment of Bullish and Bearish momentum. Furthermore, by presenting it as a ribbon with a signal line we gain additional information about the direction of price swings.
Squeeze Bars - The original squeeze concept is based on the relationship between the Bollinger Bands and Keltner Channel , once the BB resides inside the KC a squeeze occurs. By understanding their fundamentals a new form of calculation can be inferred.
method bb(float src, simple int len, simple float mult) => method kc(float src, simple int len, simple float mult) =>
float basis = ta.sma (src, len) float basis = ta.sma (src, len)
float dev = ta.stdev(src, len) float rng = ta.atr ( len)
float upper = basis + dev * mult float upper = basis + rng * mult
float lower = basis - dev * mult float lower = basis - rng * mult
Both BB and KC are constructed upon a moving average with the addition of Standard Deviation and Average True Range respectively. Therefore, the calculation can be transformed to when the Stdev is lower than the ATR a squeeze occurs.
method sqz(float src, simple int len) =>
float dev = ta.stdev(src, len)
float atr = ta.atr ( len)
dev < atr ? true : false
This indicator uses three different thresholds for the ATR to gain three levels of price "Squeeze" for further analysis.
Directional Flux- This component measures the overall direction of price volatility, offering insights into trend sentiment. Presented as waves in the background, it includes an OverFlux feature to signal extreme market bias in a particular direction which can signal either exhaustion or vital continuation. Additionally, the user can choose if to base the calculation on Heikin-Ashi Candles to bias the tool toward trend assessment.
Confluence Gauges - Placed at the top and bottom of the indicator, these gauges measure confluence in the relationship between the Momentum Oscillator and Directional Flux. They provide traders with an easily interpretable visual aid for detecting market sentiment. Reversal doritos displayed alongside them contribute to mean reversion analysis.
Divergences (Real-Time) - Equipped with a custom algorithm, the indicator detects real-time divergences between price and the oscillator. This dynamic feature enhances your ability to spot potential trend reversals as they occur.
🔲 Settings
Directional Flux Length - Adjusts the period of which the background volatility waves operate on.
Trend Bias - Bases the calculation of the Flux to HA candles to bias its behavior toward the trend of price action.
Squeeze Momentum Length - Calibrates the length of the main oscillator ribbon as well as the period for the squeeze algorithm.
Signal - Controls the width of the ribbon. Lower values result in faster responsiveness at the cost of premature positives.
Divergence Sensitivity - Adjusts a threshold to limit the amount of divergences detected based on strength. Higher values result in less detections, stronger structure.
🔲 Alerts
Sell Signal
Buy Signal
Bullish Momentum
Bearish Momentum
Bullish Flux
Bearish Flux
Bullish Swing
Bearish Swing
Strong Bull Gauge
Strong Bear Gauge
Weak Bull Gauge
Weak Bear Gauge
High Squeeze
Normal Squeeze
Low Squeeze
Bullish Divergence
Bearish Divergence
As well as the option to trigger 'any alert' call.
The Squeeze Momentum Deluxe is a comprehensive tool that goes beyond traditional momentum indicators, offering a rich set of features to elevate your trading strategy. I recommend using toolkit alongside other indicators to have a wide variety of confluence to therefore gain higher probabilistic and better informed decisions.

Histogram Momentum Shaded CandlesDescription:
The Histogram Momentum Shaded Candles indicator (HMSC) is a powerful technical analysis tool that combines the concepts of the MACD (Moving Average Convergence Divergence) indicator and shaded candlestick visualization. It provides insights into momentum and trend strength by representing the MACD histogram as shaded candles on the chart.
How it Works:
The HMSC indicator calculates the MACD (Moving Average Convergence Divergence) using user-defined parameters such as the fast length, slow length, source, signal smoothing, and moving average types. It then calculates the MACD histogram by subtracting the signal line from the MACD line. The indicator transforms the histogram values into transparency levels for the shaded candles, representing bullish and bearish momentum.
Usage:
To effectively utilize the Histogram Momentum Shaded Candles indicator, follow these steps:
1. Apply the HMSC indicator to your chart by adding it from the available indicators.
2. Customize the MACD settings such as the fast length, slow length, source, signal smoothing, and moving average types according to your trading preferences.
3. Observe the shaded candles plotted on the chart:
- Bullish shaded candles (green by default) indicate positive momentum and potential buying pressure.
- Bearish shaded candles (red by default) indicate negative momentum and potential selling pressure.
4. Assess the intensity of the shaded candles:
5. Shading intensity is determined by the magnitude of the MACD histogram, with higher values resulting in more opaque candles.
6. The shading intensity reflects the strength of momentum and can help identify significant shifts in price action.
7. Combine the analysis of shaded candles with traditional candlestick patterns, trend lines, support and resistance levels, and other technical indicators to validate potential trade setups.
8. Implement appropriate risk management strategies, including setting stop-loss orders and position sizing, to manage your trades effectively and protect your capital.
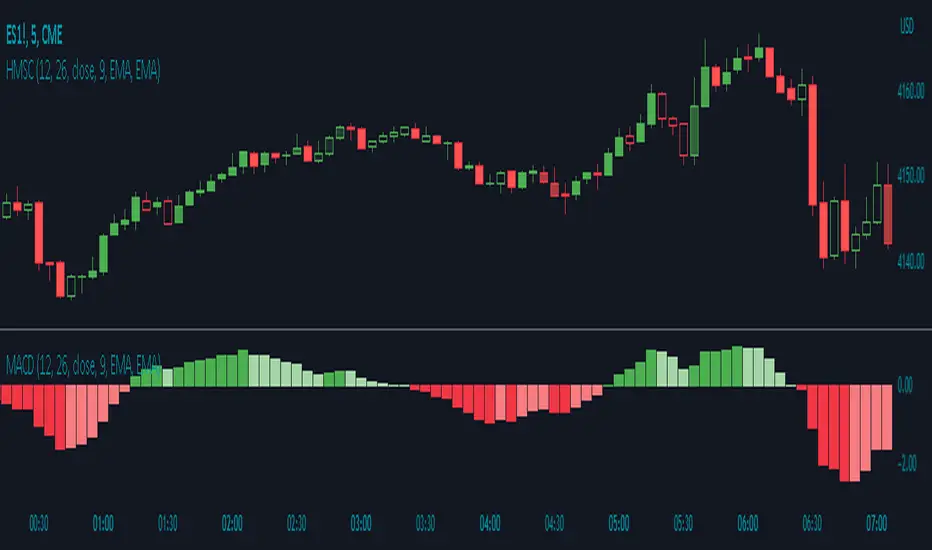
TRIX with Momentum----------- ENGLISH --------------
This indicator is called "TRIX with Momentum" and is used to analyze the momentum of an asset's price and predict potential trend reversals. The logic of operation is based on the combination of two indicators: the Triple Exponential Moving Average (TRIX) and the momentum oscillator.
The TRIX is calculated using three exponential moving averages (EMA) of the asset's closing price, with a user-defined length (set to 14 by default). The TRIX is then normalized and centered around 0 to facilitate analysis of its relationship with the momentum oscillator.
The momentum oscillator is calculated using the EMA of the normalized TRIX with a user-defined length (set to 14 by default).
The indicator plots the normalized TRIX and the momentum oscillator on a chart, using different colors to indicate whether the TRIX is above or below 0. Additionally, the color of the y-axis label changes based on the position of the oscillator, while the color of the x-axis label remains gray.
The indicator uses a weighted average between the normalized TRIX and the momentum oscillator to create a colored background of the chart, which changes based on the weighted average. If the weighted average is positive, the chart's background is green, otherwise it is red. Finally, a horizontal line is drawn at point 0 to facilitate visual analysis of the chart.
------------ ITALIANO -------------
Questo indicatore è chiamato "TRIX with Momentum" ed è utilizzato per analizzare il momentum del prezzo di un asset e prevedere eventuali inversioni di trend. La logica di funzionamento è basata sulla combinazione di due indicatori: il TRIX (Indicatori di media mobile Tripla Esponenziale) e l'oscillatore momentum.
L'indicatore consente all'utente di impostare la lunghezza del TRIX e dell'oscillatore momentum come input personalizzato. Il TRIX viene calcolato utilizzando tre medie mobili esponenziali (EMA) della chiusura dei prezzi dell'asset, mentre l'oscillatore momentum viene calcolato utilizzando l'EMA del TRIX normalizzato.
Il TRIX normalizzato viene centrato intorno allo 0 per facilitare l'analisi della sua relazione con l'oscillatore momentum. L'indicatore plotta il TRIX normalizzato e l'oscillatore momentum su un grafico, utilizzando diversi colori per indicare se il TRIX è sopra o sotto lo 0.
L'indicatore utilizza una media pesata tra il TRIX normalizzato e l'oscillatore momentum per creare uno sfondo colorato del grafico, che cambia in base alla media pesata. L'utente può impostare il peso da dare al TRIX e all'oscillatore momentum come input personalizzato, e il peso dell'oscillatore momentum verrà automaticamente impostato come complementare al peso del TRIX.
Se la media pesata è positiva, lo sfondo del grafico è verde, altrimenti è rosso. Viene tracciata anche una linea orizzontale al punto 0 per facilitare l'analisi visiva del grafico.
Infine, il colore dell'etichetta dell'asse y cambia in base alla posizione dell'oscillatore, mentre il colore dell'etichetta dell'asse x rimane sempre grigio.
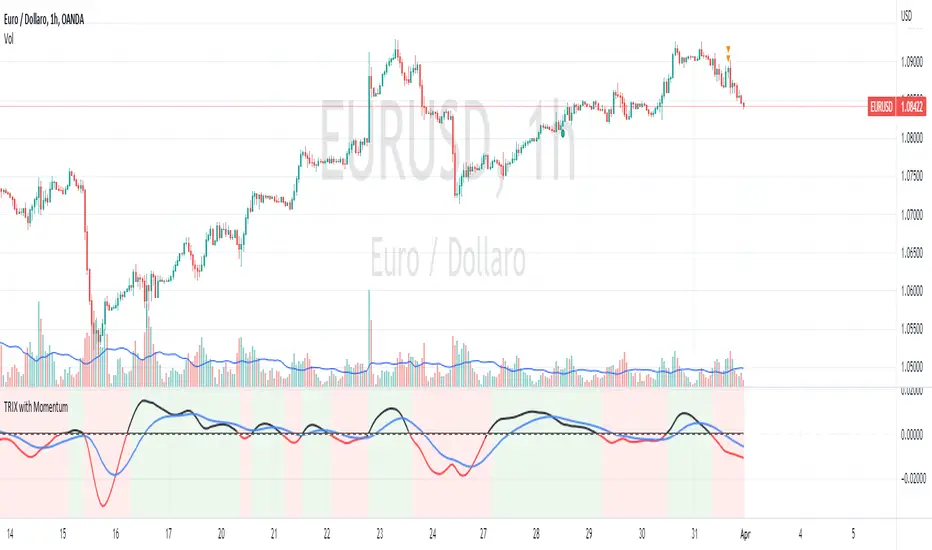
52SIGNAL RECIPE AMA Momentum Vector═══52SIGNAL RECIPE AMA Momentum Vector═══
◆ Overview
52SIGNAL RECIPE AMA Momentum Vector is an advanced technical indicator based on Adaptive Moving Average (AMA), integrating volume filtering and gradient zone visualization to provide comprehensive analysis of price trends and momentum.
It automatically adjusts to market conditions by calculating efficiency ratios, reducing noise while clearly capturing significant trends. The volume confirmation system helps traders identify high-probability entry and exit points with precision.
─────────────────────────────────────
◆ Key Features
• Adaptive Moving Average: Smart moving average that automatically adjusts based on market conditions
• Volume Filter Integration: Double-confirmation of important price movements through volume analysis
• Momentum Gradient Zones: Intuitive visualization of trend strength through color gradation
• Signal Confirmation System: Generation of high-reliability buy/sell signals by combining multiple factors
• Trend Direction Identification: Clear color distinction between bullish and bearish market conditions
• Automatic Adaptation: Intelligent design that self-adjusts to various market situations
─────────────────────────────────────
◆ Technical Foundation
■ AMA Calculation Principles
• Efficiency Ratio (ER): Measures how efficiently price moves in one direction
• Dynamic Smoothing Coefficient: Automatically adjusts faster or slower based on market conditions
• Adaptive Algorithm: Less sensitive during sideways markets, more responsive during trending markets
• Noise Reduction Function: Filters out meaningless price movements while capturing important signals
■ Momentum Vector Implementation
• Trend-Price Distance Calculation: Measures trend strength by the distance between AMA and current price
• Color Gradation: Visual system where color intensity changes proportionally to trend strength
• ATR-Based Adjustment: Automatically adjusts gradient zone width according to market volatility
• Directional Color Distinction: Intuitive display with blue/cyan for uptrends and red for downtrends
─────────────────────────────────────
◆ Practical Applications
■ Price Trend Interpretation
• Trend Direction Assessment:
▶ Price above AMA with blue gradation indicates ongoing bullish momentum
▶ Price below AMA with red gradation indicates ongoing bearish momentum
• Momentum Strength Verification:
▶ Deeper gradient colors mean stronger momentum and healthier trends
▶ Lighter gradient colors suggest weakening momentum and potential reversal
■ Trading Strategy Utilization
• Trend Following Strategy:
▶ Buy signal when price crosses above AMA with increased volume
▶ Sell signal when price crosses below AMA with increased volume
• Momentum Confirmation Trading:
▶ Deep gradation increases confidence in trend continuation for entry decisions
▶ Multiple consecutive candles staying on one side of AMA increases trend reliability
─────────────────────────────────────
◆ Advanced Configuration Options
■ Input Parameter Guide
• Fast Period (Default: 2)
▶ 1-2: Responds very quickly to price changes. Suitable for short-term trading.
▶ 3-5: Moderate response that reduces frequent signals.
▶ 6-10: Slower response but captures only more definitive trends.
• Slow Period (Default: 30)
▶ 20-25: AMA moves faster. Good for shorter timeframe trading.
▶ 26-35: Balanced speed suitable for most market conditions.
▶ 36-50: AMA moves slowly, smoothly following long-term trends.
• Efficiency Ratio Period (Default: 10)
▶ 5-8: Focuses more on recent price movements. Responds quickly to changes.
▶ 9-12: Balanced period suitable for most situations.
▶ 13-20: Considers longer-term price movements, ignoring temporary fluctuations.
• Volume Average Period (Default: 20)
▶ 10-15: Compares with the average volume of the last 10-15 days. More sensitive to changes.
▶ 16-25: Compares with the average volume of approximately the last month. Balanced setting.
▶ 26-50: Compares with long-term average volume, capturing only truly significant volume changes.
• Volume Threshold Multiplier (Default: 1.2)
▶ 1.0-1.1: Recognizes volume just 10% above average as valid.
▶ 1.2-1.5: Requires volume 20-50% higher than average (e.g., 1.2 means 120% of average).
▶ 1.6-2.0: Recognizes only very high volume at least 1.6 times (160%) above average.
■ Timeframe-Specific Recommended Settings
• Short Timeframes (5min-1hr):
Fast Period 2, Slow Period 20, Efficiency Ratio Period 8
→ Responds quickly to price changes, suitable for day trading.
• Medium Timeframes (4hr-daily):
Fast Period 2, Slow Period 30, Efficiency Ratio Period 10
→ Most balanced setting for general swing trading.
• Long Timeframes (daily-weekly):
Fast Period 2, Slow Period 40, Efficiency Ratio Period 14
→ Optimized for smoothly tracking longer trends.
■ Market-Specific Recommended Settings
• Stock Market:
Volume Threshold 1.2, Volume Average Period 20
→ Signal is valid when volume is 20% above average.
• Forex Market:
Volume Threshold 1.5, Efficiency Ratio Period 12
→ Forex requires higher volume to be meaningful and slightly longer efficiency measurement.
• Cryptocurrency Market:
Volume Threshold 1.3, Fast Period 2, Slow Period 25
→ Settings optimized for highly volatile cryptocurrencies.
─────────────────────────────────────
◆ Synergy with Other Indicators
• Moving Averages: Trend reliability increases when AMA and key moving averages point in the same direction
• RSI/Stochastic: Powerful reversal signals when AMA crossovers occur in overbought/oversold zones
• MACD: Signal probability greatly increases when MACD histogram direction changes coincide with AMA crossovers
• Bollinger Bands: Trend strength can be determined by AMA's position within Bollinger Bands
• Support/Resistance Levels: Success probability dramatically increases when AMA breakouts occur at key price levels
─────────────────────────────────────
◆ Conclusion
AMA Momentum Vector provides accurate price trend analysis by combining the advanced features of adaptive moving averages with momentum visualization technology.
It perfectly adapts to constantly changing market environments through its self-adjusting algorithm and generates highly reliable trading signals through its volume confirmation system.
Users can optimize the indicator for their trading style and market conditions with simple parameter adjustments, enabling effective trading decisions that comprehensively consider price direction, momentum strength, and volume confirmation.
─────────────────────────────────────
※ Disclaimer: Past performance does not guarantee future results. Always use appropriate risk management strategies.
═══52SIGNAL RECIPE AMA Momentum Vector═══
◆ 개요
52SIGNAL RECIPE AMA Momentum Vector는 적응형 이동평균(AMA)을 기반으로 한 고급 기술적 지표로, 볼륨 필터링과 그라데이션 존 시각화를 통합하여 가격 추세와 모멘텀을 종합적으로 분석합니다.
시장 효율성 비율을 자동으로 계산하여 시장 상황에 맞게 스스로 조정되며, 노이즈는 줄이고 중요한 추세는 선명하게 포착합니다. 또한 볼륨 확인 시스템을 통해 높은 확률의 매매 시점을 정확하게 식별할 수 있도록 도와줍니다.
─────────────────────────────────────
◆ 주요 특징
• 적응형 이동평균: 시장 상황에 따라 자동으로 조정되는 스마트한 이동평균선
• 볼륨 필터 통합: 중요한 가격 움직임을 볼륨으로 한번 더 확인
• 모멘텀 그라데이션 존: 색상 그라데이션으로 추세의 강도를 직관적으로 시각화
• 신호 확인 시스템: 여러 요소를 종합하여 신뢰도 높은 매수/매도 신호 생성
• 추세 방향 식별: 상승세와 하락세를 색상으로 명확하게 구분
• 자동 적응 기능: 다양한 시장 상황에 알아서 맞춰지는 지능형 설계
─────────────────────────────────────
◆ 기술적 기반
■ AMA 계산 원리
• 효율성 비율 (ER): 가격이 얼마나 효율적으로 한 방향으로 움직이는지 측정
• 동적 평활화 계수: 시장 상황에 따라 빠르거나 느리게 자동 조절되는 계수
• 적응형 알고리즘: 횡보장에서는 둔감하게, 추세장에서는 민감하게 반응
• 노이즈 감소 기능: 무의미한 가격 움직임은 걸러내고 중요한 신호만 포착
■ 모멘텀 벡터 구현
• 추세-가격 거리 계산: AMA와 현재 가격 사이의 거리로 추세 강도 측정
• 색상 그라데이션: 추세 강도에 비례하여 색상 농도가 변하는 시각화 시스템
• ATR 기반 조정: 시장 변동성에 맞춰 그라데이션 영역 너비 자동 조절
• 방향성 색상 구분: 상승세는 파란색/청록색, 하락세는 빨간색으로 직관적 표시
─────────────────────────────────────
◆ 실용적 응용
■ 가격 추세 해석
• 추세 방향 판단:
▶ 가격이 AMA 위에 있고 파란색 그라데이션이 보이면 상승 모멘텀 진행 중
▶ 가격이 AMA 아래에 있고 빨간색 그라데이션이 보이면 하락 모멘텀 진행 중
• 모멘텀 강도 확인:
▶ 그라데이션 색상이 진할수록 모멘텀이 강하고 추세가 건강함을 의미
▶ 그라데이션 색상이 옅을수록 모멘텀이 약해지고 있으며 반전 가능성 시사
■ 트레이딩 전략 활용
• 추세 추종 전략:
▶ 가격이 AMA를 상향 돌파하고 볼륨이 증가하면 매수 신호
▶ 가격이 AMA를 하향 돌파하고 볼륨이 증가하면 매도 신호
• 모멘텀 확인 트레이딩:
▶ 진한 그라데이션은 추세 지속 가능성이 높음을 의미하므로 진입 확신 강화
▶ 여러 캔들이 연속해서 AMA 한쪽에 머물면 추세의 신뢰도가 높아짐
─────────────────────────────────────
◆ 고급 설정 옵션
■ 인풋 파라미터 가이드
• 빠른 기간 (Fast Period) (기본값: 2)
▶ 1-2: 가격 변화에 매우 빠르게 반응합니다. 단기 거래에 적합합니다.
▶ 3-5: 적당히 반응하여 잦은 신호를 줄여줍니다.
▶ 6-10: 반응이 느리지만 더 확실한 추세만 포착합니다.
• 느린 기간 (Slow Period) (기본값: 30)
▶ 20-25: AMA가 더 빠르게 움직입니다. 짧은 시간 거래에 좋습니다.
▶ 26-35: 균형 잡힌 속도로 대부분의 시장 상황에 적합합니다.
▶ 36-50: AMA가 천천히 움직여 장기 추세를 부드럽게 따라갑니다.
• 효율성 비율 기간 (Efficiency Ratio Period) (기본값: 10)
▶ 5-8: 최근 가격 움직임에 더 집중합니다. 변화에 빠르게 반응합니다.
▶ 9-12: 균형 잡힌 기간으로 대부분의 상황에 적합합니다.
▶ 13-20: 더 긴 기간의 가격 움직임을 고려하여 일시적인 변동을 무시합니다.
• 볼륨 평균 기간 (Volume Average Period) (기본값: 20)
▶ 10-15: 최근 10-15일의 평균 볼륨과 비교합니다. 변화에 민감합니다.
▶ 16-25: 지난 약 한 달간의 평균 볼륨과 비교합니다. 균형 잡힌 설정입니다.
▶ 26-50: 장기 평균 볼륨과 비교하여 정말 큰 볼륨 변화만 포착합니다.
• 볼륨 임계값 승수 (Volume Threshold Multiplier) (기본값: 1.2)
▶ 1.0-1.1: 평균보다 약 10% 정도만 높아도 유효한 볼륨으로 인정합니다.
▶ 1.2-1.5: 평균보다 20~50% 높은 볼륨을 요구합니다(예: 1.2는 평균의 120%).
▶ 1.6-2.0: 평균의 최소 1.6배(160%) 이상 되는 매우 높은 볼륨만 인정합니다.
■ 타임프레임별 추천 설정
• 짧은 시간 차트 (5분-1시간):
빠른 기간 2, 느린 기간 20, 효율성 비율 기간 8
→ 가격 변화에 빠르게 반응하며 단타에 적합합니다.
• 중기 차트 (4시간-일봉):
빠른 기간 2, 느린 기간 30, 효율성 비율 기간 10
→ 일반적인 스윙 트레이딩에 가장 균형 잡힌 설정입니다.
• 장기 차트 (일봉-주봉):
빠른 기간 2, 느린 기간 40, 효율성 비율 기간 14
→ 더 긴 추세를 매끄럽게 추적하는 데 최적화되었습니다.
■ 시장별 추천 설정
• 주식 시장:
볼륨 임계값 1.2, 볼륨 평균 기간 20
→ 평균보다 20% 많은 볼륨이 있을 때 신호가 유효합니다.
• 외환 시장:
볼륨 임계값 1.5, 효율성 비율 기간 12
→ 외환은 볼륨이 더 높아야 의미가 있으며, 약간 더 긴 효율성 측정이 필요합니다.
• 암호화폐 시장:
볼륨 임계값 1.3, 빠른 기간 2, 느린 기간 25
→ 변동성이 큰 암호화폐에 최적화된 설정입니다.
─────────────────────────────────────
◆ 다른 지표와의 시너지
• 이동평균선: AMA와 주요 이동평균선이 같은 방향을 가리킬 때 추세 신뢰도 상승
• RSI/스토캐스틱: 과매수/과매도 구간에서 AMA 교차 발생 시 강력한 반전 신호
• MACD: MACD 히스토그램 방향 변화와 AMA 교차가 일치하면 신호 확률 대폭 증가
• 볼린저 밴드: AMA가 볼린저 밴드 내에서 어떤 위치에 있는지로 추세 강도 판단
• 지지/저항 레벨: 중요 가격대에서 AMA 돌파 시 성공 확률이 크게 증가
─────────────────────────────────────
◆ 결론
AMA Momentum Vector는 적응형 이동평균의 고급 기능과 모멘텀 시각화 기술을 결합하여 정확한 가격 추세 분석을 제공합니다.
자체 조정 알고리즘으로 시시각각 변하는 시장 환경에 완벽하게 적응하며, 볼륨 확인 시스템을 통해 신뢰도 높은 매매 신호를 생성합니다.
사용자는 간단한 파라미터 조정으로 자신의 거래 스타일과 시장 상황에 맞게 지표를 최적화할 수 있어, 가격 방향, 모멘텀 강도, 볼륨 확인을 종합적으로 고려한 효과적인 거래 결정을 내릴 수 있습니다.
─────────────────────────────────────
※ 면책 조항: 과거 성과가 미래 결과를 보장하지 않습니다. 항상 적절한 리스크 관리 전략을 사용하세요.
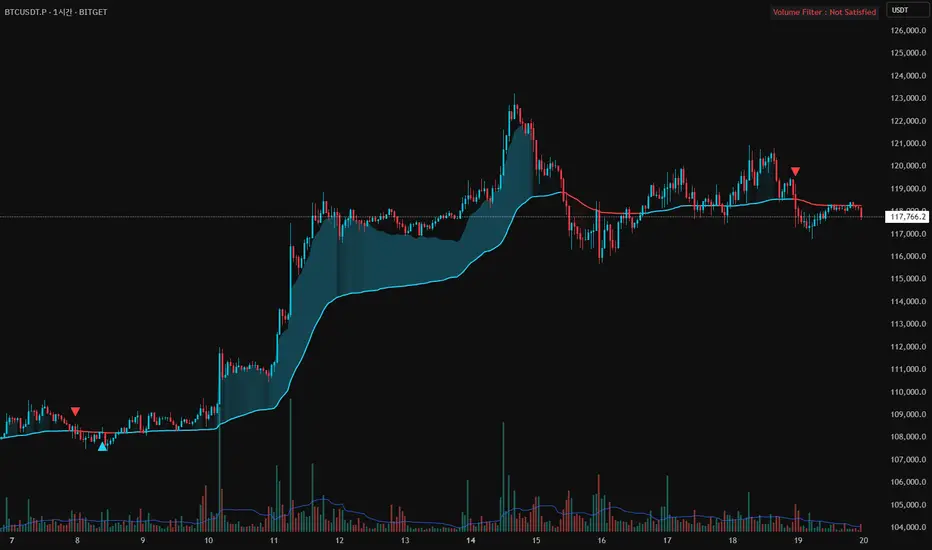
Trend & Momentum V2Declutter your charts. Simple indicator combining trend and momentum using Moving Average (currently default to 9-day EMA) and RSI (default length of 8). A long signal is generated when the price closes above the moving average and the moving average color turns red to green which indicated that the momentum measured using RSI is greater than 50. A short signal is generated when the price closes below the moving average and the moving average color turns green to red indicating RSI is below 50. Confirmation is done if there is no reversal on the next candle. For best results use multiple timeframe charts to trade on the right side of trend and momentum.

Cycle Swing MomentumAdaptive Ultra-Smooth Momentum indicator
The Cycle-Swing-Indicator "CSI" provides an optimized "momentum" oscillator based on the current dominant cycle by looking at the swing of the dominant cycle instead of the raw source momentum. Offering the following improvements:
Smoothness
Zero delay
Sharpness at turning points
Robust and adaptable to market conditions
Accurate deviation detection
The following common problems with standard indicators are solved by this indicator:
First, normal indicators introduce a lot of false signals due to their noisy signal line. Second, to compensate for the noise, one would normally try to add some smoothing. But this only results in adding more delay to the indicator, which makes it almost useless. Third, standard indicators require a length adjustment to derive reliable signals. However, you never know how to set the right length.
All three problems described above are solved by the developed adaptive cyclic algorithm.
The above chart shows current Bitcoin 4h data from the last days as of writing with the proposed signal reading for this indicator. The standard momentum indicator is included for comparison.
HOW TO USE
The indicator works without any parameter and can be applied to any chart and any time-frame. It will adapt automatically to the Dominant Cycle and use the dominant cycle of the source data to derive the ultra smooth momentum curve. Adaptive upper/lower bands are included and highlight areas with extreme readings. Automatic divergence detection can be turned off/on.
HOW TO READ
The indicator can be used like any oscillator. In addition, it provides adaptive high and low bands.
* Look for turns above the upper/lower bands
* Look for divergences between source and signals line
Further reading/Original source:
The indicator uses the dominant cycle to optimize signal, smoothing and cyclic memory. To get more in-depth information on the Cycle Swing Indicator, please read Chapter 10 "Cycle Swing Indicator: Trading the swing of the dominant cycle" of the book "Decoding the Hidden Market Rhythm, Part 1" available at your favorite book store.
Related ideas:
Please also check the cyclic RSI indicator which also uses cyclic information to improve the signal.

Adaptive Momentum Oscillator(AMO)Here is a new experimental indicator that we've been developing that is focused on gauging momentum.
The indicator fluctuates above and below zero, but instead of using zero as the threshold for differentiating positive and negative momentum, it uses an 89 period median(plotted as the thick white line).
The momentum over the previous 10 periods is then calculated and then smoothed using a 6 period Exponential Moving Average (EMA). This, as well as the choice to use a median as the central divider were done to eliminate the whipsaws that are often generated when making strategies based on pure momentum and crossings above/below 0. The EMA alternates between lime green when it is above the median and pink when it is below. The area between the EMA and median is filled in green when EMA > median and pink when the EMA is less than the median.
Then, a 29 period Simple Moving Average of momentum is calculated. Here, going with a SMA over EMA and a longer window(29) seemed to make sense as it is counteracts the high responsiveness of the EMA. The SMA is green when greater than the median and red when less than the median.
There's two ways to trade using this system. One way would be to go long when the momentum EMA crosses over the white median line and turns lime green, then short when it crosses back under the median line and turns white. Another option is to go long under the same conditions, but short when both the EMA and SMA are above the median and the EMA crosses under the SMA.
Not sure if this exact configuration has already been created by someone, but it'll be interesting to see how it holds up with more backtesting and then running it fully automated.
-Strategy version coming soon-

FREE INDICATOR: VOLUME MOMENTUMFor the momentum trader there are plenty of price momentum indicators, here's one that tracks the volume's momentum. Rising momentum in both price and volume is great for any momentum trader.
Add this to your chart, play with the settings, and maybe you'll notice something new!
Grab the source code here: pastebin.com
Installation video by @ChrisMoody here : vimeopro.com
·´¯`·.¸¸.·´¯`· Feel free to follow me to keep up with my latest scripts! ·´¯`·.¸¸.·´¯`·
·´¯`·.¸¸.·´¯`· PLEASE THUMB UP OR STAR IF YOU LIKE THIS INDICATOR! ·´¯`·.¸¸.·´¯`·
I'd like as many people as possible to get it :)
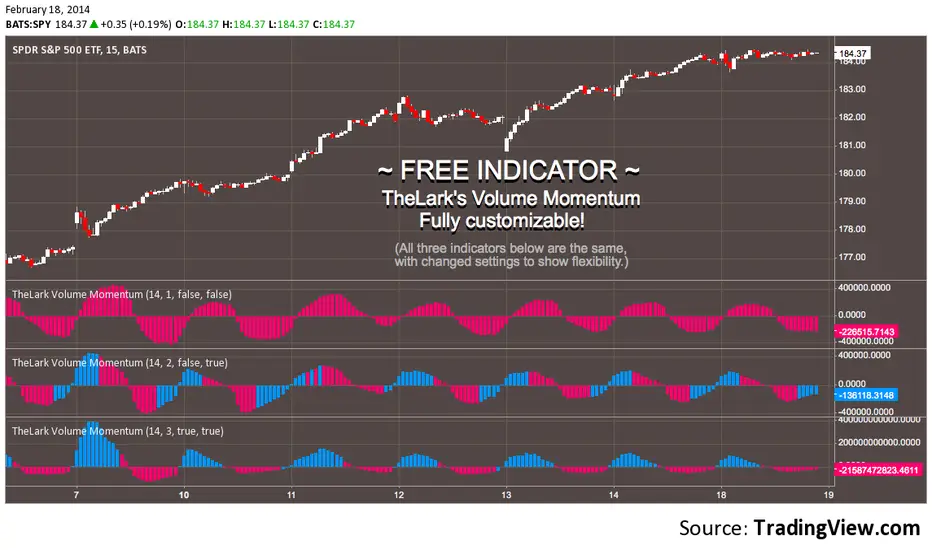
Momentum with ATR and Volatility [ST]Momentum with ATR and Volatility
Description in English:
This indicator combines price momentum with market volatility to identify entry and exit points in trades.
It utilizes the difference in closing prices (momentum) and the Average True Range (ATR) to measure volatility. Buy and sell signals are generated based on the combination of these two components.
Detailed Explanation:
Configuration:
Momentum Length: This input defines the period for calculating the momentum, which is the difference between the closing prices. The default value is 10.
ATR Length: This input defines the period for calculating the Average True Range (ATR), which measures market volatility. The default value is 14.
ATR Threshold: This input defines the threshold multiplier for the ATR to generate buy and sell signals. The default value is 3.5.
Momentum Calculation:
Momentum is calculated as the difference between the current closing price and the closing price momentum_length periods ago.
ATR Calculation:
The ATR is calculated based on the specified length and is used to measure market volatility.
Buy and Sell Signals:
Buy Signal: Generated when momentum is positive, the current close is higher than the previous close, and momentum is greater than ATR * threshold.
Sell Signal: Generated when momentum is negative, the current close is lower than the previous close, and momentum is less than -ATR * threshold.
Plotting:
Buy signals are plotted as green triangles below the bars.
Sell signals are plotted as red triangles above the bars.
Momentum and ATR thresholds are plotted in a separate panel below the main chart.
Momentum is plotted as a blue line.
The ATR threshold lines are plotted as solid orange lines.
Indicator Benefits:
Momentum Measurement: Helps traders gauge the momentum of price movements.
Volatility Measurement: Utilizes ATR to measure market volatility, providing a more comprehensive analysis.
Visual Cues: Provides clear visual signals for buy and sell points, aiding in making informed trading decisions.
Justification of Component Combination:
Combining momentum with ATR provides a more robust measure of potential entry and exit points by considering both price movement and market volatility.
How Components Work Together:
The script calculates momentum and ATR for the specified periods.
It generates buy and sell signals based on the conditions of momentum and ATR.
The signals and values are plotted on the chart to provide a visual representation, helping traders identify potential trading opportunities.
Título: Indicador de Momentum com ATR e Volatilidade
Descrição em Português:
Este indicador combina o momentum do preço com a volatilidade do mercado para identificar pontos de entrada e saída em operações.
Utiliza a diferença entre os preços de fechamento (momentum) e o Average True Range (ATR) para medir a volatilidade. Sinais de compra e venda são gerados com base na combinação desses dois componentes.
Explicação Detalhada:
Configuração:
Comprimento do Momentum: Este parâmetro define o período para calcular o momentum, que é a diferença entre os preços de fechamento. O valor padrão é 10.
Comprimento do ATR: Este parâmetro define o período para calcular o Average True Range (ATR), que mede a volatilidade do mercado. O valor padrão é 14.
Limite do ATR: Este parâmetro define o multiplicador de limite para o ATR para gerar sinais de compra e venda. O valor padrão é 3.5.
Cálculo do Momentum:
O momentum é calculado como a diferença entre o preço de fechamento atual e o preço de fechamento momentum_length períodos atrás.
Cálculo do ATR:
O ATR é calculado com base no comprimento especificado e é usado para medir a volatilidade do mercado.
Sinais de Compra e Venda:
Sinal de Compra: Gerado quando o momentum é positivo, o fechamento atual é maior que o fechamento anterior, e o momentum é maior que ATR * threshold.
Sinal de Venda: Gerado quando o momentum é negativo, o fechamento atual é menor que o fechamento anterior, e o momentum é menor que -ATR * threshold.
Plotagem:
Sinais de compra são plotados como triângulos verdes abaixo das barras.
Sinais de venda são plotados como triângulos vermelhos acima das barras.
O momentum e os limites do ATR são plotados em um painel separado abaixo do gráfico principal.
O momentum é plotado como uma linha azul.
As linhas de limite do ATR são plotadas como linhas laranjas sólidas.
Benefícios do Indicador:
Medição do Momentum: Ajuda os traders a avaliar o momentum dos movimentos de preços.
Medição da Volatilidade: Utiliza o ATR para medir a volatilidade do mercado, proporcionando uma análise mais abrangente.
Sinais Visuais: Fornece sinais visuais claros para pontos de compra e venda, auxiliando na tomada de decisões informadas.
Justificação da Combinação de Componentes:
Combinar o momentum com o ATR fornece uma medida mais robusta de potenciais pontos de entrada e saída ao considerar tanto o movimento dos preços quanto a volatilidade do mercado.
Como os Componentes Funcionam Juntos:
O script calcula o momentum e o ATR para os períodos especificados.
Gera sinais de compra e venda com base nas condições de momentum e ATR.
Os sinais e valores são plotados no gráfico para fornecer uma representação visual, ajudando os traders a identificar oportunidades de negociação potenciais.
