MACD with TrendIndicator Name: MACD with Trend & Multi-Timeframe Dashboard
Why Use This Indicator?
Two MACDs for Double Confirmation:
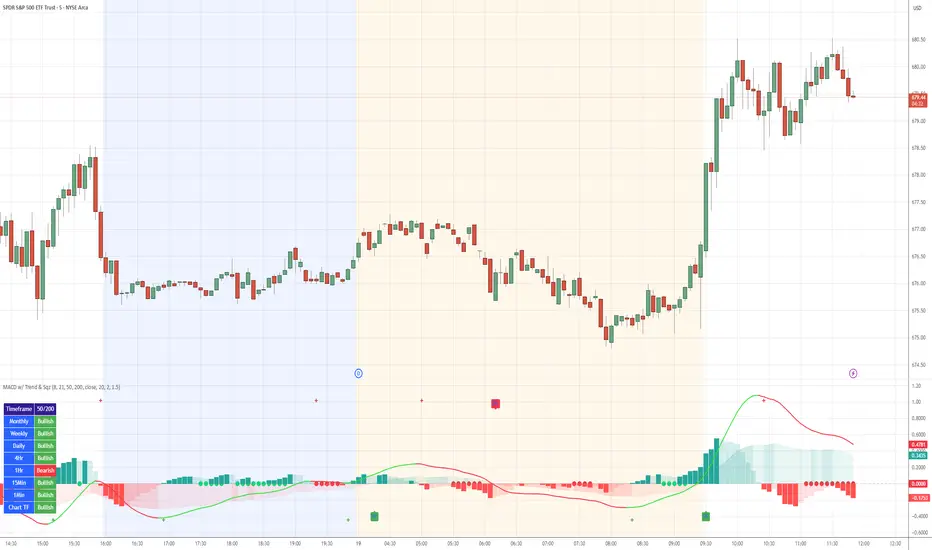
It integrates both a standard MACD (fast/slow lengths of your choice) and a Trend MACD (longer lengths). The standard MACD identifies short-term momentum shifts, while the Trend MACD helps confirm the higher-level market trend.
Multi-Timeframe 50/200 SMA Overview:
A built-in dashboard quickly shows whether the 50-period moving average is above or below the 200-period moving average across multiple timeframes (Monthly, Weekly, Daily, etc.). At a glance, you can see if higher timeframes agree with your immediate trading setup.
Clear Buy/Sell Signals:
The script plots buy arrows when the MACD histogram crosses from negative to positive, plus an additional label for the Trend MACD crossing. The same goes for sell signals if momentum flips from positive to negative. This clarity can reduce guesswork.
Customizable & Intuitive:
Easily adjust moving average types (SMA or EMA), lengths, and source inputs to suit different asset classes or personal preferences. Visual color coding helps you quickly interpret bullish vs. bearish conditions.
Recommended Trading Approach
Identify Overall Trend
Check the Trend MACD histogram and the multi-timeframe dashboard (50/200 SMAs). If you see bullish alignment on higher timeframes (e.g., Daily, Weekly) and the Trend MACD is above zero, you know the market environment is supportive for long trades.
Pinpoint Entry Using Standard MACD
Wait for the standard MACD histogram to cross above zero or for a labeled “Buy Signal.” This indicates short-term momentum turning bullish in sync with the broader trend. If the market is already trending up (confirmed by the dashboard), the probability of a successful long entry often improves.
Set a Stop-Loss & Take-Profit
While not included in the code, adding an ATR- or price-based stop-loss can protect against sudden reversals. A simple approach is risking 1–2% per trade and aiming for a 1.5–2× reward relative to that risk.
Monitor Sell Signals
If the short-term MACD crosses below zero—triggering a “Sell Signal”—and the Trend MACD also turns down (or the dashboard flips bearish), consider exiting the position or tightening stops. This alignment of short- and long-term indicators often signals a shift in momentum that could threaten your open profits.
Summary
The MACD with Trend & Multi-Timeframe Dashboard is a versatile, all-in-one toolkit. It combines the immediacy of short-term MACD signals, the validation of a longer-term trend oscillator, and the broader insight of multi-timeframe moving averages. Whether you are a swing trader looking for alignment across bigger trends or a shorter-term trader wanting clear momentum triggers, this indicator helps streamline decision-making and reduce noise.
Disclaimer: As with all technical analysis tools, there is no guarantee of success. Always combine indicator signals with sound risk management and a thorough understanding of market conditions
"macd" için komut dosyalarını ara
OsMAOsMA : Oscillator of Moving Averages.
OsMA is a common index because it is a histogram in the middle of MACD.
The histogram in the middle is a little difficult to handle, so I dared to display OsMA like MACD.
The one like MACD is OsMA, and the histogram in the middle is the amount of change in OSMA.
It is an indicator that is characterized by a strong and quick reaction.
OsMAとはMACDの真ん中のヒストグラムなのでありふれた指標です
真ん中のヒストグラムだけではちょっと扱い辛いので、あえてOsMAをMACDみたいに表示してみました
MACDみたいなやつがOsMAで、真ん中のヒストグラムはOSMAの変化量です
強烈に反応が早いのが特徴のインジケーターです

Bar Color - Moving Average Convergence Divergence [nsen]The Pine Script you've provided creates a custom indicator that utilizes the MACD (Moving Average Convergence Divergence) and displays various outputs, such as bar color changes based on MACD signals, and a table of data from multiple timeframes. Here's a breakdown of how the script works:
1. Basic Settings (Input)
• The script defines several user-configurable parameters, such as the MACD values, bar colors, the length of the EMA (Exponential Moving Average) periods, and signal smoothing.
• Users can also choose timeframes to analyze the MACD values, like 5 minutes, 15 minutes, 1 hour, 4 hours, and 1 day.
2. MACD Calculation
• It uses the EMA of the close price to calculate the MACD value, with fast_length and slow_length representing the fast and slow periods. The signal_length is used to calculate the Signal Line.
• The MACD value is the difference between the fast and slow EMA, and the Signal Line is the EMA of the MACD.
• The Histogram is the difference between the MACD and the Signal Line.
3. Plotting the Histogram
• The Histogram values are plotted with colors that change based on the value. If the Histogram is positive (rising), it is colored differently than if it's negative (falling). The colors are determined by the user inputs, for example, green for bullish (positive) signals and red for bearish (negative) signals.
4. Bar Coloring
• The bar color changes based on the MACD's bullish or bearish signal. If the MACD is bullish (MACD > Signal), the bar color will change to the color defined for bullish signals, and if it's bearish (MACD < Signal), the bar color will change to the color defined for bearish signals.
5. Multi-Timeframe Data Table
• The script includes a table displaying the MACD trend for different timeframes (e.g., 5m, 15m, 1h, 4h, 1d).
• Each timeframe will show a colored indicator: green (🟩) for bullish and red (🟥) for bearish, with the background color changing based on the trend.
6. Alerts
• The script has alert conditions to notify the user when the MACD shows a bullish or bearish entry:
• Bullish Entry: When the MACD turns bullish (crosses above the Signal Line).
• Bearish Entry: When the MACD turns bearish (crosses below the Signal Line).
• Alerts are triggered with custom messages such as "🟩 MACD Bullish Entry" and "🟥 MACD Bearish Entry."
Key Features:
• Customizable Inputs: Users can adjust the MACD settings, histogram colors, and timeframe options.
• Visual Feedback: The color changes of the histogram and bars provide instant visual cues for bullish or bearish trends.
• Multi-Timeframe Analysis: The table shows the MACD trend across multiple timeframes, helping traders monitor trends in different timeframes.
• Alert Conditions: Alerts notify users when key MACD crossovers occur.

faiz MACDMACD: Moving Average Convergence Divergence
The Moving Average Convergence Divergence (MACD) is a popular momentum indicator used in technical analysis to gauge the strength, direction, and potential reversal points of a trend in a financial asset's price movement. Developed by Gerald Appel in the late 1970s, MACD is particularly favored by traders for its ability to capture both trend-following and momentum aspects of price behavior.
Components of the MACD
The MACD is derived from two exponential moving averages (EMAs) of a security's price:
MACD Line: This is the difference between the 12-day and 26-day EMAs. The shorter 12-day EMA reacts more quickly to price changes, while the 26-day EMA smooths out price fluctuations, offering a longer-term perspective.
Formula: MACD Line = 12-day EMA - 26-day EMA
Signal Line: This is the 1-day EMA of the MACD Line itself. The signal line is used to generate buy and sell signals when it crosses the MACD line.
Formula: Signal Line = 1-day EMA of the MACD Line
MACD Histogram: The histogram represents the difference between the MACD Line and the Signal Line. It is displayed as bars that oscillate above and below a zero line, helping to visualize the convergence or divergence between the two lines.
Formula: Histogram = MACD Line - Signal Line
Interpretation of MACD
The MACD indicator is used to identify potential buy and sell signals based on the following observations:
MACD Line and Signal Line Crossovers:
Bullish Crossover: A buy signal occurs when the MACD Line crosses above the Signal Line. This suggests that the momentum is shifting in favor of the bulls, indicating a potential upward price movement.
Bearish Crossover: A sell signal occurs when the MACD Line crosses below the Signal Line. This suggests a bearish trend may be emerging, signaling a potential downward movement.
Divergence:
Bullish Divergence: Occurs when the price of the asset is making new lows, but the MACD is forming higher lows. This suggests that the downward momentum is weakening and a potential reversal to the upside may be imminent.
Bearish Divergence: Occurs when the price is making new highs, but the MACD is forming lower highs. This suggests that the upward momentum is weakening and a reversal to the downside may occur.
Only use it in timeframe m1, and solely use for XAUUSD pair.
Advisable to use it as a confirmation with other indicator such as
BBMA, SMC, SUPPORT RESISTANCE, SUPPLY AND DEMAND.
how to use :
MA 5 Crossing above MA9, will generate BUY signals
MA 5 Crossing below MA9, will generate SELL signals
Trade at your own SKILLS.
I dont mind people using this script for free.
All I want is just prayer for me and my family success.
Thank You and Have a nice and pleasant day :-)

MACD with SAR Indicator [CHE] MACD with SAR Indicator
Introduction
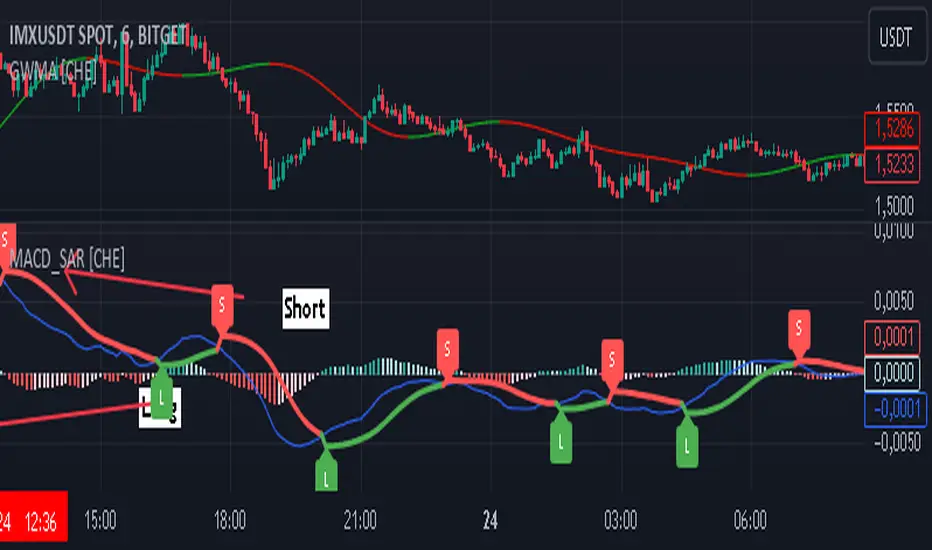
"The whole is greater than the sum of its parts. " The "MACD with SAR Indicator" is an innovative technical analysis tool that combines the strengths of the Moving Average Convergence Divergence (MACD) indicator with the Parabolic Stop and Reverse (SAR) indicator. This indicator provides traders with an enhanced method to detect trend changes and determine optimal entry and exit points in the market by using the SAR based on the MACD line to better identify reversal points. The combination generates clear trend reversal signals, which are visually represented through long (L) and short (S) signals on the chart.
Originality and Usefulness
This indicator differs from traditional MACD or SAR indicators by combining the trend-following calculations of the SAR with the trend strength and momentum calculations of the MACD. This enables a more precise identification of trend changes and provides clear buy and sell signals, which is particularly useful for manual traders.
Key Features and Functionality
1. Combination of MACD and SAR
- Why this Combination?: The MACD is known for its ability to measure the strength and direction of a trend, while the SAR is specifically designed to identify reversal points. By combining these two indicators, traders can better understand both the trend strength and potential turning points in the market.
- How Components Work Together: The MACD measures the difference between fast and slow moving averages, indicating market momentum. The SAR follows the MACD line instead of the price and marks potential reversal points more accurately. When the MACD signals a new trend and the SAR confirms it, the indicator provides reliable trading opportunities.
2. Adjustable Parameters
- MACD Settings: Users can adjust the lengths of the fast and slow moving averages (default: 28 and 38 periods) and the signal smoothing (default: 9 periods) to tailor the indicator to different market conditions.
- SAR Settings: Users can adjust the start value (default: 0.01), increment (default: 0.01), and maximum value (default: 0.18) of the SAR to control sensitivity and responsiveness.
3. Visual Representation and Signals
- Color-Coded Histograms: The histogram shows the difference between the MACD and signal line and is color-coded to highlight the direction of the trend.
- Signal Labels: The indicator automatically adds "L" (Long) and "S" (Short) labels on the chart to show the current positions to traders.
4. Alert Settings
- Custom Alerts: Alerts can be set to notify traders when the MACD and SAR experience significant state changes, such as when the histogram switches from rising to falling or vice versa.
5. Toggle Display
- Display Mode: Users can toggle the display of the MACD_SAR oscillator and MACD to focus on the information most relevant to their trading strategy.
Application and Benefits
- Versatility: This indicator can be used in various market conditions and for different trading strategies, including trend following and reversal trading.
- Ease of Interpretation: The clear visual representation and automatic signals make it easier for traders to identify trading opportunities and track trends.
- Customizability: With numerous settings options, the indicator can be tailored to individual preferences and specific market conditions.
Conclusion
The "MACD with SAR Indicator" is a valuable tool for traders seeking precise and reliable signals to identify market trends and make profitable trading decisions. With its extensive customization options, powerful features, and the ability to toggle displays, this indicator provides excellent support for technical analysis.
By emphasizing the synergy between the MACD and SAR indicators, highlighting the default settings, and clarifying that the SAR is based on the MACD line and generates clear trend reversal signals through long and short labels, this revised description should help users understand the functionalities and advantages of your indicator while meeting TradingView's publication requirements.
Best regards Chervolino
Ta StrategyHello guys
This script follows traditional technical indicators
MACD, ADX, RSI and pivot points
If the price is above the resistance and the MACD has crossover ,and the RSI 14 is above 50
ADX is higher than 20, and DI+ is higher than DI-. This is a buy signal and vice versa for a sell signal
The script moves the stop loss to the entry price after the first target is reached
You can specify the quantity you want to sell when the price reaches the first target
There are also options like if you want the script to entry long or short, or both
you can reverse the strategy if it does not work well
If you want to inquire about any details, please let me know in the comments

CoffeeShopCrypto 3pl MAThe CoffeeShopCrypto 3pl MA indicator is a technical analysis tool that uses three different moving averages to identify trends in the price of an asset. The three moving averages have lengths of 12, 26, and 50. If these numbers sound familiar its because they are based off the standard of the MACD indicator, and can be either simple moving averages (SMA) or exponential moving averages (EMA), depending on user preference.
The following is plotted on the chart
The fast EMA/SMA (based on the 12-period length) in yellow.
The mid EMA/SMA (based on the 26-period length) in gray.
The slow EMA/SMA (based on the 50-period length) in either green or red, depending on whether the current close price is above or below the Overall Trend MA.
In addition to the moving averages, the indicator also calculates the MACD (Moving Average Convergence Divergence), and uses it to color the bars based on the momentum of the asset.
The MACD is calculated using two user-defined lengths (fast and slow), as well as a user-defined smoothing length for the signal line. The oscillator and signal line can be either SMA or EMA, and the colors of the MACD bars are based on whether the histogram is growing or falling, and whether it is above or below the zero line.
Overall, this indicator provides traders with a comprehensive tool for understanding the trend of an asset, as well as the momentum behind that trend. The moving averages provide a clear visual representation of the trend, while the MACD bars give insight into the strength of that trend and potential shifts in momentum.
---------------LONG ENTRY----------------
MA1 above MA2 and Overall trend = Green
IF RSI is above its midline you are confirmed for a long entry
-----------Short Entry--------------
MA1 below MA2 and Overall trend = Red
IF RSI is below its midline you are confirmed for a short entry

Indicator: Schaff Trend Cycle (STC)Another new indicator for TV community :)
STC detects up and down trends long before the MACD. It does this by using the same exponential moving averages (EMAs), but adds a cycle component to factor instrument cycle trends. STC gives more accuracy and reliability than the MACD.
More info: www.investopedia.com
Feel free to "Make mine" this chart and use the indicator in your charts. Appreciate any feedback on how effective this is for your instrument (I have tested this only with BTC).
For people trading BTC:
-------------------------------
Try 3/10 or 9/30 for MACD (fastLength/slowLength). They seem to catch the cycles better than the defaults. :)

Mean Reversion [SIMI]This mean reversion indicator identifies extreme price deviations from the mean, providing high-probability reversal signals. Designed for confluence-based trading, it works best when combined with complementary indicators such as VWAP, price action, and volume analysis.
📊 Core Features
Signal Types
Prime Signals (Bright Green/Red Dots): Extreme reversions usually beyond ±1.5 SD - highest probability setups (you can customise this zone!)
Regular Signals (Dark Green/Red Dots): Standard reversions - moderate probability
Leader Line (Pink Dotted): Early warning indicator for potential reversals
Histogram Weakness: Momentum divergence signals
Normalisation Methods:
Institutional Hybrid (Z-ATR) (Recommended): Volatility-adjusted Z-score - adapts to changing market conditions
Percentile Ranking: Statistical ranking - excellent for ranging markets
PPO + ATR Hybrid: Percentage-based with volatility adjustment
Efficiency Ratio: Trend-strength weighted
ATR: Pure volatility-based
None: Raw Z-score
⚙️ Quick Setup Guide
1. Institutional Presets
Pre-configured parameter sets optimised for different timeframes:
5M Day Trading (5/21/5): Intraday scalping
1H Options Trading (6/24/5): Options-focused setups
1D Monthly Cycle (5/20/5): Swing trading
2. Signal Filtering
Prime Thresholds: Adjust ±1.5 SD to control signal quality (tighter = fewer, higher quality, adjust this zone per asset traded)
Dot Filters: Fine-tune entry zones (-0.03/+0.03 default - this ignores noisy signals near Zero line)
Volume Filter: Enable to require volume confirmation (1.4x average recommended, but fine tune yourself)
3. Advanced Filters
Dynamic SD Thresholds: Auto-adjusts for volatility regimes (tighter in low vol, wider in high vol)
Time of Day Filter: Avoids first 30 minutes, last 15 minutes, and lunch hour (11:30-13:00 EST)
💡 Trading Strategy Recommendations
Optimal Usage
This indicator is not intended as a standalone system. Use it for confluence alongside:
VWAP (institutional positioning)
Price action (support/resistance)
Options flow (institutional direction)
Volume analysis (conviction confirmation)
Signal Interpretation
Prime Signals: Wait for these for highest-probability entries - mean reversion may take hours to days
Manual Entries: Don't wait for dots - trade the ±2 SD zones directly using your own confirmation
Options Strategy: Prime sell signals at +2 SD make excellent short call setups; prime buy signals at -2 SD for long calls
Timeframe Guidance
Lower Timeframes (1M-5M): Higher noise - require additional confluence
Higher Timeframes (1H-1D): More reliable signals - suitable for options and swing trades
Best Results: Multi-timeframe analysis (check 1H and 4H alignment on 5M entries)
🔔 Alert System
Master Alert
Enable customisable alerts via the Master Alert System:
Toggle individual signal types (Prime Buy/Sell, SD Crosses, Leader, Histogram)
Receives bespoke messages with ticker, timeframe, and price
One alert condition handles all selected signals
Individual Alerts
Separate alert conditions available for Prime and Regular signals if preferred.
📈 Backtesting Notes
Important: Backtest results are date-sensitive and should not be the primary focus. Instead:
Dial in settings visually on your chosen asset
Aim for signals near actual tops and bottoms
Test different normalisation methods for your specific instrument
Optimise for signal quality, not backtest ROI
Asset Testing: Primarily developed using SPY, QQQ, and IWM as main assets to trade. Other instruments may require parameter adjustment - mess around!
Backtest Engine
Entry/Exit modes (All Signals, Prime Only, Early Signals)
Position sizing (percentage-based)
Slippage and fill method (candle close recommended)
Date range selection
⚠️ Best Practices
Always use confluence - never trade on MR signals alone
Start with Institutional Hybrid normalisation - most adaptive to market conditions
Focus on Prime signals for quality over quantity
Test on your specific asset - optimal settings vary by instrument
Longer timeframes = higher reliability - 1H+ for best results
Enable Time Filter on intraday charts to avoid volatile periods
Use Dynamic SD in highly volatile markets (earnings, FOMC, etc.)
🛠️ Troubleshooting
Too many signals: Increase Prime Thresholds or enable Volume Filter
Too few signals: Decrease Prime Thresholds or reduce Dot Filters
False signals: Enable Time of Day Filter and Dynamic SD
Signals don't align with tops/bottoms: Try different normalisation method
📝 Feedback & Development
Bug Reports: Please report any issues via TradingView comments or direct message.
Strategy Sharing: I'd love to hear how you're using this indicator and what strategies you've developed.
Open Source: Feel free to fork and modify this indicator. If you create an improved version, please share it with the community!
🙏 Acknowledgements
Developed through AI-assisted collaboration.
Special thanks to Lazy Bear for his open source MACD histogram (volume based).
Open source forever - use freely, modify, and share.
Happy Trading!
Remember: Past performance does not guarantee future results. Always manage risk appropriately.
Pandas rock \m/

REMS - Deep SynergyThis is a more flexible version of the REMS Synergy indicator. Like other indicators in the REMS family, it builds upon the foundations assessing the relationships between RSI, EMAs, MACDs, and Stochastic RSI across multiple timeframes. Designed to help traders identify less frequent, but high probability entries across 2 time frames. Uses 3 levels of confluence indicators for both long and short moves.
Features 3 levels of confluence across 2 timeframes. All 3 levels allow filtering of any combination of REMS filters. Features more options and customization than previous REMS Synergy.
Includes VWAP and 4 EMAs as optional visual representations.
Includes 'Enhanced Candles' than can colour code candlesticks for better visual identification. (off by default)
Originally designed with 5 minute and 2 minute timeframes in mind, and pairs well with REMS First Strike and/or REMS Snap Shot indicators.
This version features no hard-coded inputs and allows for more freedom than previous version. With the added flexibility comes the ability for the indicator to be more easily stacked.

Macd, Wt Cross & HVPMacd Wt Cross & HVP – Advanced Multi-Signal Indicator
This script is a custom-designed multi-signal indicator that brings together three proven concepts to provide a complete view of market momentum, reversals, and volatility build-ups. It is built for traders who want to anticipate key market moves, not just react to them.
Why This Combination ?
While each tool has its strengths, their combined use creates powerful signal confluence.
Instead of juggling multiple indicators separately, this script synchronizes three key perspectives into a single, intuitive display—helping you trade with greater clarity and confidence.
1. MACD Histogram – Momentum and Trend Clarity
At the core of the indicator is the MACD histogram, calculated as the difference between two exponential moving averages (EMAs).
Color-coded bars represent momentum direction and intensity:
Green / blue bars: bullish momentum
Red / pink bars: bearish momentum
Color intensity shows acceleration or weakening of trend.
This visual makes it easy to detect trend shifts and momentum divergence at a glance.
2. WT Cross Signals – Early Reversal Detection
Overlaid on the histogram are green and red dots, based on the logic of the WaveTrend oscillator cross:
Green dots = potential bullish cross (buy signal)
Red dots = potential bearish cross (sell signal)
These signals are helpful for identifying reversal points during both trending and ranging phases.
3. Historical Volatility Percentile (HVP) – Volatility Compression Zones
Behind the histogram, purple vertical zones highlight periods of low historical volatility, based on the HVP:
When volatility compresses below a specific threshold, these zones appear.
Such periods are often followed by explosive price moves, making them prime areas for pre-breakout positioning.
By integrating HVP, the script doesn’t just tell you where the trend is—it tells you when the trend is likely to erupt.
How to Use This Script
Use the MACD histogram to confirm the dominant trend and its strength.
Watch for WT Cross dots as potential entry/exit signals in alignment or divergence with the MACD.
Monitor HVP purple zones as warnings of incoming volatility expansions—ideal moments to prepare for breakout trades.
Best results occur when all three elements align, offering a high-probability trade setup.
What Makes This Script Original?
Unlike many mashups, this script was not created by simply merging indicators. Each component was carefully integrated to serve a specific, complementary purpose:
MACD detects directional bias
WT Cross adds precision timing
HVP anticipates volatility-based breakout timing
This results in a strategic tool for traders, useful on multiple timeframes and adaptable to different trading styles (trend-following, breakout, swing).

MACD [AlchimistOfCrypto]🌠 MACD Optimized with Python – Decoding the Chaos of Markets 🌠
Category: Trend Analysis 📈
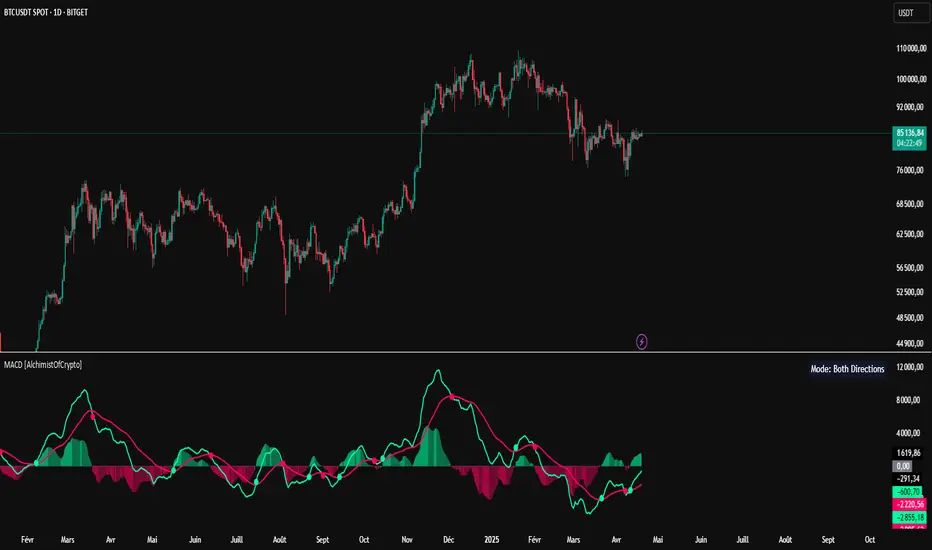
"Like the dynamic systems studied in chaos theory, financial markets appear unpredictable at first glance. Yet, as Edward Lorenz demonstrated, even in apparent chaos reside harmonious mathematical structures. The MACD (Moving Average Convergence Divergence) represents this quest for order within disorder—a mathematical formulation that extracts coherent signals from price noise. By combining moving averages of different periods, this indicator reveals hidden cycles and precise moments when market energy shifts, like a pendulum obeying the immutable laws of physics."
📊 Technical Overview
The MACD Optimized with Python is a revolutionary take on the classic Moving Average Convergence Divergence indicator. Powered by Python-driven optimizations 🐍, it adapts to specific timeframes, delivering razor-sharp signals for traders seeking to navigate the market’s chaos with precision.
⚙️ How It Works
- Python-Optimized Parameters 🔧: Unlike the standard MACD (12,26,9), our version uses mathematically tailored parameters for each timeframe:
- 1H: 11/38/27
- 4H: 9/98/27
- 1D: 45/90/29
- 1W: 9/16/3
- 2W: 5/20/5
- Intuitive Visuals 🎨:
- Crossovers marked by colored dots 🟢🔴 for clear entry/exit signals.
- Histogram with a color gradient 🌈 to show direction and momentum intensity.
- Customizable Signals 🎯: Choose to display long, short, or both signals to match your trading style.
🚀 How to Use This Indicator
1. Select Your Timeframe ⏰: Choose the timeframe aligned with your trading horizon (1H, 4H, 1D, 1W, or 2W).
2. Spot Crossovers 🔍: Watch for the MACD line (green) crossing the signal line (red) to identify potential trend changes.
3. Confirm with Divergence ✅: Combine crossovers with price-MACD divergence for high-probability trend reversal signals.
📅 Release Notes
Unlock the hidden order of markets with this Python-optimized MACD. Stay tuned for future enhancements! ✨
🏷️ Tags
#Trading #TechnicalAnalysis #MACD #TrendAnalysis #Python #MultiTimeframe #Divergence #Momentum #TradingStrategy #RiskManagement #Forex #Stocks #Crypto #ChaosTheory #OptimizedTrading
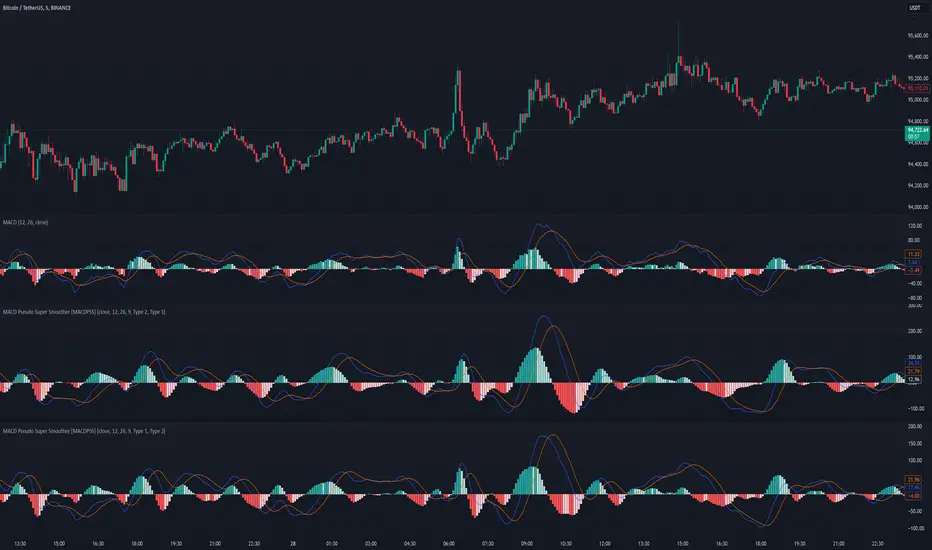
MACD Pseudo Super Smoother [MACDPSS]The MACD Pseudo Super Smoother (MACDPSS) is a variation of the classic Moving Average Convergence Divergence (MACD) indicator. It utilizes the Pseudo Super Smoother (PSS) filter, a Finite Impulse Response (FIR) filter, to smooth both the MACD line and the signal line, providing a potentially refined representation of momentum compared to the traditional MACD which typically uses Exponential Moving Averages (EMAs).
The PSS, inspired by the Super Smoother filter (an Infinite Impulse Response (IIR) filter), aims to reduce noise while minimizing lag. The MACDPSS leverages this FIR implementation to create a unique MACD variant. The core concept of MACD, which involves analyzing the relationship between two moving averages of different lengths to identify momentum shifts, remains intact.
Filter Types and Customization
The MACDPSS offers independent control over the smoothing applied to the MACD line and the signal line through two "Filter Style" inputs:
Oscillator MA Type: This setting determines the filter type used to calculate the fast and slow moving averages that form the basis of the MACD line.
Signal Line MA Type: This setting controls the filter type used to smooth the MACD line, generating the signal line.
Each of these settings allows a choice between two distinct PSS filter types:
Type 1: Provides a smoother output with a more gradual response, characterized by greater attenuation of high-frequency components.
Type 2: Exhibits increased reactivity, allowing for a faster response to shifts in momentum, but with a potential for overshoot.
This dual-filter approach provides flexibility in tailoring the indicator's responsiveness and smoothness to individual preferences and specific market conditions. The user can, for example, choose a smoother Type 1 filter for the MACD line and a more reactive Type 2 filter for the signal line, or vice-versa.
Calculations
The MACDPSS calculates the MACD line by subtracting the slow moving average from the fast moving average, both derived using the PSS filter with the selected "Oscillator MA Type." The signal line is then calculated by applying the PSS filter with the selected "Signal Line MA Type" to the MACD line. The histogram represents the difference between the MACD line and the signal line.
Interpretation
The interpretation of the MACDPSS is similar to the standard MACD. Crossovers between the MACD line and the signal line, the position of the MACD line relative to the zero line, and the slope and direction of the histogram are all used to gauge momentum and potential trend changes.
Disclaimer
The MACDPSS, while inspired by the Super Smoother, utilizes a distinct FIR approximation (the PSS). Therefore, its behavior will not perfectly mirror that of a MACD calculated using IIR filters. The PSS is designed to be a rough approximation. This indicator should be used in conjunction with other technical analysis tools, and users should be aware of the inherent differences between FIR and IIR filter characteristics when interpreting the indicator's signals. Like any moving average based indicator, the MACDPSS is a lagging indicator, although it tries to improve it. The novelty of this indicator comes from applying a unique FIR filter to a classic momentum oscillator in a configurable way.
Indicator DashboardThis script creates an 'Indicator Dashboard' designed to assist you in analyzing financial markets and making informed decisions. The indicator provides a summary of current market conditions by presenting various technical analysis indicators in a table format. The dashboard evaluates popular indicators such as Moving Averages, RSI, MACD, and Stochastic RSI. Below, we'll explain each part of this script in detail and its purpose:
### Overview of Indicators
1. **Moving Averages (MA)**:
- This indicator calculates Simple Moving Averages (“SMA”) for 5, 14, 20, 50, 100, and 200 periods. These averages provide a visual summary of price movements. Depending on whether the price is above or below the moving average, it determines the market direction as either “Bullish” or “Bearish.”
2. **RSI (Relative Strength Index)**:
- The RSI helps identify overbought or oversold market conditions. Here, the RSI is calculated for a 14-period window, and this value is displayed in the table. Additionally, the 14-period moving average of the RSI is also included.
3. **MACD (Moving Average Convergence Divergence)**:
- The MACD indicator is used to determine trend strength and potential reversals. This script calculates the MACD line, signal line, and histogram. The MACD condition (“Bullish,” “Bearish,” or “Neutral”) is displayed alongside the MACD and signal line values.
4. **Stochastic RSI**:
- Stochastic RSI is used to identify momentum changes in the market. The %K and %D lines are calculated to determine the market condition (“Bullish” or “Bearish”), which is displayed along with the calculated values for %K and %D.
### Table Layout and Presentation
The dashboard is presented in a vertical table format in the top-right corner of the chart. The table contains two columns: “Indicator” and “Status,” summarizing the condition of each technical indicator.
- **Indicator Column**: Lists each of the indicators being tracked, such as SMA values, RSI, MACD, etc.
- **Status Column**: Displays the current status of each indicator, such as “Bullish,” “Bearish,” or specific values like the RSI or MACD.
The table also includes rounded indicator values for easier interpretation. This helps traders quickly assess market conditions and make informed decisions based on multiple indicators presented in a single location.
### Detailed Indicator Status Calculations
1. **SMA Status**: For each moving average (5, 14, 20, 50, 100, 200), the script checks if the current price is above or below the SMA. The status is determined as “Bullish” if the price is above the SMA and “Bearish” if below, with the value of the SMA also displayed.
2. **RSI and RSI Average**: The RSI value for a 14-period is displayed along with its 14-period SMA, which provides an average reading of the RSI to smooth out volatility.
3. **MACD Indicator**: The MACD line, signal line, and histogram are calculated using standard parameters (12, 26, 9). The status is shown as “Bullish” when the MACD line is above the signal line, and “Bearish” when it is below. The exact values for the MACD line, signal line, and histogram are also included.
4. **Stochastic RSI**: The %K and %D lines of the Stochastic RSI are used to determine the trend condition. If %K is greater than %D, the condition is “Bullish,” otherwise it is “Bearish.” The actual values of %K and %D are also displayed.
### Conclusion
The 'Indicator Dashboard' provides a comprehensive overview of multiple technical indicators in a single, easy-to-read table. This allows traders to quickly gauge market conditions and make more informed decisions. By consolidating key indicators like Moving Averages, RSI, MACD, and Stochastic RSI into one dashboard, it saves time and enhances the efficiency of technical analysis.
This script is particularly useful for traders who prefer a clean and organized overview of their favorite indicators without needing to plot each one individually on the chart. Instead, all the crucial information is available at a glance in a consolidated format.

Uptrick: Bullish/Bearish Signal DetectorDetailed Explanation of the "Uptrick: Bullish/Bearish Signal Detector" Script
The "Uptrick: Bullish/Bearish Signal Detector" script is a sophisticated tool designed for the TradingView platform, leveraging Pine Script version 5. This script is crafted to enhance traders' ability to identify bullish (buy) and bearish (sell) signals directly on their trading charts. By combining the power of the MACD (Moving Average Convergence Divergence) and RSI (Relative Strength Index) indicators, this script provides a unique and efficient method for detecting potential trading opportunities. Below is an in-depth exploration of its purpose, features, and functionality.
Purpose
The primary purpose of this script is to assist traders in identifying potential entry and exit points in the market by signaling bullish and bearish conditions. This automated detection helps traders make more informed decisions without the need to manually analyze complex indicators. By overlaying signals directly on the price chart, the script allows for quick visual identification of market trends and reversals.
Uniqueness
What sets this script apart is its dual use of MACD and RSI indicators. While many trading strategies might rely on a single indicator, combining MACD and RSI enhances the reliability of the signals by filtering out false positives. The script not only identifies trends but also adds a layer of confirmation through the RSI, which measures the speed and change of price movements.
Inputs and Features
Customizable Label Appearance:
The script allows users to customize the appearance of the labels that indicate bullish and bearish signals. Users can set their preferred colors for the labels and the text, ensuring that the signals are easily distinguishable and aesthetically pleasing on their charts.
MACD Calculation:
The script calculates the MACD line and signal line using user-defined input values for the fast length, slow length, and signal length. The MACD histogram, which is the difference between the MACD line and the signal line, is used to determine the momentum of the market.
RSI Calculation:
The RSI is calculated using a user-defined input length. The RSI helps in identifying overbought or oversold conditions, which are crucial for confirming the strength of the trend detected by the MACD.
Bullish and Bearish Conditions:
The script defines bullish conditions as those where the MACD histogram is positive and the RSI is above 50. Bearish conditions are defined where the MACD histogram is negative and the RSI is below 50. This combination of conditions ensures that signals are generated based on both momentum and relative strength, reducing the likelihood of false signals.
Label Plotting:
The script plots labels on the chart to indicate bullish and bearish signals. When a bullish condition is met, and the previous signal was not bullish, a "LONG" label is plotted. Similarly, when a bearish condition is met, and the previous signal was not bearish, a "SHORT" label is plotted. This feature helps in clearly marking the points of interest for traders, making it easier to spot potential trades.
Tracking Previous Signals:
To avoid repetitive signals, the script keeps track of the last signal. If the last signal was bullish, it avoids plotting another bullish signal immediately. The same logic applies to bearish signals. This tracking ensures that signals are spaced out and only significant changes in market conditions are highlighted.
How It Works
The script operates in a loop, processing each bar (or candlestick) on the chart as new data comes in. It calculates the MACD and RSI values for each bar and checks if the current conditions meet the criteria for a bullish or bearish signal. If a signal is detected and it is different from the last signal, a label is plotted on the chart at the current bar's price level. This real-time processing allows traders to see the signals as they form, providing timely insights into market movements.
Practical Application
For practical use, a trader would add this script to their TradingView chart. They can customize the input parameters for the MACD and RSI calculations to fit their trading strategy or preferred settings. Once added, the script will automatically analyze the price data and start plotting "LONG" and "SHORT" labels based on the detected signals. Traders can then use these labels to make decisions on entering or exiting trades, adjusting their strategy as necessary based on the signals provided.
Conclusion
The "Uptrick: Bullish/Bearish Signal Detector" script is a powerful tool for any trader looking to leverage technical indicators for better trading decisions. By combining MACD and RSI, it offers a robust method for detecting market trends and potential reversals. The customizable features and real-time signal plotting make it a versatile and user-friendly addition to any trading toolkit. This script not only simplifies the process of technical analysis but also enhances the accuracy of trading signals, thereby potentially increasing the trader's success rate in the market.

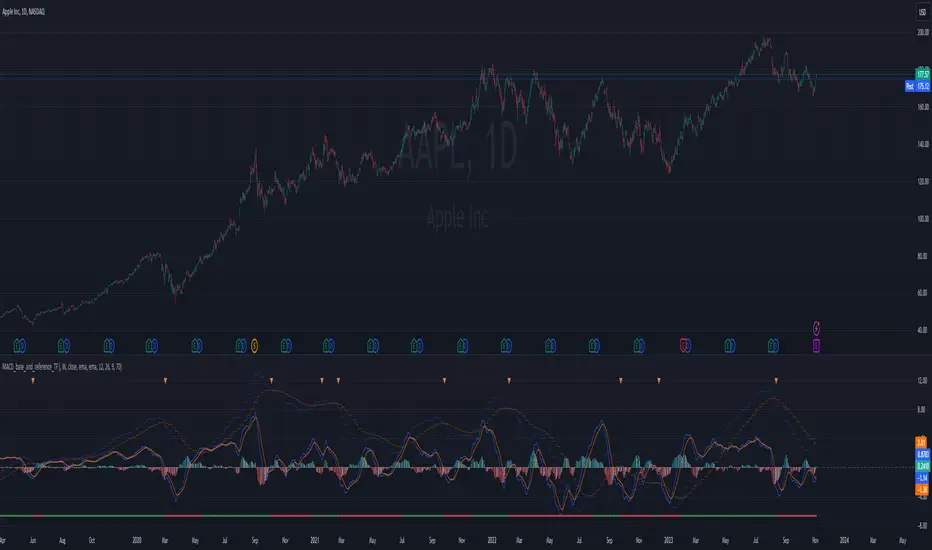
MACD_base_and_reference_TF//====================================================================================================================
The "MACD_with_reference" indicator aims to illustrate the MACD (Moving Average Convergence Divergence) on two distinct timeframes: the base timeframe (typically the chart's timeframe, e.g., 1D) and the reference timeframe (defaulted to 1W). This tool provides a means to determine momentum shifts within the stock, potentially guiding traders in adjusting or trimming positions.
// ================================================== INFO ==================================================
Key Features of the Indicator:
- Dual Timeframe MACD: Displays MACD on both the primary (base) and higher (reference) timeframes - transparent.
- Momentum Analysis: indication of MACD crossdown of the signal line on the refenence TF to indicate momentum loss on the higher timeframe, guiding decisions to manage positions.
- MACD Line Status: Beneath the chart, a red/green bar line signifies the MACD line's position relative to the signal line on the higher timeframe.
- Alert Creation: Allows for alerts on the MACD and signal line crossdown on the higher timeframe, aiding in planning stop-loss settings for owned stocks.
// ================================================== NOTES ==================================================
The "MACD_with_reference" indicator finds optimal usage in several scenarios:
- Chart Analysis: Replacing the MACD indicator during chart reviews.
- Alert Setup: Setting alerts for owned stocks to plan ahead for stop-loss placements or position closures.
// ================================================== TODO ==================================================
//#endregion ========================================================================================================
// Continue the script code...
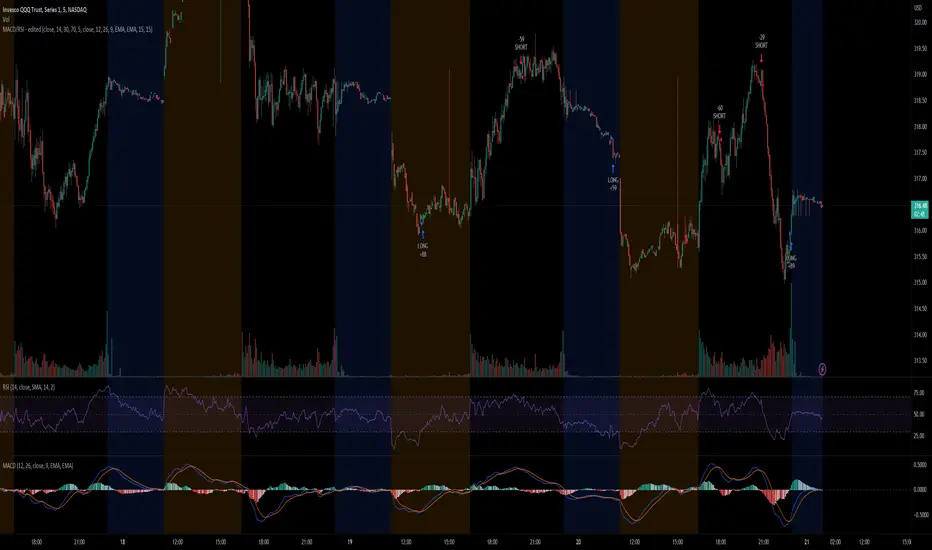
MACD/RSI - editedThis strategy checks MACDcrossover and RSI crossover. When MACD crosses up or down the signal line, it checks if RSI is crossing back OverSold or OverBought lines, respectively, over the past few candles. The period can be changed by the parameter "RSI lookback".
The strategy seems to work better for reversal—still a work in progress.
Volume Cross ━ (For Volume Crop) [whvntr]This fulfills a request from user: iTibu to make an oscillator to go along with one of my indicators named: " Volume Crop ━ Hidden Volume Divergence ". It essentially does the same thing, without the Midline Tool , so you can better understand where the crosses are happening. Again, the hidden MACD Divergence circles formula originated from TheLark. I converted these values to volume instead of price.
Disclaimer: using this indicator, or any indicator anywhere, involves risk when trading and isn't a guarantee of 100% accurate results.

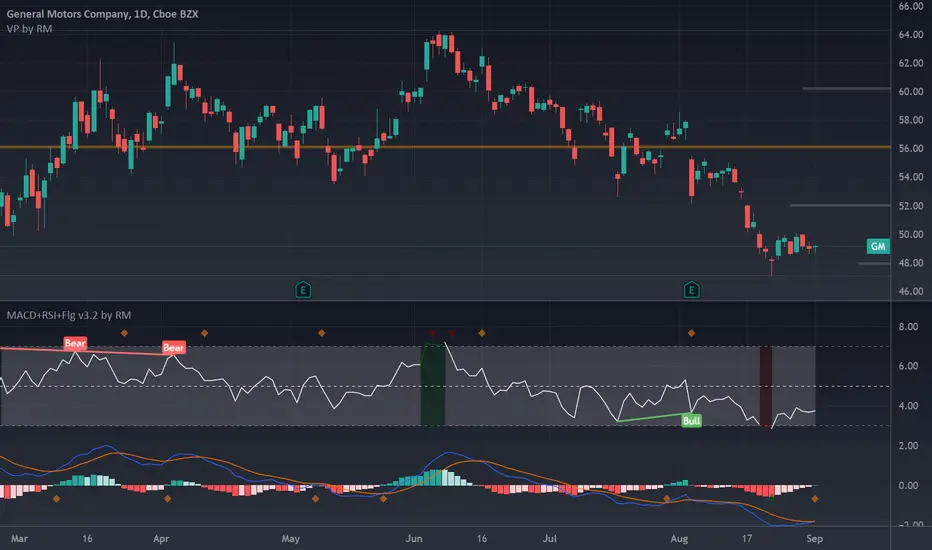
MACD+RSI+Flag v2 by RMThis source code is subject to the terms of the Mozilla Public License 2.0 at mozilla.org
There are a number of very clever people I have taken bits of code and ideas, thanks to you all :) © raul3429
www.investopedia.com
RSI: The relative strength index (RSI) is a momentum indicator measures recent price changes to evaluate overbought or oversold conditions.
MACD: Moving average convergence divergence (MACD) is a trend-following momentum indicator that shows the relationship between two moving averages of a security’s price. The MACD is = 12EMA - 26EMA, The histogram represent this difference.
Notes:
This code has Flags for first candle change during oversold/overbought shown as triangles, also and MACD 12 and MACD 26 crossings as diamonds. These are sometimes indicators of trend change.
RSI has been scaled down by "scaleRSI" parameter to enable plotting alongside MACD
Depending on the security being evaluated the RSI scale may need to be adjusted as the MACD ranges vary between symbols.
Disclaimer:
This is not a Financial advisory tool. For education purposes only. Use at your own risk.
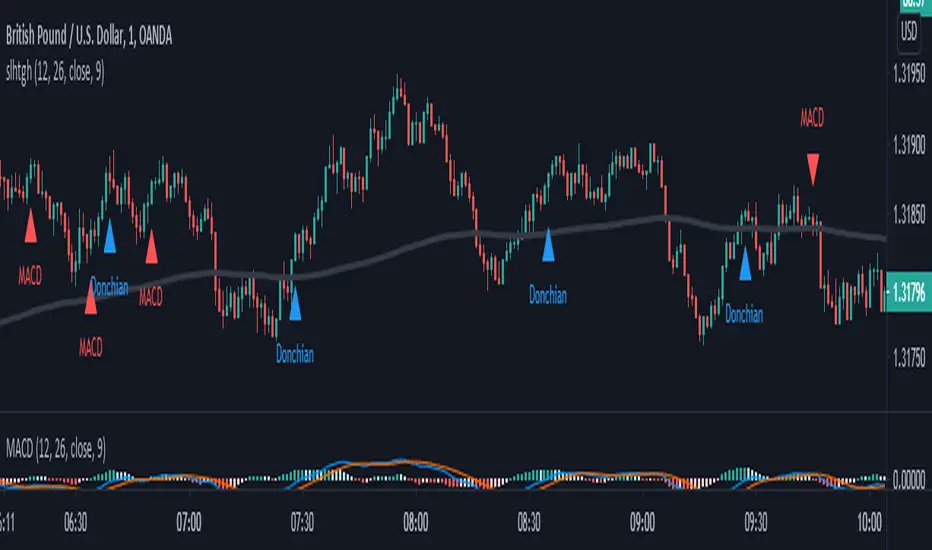
SALEH All in One Strategythis script is based on MACD strategy
for MACD:
when we have an uptrend ( the price is above the EMA 200) & the macd line cross up the signal line while they are both under the 0 level of histogram it generates buy signals.
when we have a downtrend ( the price is below the EMA 200) & the macd line cross below the signal line while they are both above the 0 level of histogram it generates sell signals.
donchian channel works as a confirmation for the macd signal.
this strategy works best at London session.
feel free to comment
best regards Forexsquad2020
MAC-Z [ChuckBanger]Here I show the relationship between the MACD and Z-Score in a indicator called MAC-Z. MACD is short for moving average convergence/divergence and is in it self showing the relationship between two EMA. The Z-Score in contrast is related to Bollinger Bands and in MAC-Z the Z-score is the difference between the current price and a moving average divided by the standard deviation of price over the same time period.
MAC-Z has its best use in the short term time frames in my opinion compared to MACD. Here i show from current time of writing how effective it is.
More info on MAC-Z:
cssanalytics.wordpress.com
Also take a look at MACD Leader:

MACD/EMA/SMA/Ichimoku Confluence StrategyThis strategy uses a number of chart indicators to provide a Bullish/Bearish signal. Using a combination of the 200 SMA, the 20 EMA, the MACD and the Ichimoku cloud, the strategy logic will adjust the amount of confluence required between the indicators depending on how bullish or bearish the chart is looking. The logic looks for the following:
- Are we above or below the 200 SMA?
- Are we above or below the 20 EMA?
- Have we had a bullish MACD cross?
- Where are we in relation to the Ichimoku cloud?
If the coin is below the 200 SMA, then the strategy will only give a buy signal if the coin closes a candle above the 20 EMA AND the MACD is bullish and either the Ichimoku cloud is green, or the coin is above the Ichimoku cloud (regardless of colour).
If the coin is above the 200 SMA, Then the strategy will give a buy signal if the coin closes a candle above the 20 EMA AND the MACD is bullish and the coin is either IN the cloud (not necessarily above it) or the cloud is green.
The reverse is true for a sell signal, i.e. when the coin is above the 200 SMA it must close a candle below the Ichimoku cloud and be bearish in relation to the 20 EMA and MACD. If it is below the 200 SMA, then the strategy will give a sell signal if the the EMA/MACD conditions are true and the coin enters the cloud.
This strategy gives a fairly conservative signal for entry and exit points, but is fairly successful across a number of time frames, both short term and long term. As with all my strategies, I only include LONG entries and closes, not SHORT entries (as I find they make for inaccurate backtesting).
Please feel free to like, share, critique and suggest any improvements to this strategy. All feedback, positive and negative, is appreciated.

MACD_Long_OnlyI created this indicator to calculate the gains that can be made purely by going long on the market. For exchanges without the ability to short, the standard MACD strategy is unable to accurately calculate the profit/loss from entering and exiting a position, as it includes profit/loss from actively shorting the market, which may either not be possible, or be undesirable for a specific asset.
