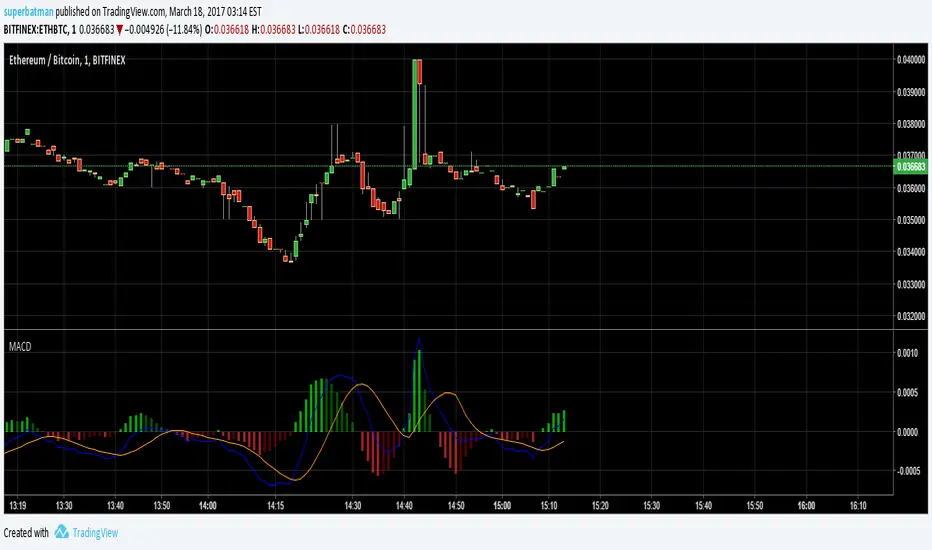
4 Hour MACD (Philip Nel ForexFactory)This is the basic script that shows MACD as described with settings in the thread www.forexfactory.com
Komut dosyalarını "macd" için ara

Hull MACD with Force Index Backcolorswww.tradingview.com
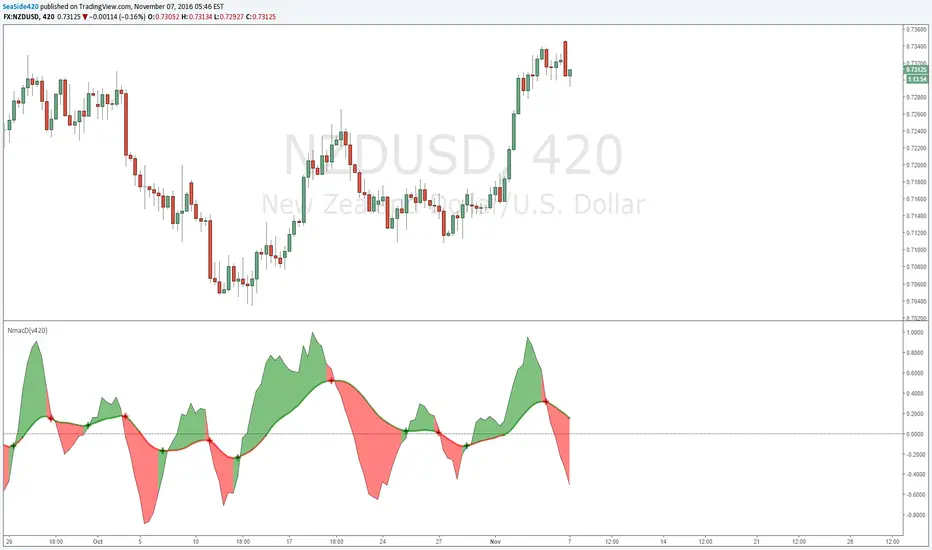
Like many other indicators this tells the past and it will dutifully follow the future price changes whatever they will be.
This is an upgrade of the "Hull Moving Average Convergence/Divergence" low lag indicator in my scripts. Added Elder Force Index (background colors) to include effects of Volume.
When EFI goes positive the background goes green, when it slopes up (more positive than previous bar) it is darker green. Negative red and slope down darker red.
I find it useful in all time frames but I use mostly hour and day. The direction color combined with price action and macd tell whether the volume supports the price movement and the shading (darker green for increasing up volume and darker red for increasing down volume) tells of the degree of support.
Since when the EFI is positive and dropping, for example, the price can be dropping with opposite for negative.
Dark shading tells where the EFI and possibly the price is headed (at the moment).
Light shading says to check more on other indications for likely direction.
Changed also the histogram color so it stands out of background and added hlines to make relative volatility and peak height easier to see.
Anyway help yourself if any of this code is useful to you, enjoy, happy trading and Keep Smiling!


Multi Timeframe MACDThis will show you the MACD (no Signal Line) of the higher timeframes (up to 4h). Current Timeframe is colored blue, higher timeframes are colored from light gray to darker gray (you can change that).

AK MACD BB INDICATOR V 1.00Here's my version of the MACD _BB . This is a great indicator to capture short term trends.
yellow candles = long
aqua candles = short
This indicator can be much better. I will work on it and publish an improved version (hopefully) soon. In the mean time , go ahead and play around with the code, and please share your findings :)
Cheers
Algo

MacD Custom Indicator-Multiple Time Frame+All Available Options!This MacD Indicator has every feature available. See First Post for Details.


MACDMACD
- Enhanced MACD
- Shows the MACD in a simple way, to facilitate its analysis
- Histogram mode and Normal mode
- MACD color depends on its values
- Candlestick same as MACD colors
- Calculate the MACD with EMA or SMA
- Allow to use the RSI Source for calculations
- Log chart option
MACD + RSI Signal ArrowsA small green arrow up (↑) when there's a buy signal
A small red arrow down (↓) when there's a sell signal


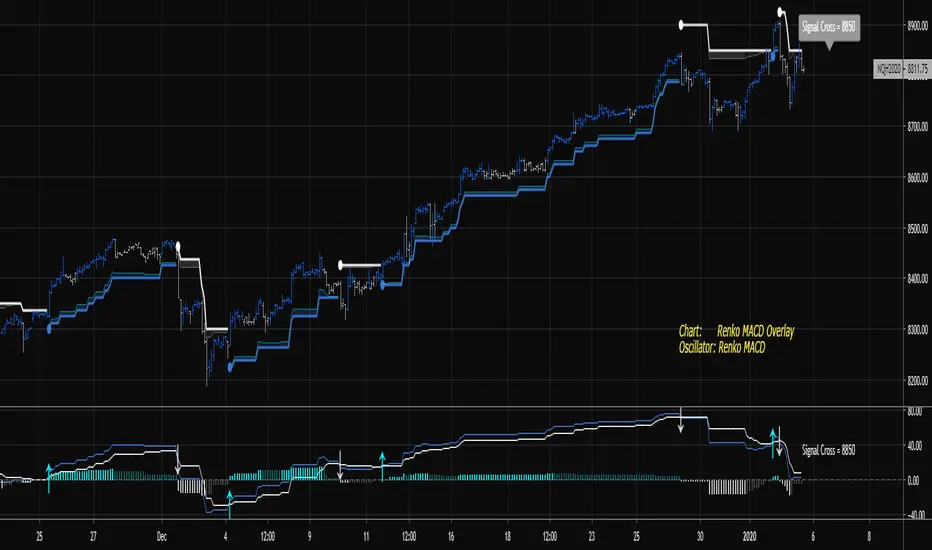
Renko MACDThe goal of this indicator is to plot the MACD, Signal, and Histogram values "as if" the chart is a true price action based Renko chart. It can be used on a time series chart or Renko series chart. The MACD is derived from the raw price action of a time-based chart, where the historic and live price is clustered into Renko bricks. The Renko brick production algorithm is entirely backed by Renko Overlay Ribbon and thoroughly tested.
The algorithm takes into account rapid brick production within a single time candle and adjusts accordingly. The output may vary slightly between different chart time frames for the same indicator settings, but this is due to the lack of price fluctuation visibility that can occur in higher chart time frames. If the brick tick size is low, an appropriate chart interval should be selected that maximizes the amount of price volatility visible to the indicator. A bad setting would be something like a 1 tick EURUSD Renko setting on an H4 or Day chart, there simply is no way to derive the exact and ordered price fluctuations in a single candle, 1 pip at a time. A more appropriate chart time frame would be 1-5 minutes for this selected Renko brick size.
Please find the following video introduction helpful for this indicator and the Renko MACD Trend indicator:
If you are interested in the RSI-RENKO DIVINE Strategy please have a look here:
Contact me in Trading View or telegram for more information and access instructions.
Telegram: t.me
Daily Edge: www.daily-edge.com

Renko MACD TrendThe goal of this indicator is to plot the MACD, Signal, and Histogram values "as if" the chart is a true price action based Renko chart. It can be used on a time series chart or Renko series chart. The MACD is derived from the raw price action of a time-based chart, where the historic and live price is clustered into Renko bricks. The Renko brick production algorithm is entirely backed by Renko Overlay Ribbon and thoroughly tested.
The algorithm takes into account rapid brick production within a single time candle and adjusts accordingly. The output may vary slightly between different chart time frames for the same indicator settings, but this is due to the lack of price fluctuation visibility that can occur in higher chart time frames. If the brick tick size is low, an appropriate chart interval should be selected that maximizes the amount of price volatility visible to the indicator. A bad setting would be something like a 1 tick EURUSD Renko setting on an H4 or Day chart, there simply is no way to derive the exact and ordered price fluctuations in a single candle, 1 pip at a time. A more appropriate chart time frame would be 1-5 minutes for this selected Renko brick size.
The difference between this indicator and the companion Renko MACD indicator can be understood in the following video. The indicator plots the current MACD - Signal cross and MACD - Zero cross thresholds on the chart so that you know exactly where the most important crossing values are at all times. This can be used as a dynamic stop or a dynamic entry location for trades.
If you are interested in the RSI-RENKO DIVINE Strategy please have a look here:
Contact me in Trading View or telegram for more information and access instructions.
Telegram: t.me
Daily Edge: www.daily-edge.com
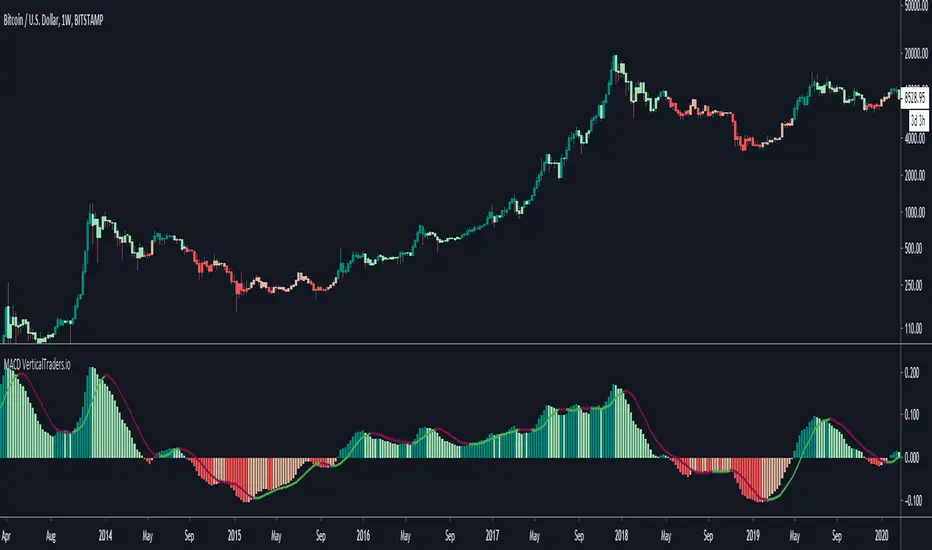
Moving Average Convergence/Divergence LineMACD Line instead of MACD histogram or area. This gives more opportunities to catch divergences.
I showed regular MACD Histogram on top and then this indicator on bottom and showed with the red and green lines where you could catch multiple bearish and bullish divergences using this indicator vs a regular MACD histogram.
Send me a private message to join my trading group.
Thank you.

E9 MACD
The E9 MACD (Moving Average Convergence Divergence) indicator is a powerful tool used in technical analysis to help traders identify potential buy and sell signals based on price action. It is designed to provide clear visual cues and alerts for trading decisions. Here’s how it applies to price action and its key functionalities:
Key Features and Functionality
MACD Line and Signal Line:
MACD Line: Represents the difference between a fast and a slow moving average of the price. It helps in identifying the momentum of the price movement.
Signal Line: A smoothed average of the MACD Line, used to generate trading signals when the MACD Line crosses above or below it.
Histogram: The histogram shows the difference between the MACD Line and the Signal Line. It visually represents the strength of the trend, with positive values indicating bullish momentum and negative values indicating bearish momentum.
Trend Coloring:
Uptrend: When the MACD Line is above the Signal Line, the bars can be colored green to indicate a potential buying opportunity.
Downtrend: When the MACD Line is below the Signal Line, the bars can be colored red to signal a potential selling opportunity.
Timeframe Flexibility:
The E9 MACD can be adjusted to different timeframes, allowing traders to analyze short-term or long-term trends based on their trading strategy. This flexibility helps in tailoring the indicator’s analysis to different market conditions.
Visual Alerts and Highlights:
The indicator includes options to highlight price bars and background colors when significant crossovers occur, making it easier to spot key trading signals.
Circles can be plotted on the MACD Line to indicate cross events, enhancing visual clarity.
Customizable Appearance:
Traders can customize the appearance of the MACD Line, Signal Line, and Histogram, including color and line width, to suit their personal preferences and improve readability.
Alerts for Trading Signals:
The E9 MACD can generate alerts for crossovers of the MACD Line and Signal Line, helping traders stay informed of potential trading opportunities even when they are not actively monitoring the charts.
Application in Trading
The E9 MACD is particularly useful for:
Identifying potential entry and exit points based on the crossing of the MACD Line and Signal Line.
Gauging the strength of the current trend through the histogram.
Adjusting to different timeframes to align the indicator with various trading strategies, from day trading to long-term investing.
By providing clear visual indicators and alerts, the E9 MACD helps traders make more informed decisions and better understand the momentum and direction of price movements.
