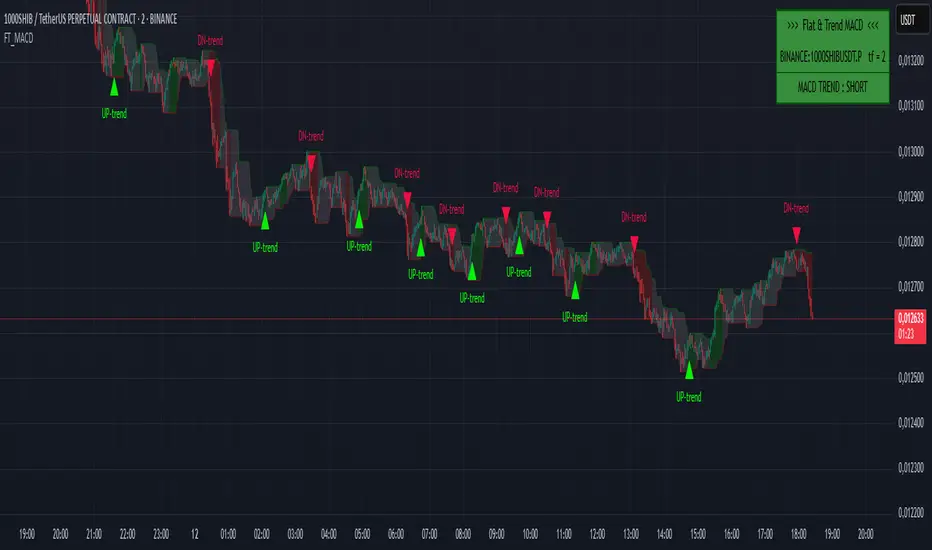
Flat & Trend MACD💡 The MACD indicator with trend interpretation and flat zones on top of the chart!
👉 This indicator clearly shows the zones of predominance of buyers, sellers, as well as zones of uncertainty (flat).
Suitable for any instrument and timeframe!
The MACD settings are standard.
The setup menu sets the length of Fast, Slow and smoothing for calculating the MACD oscillator.
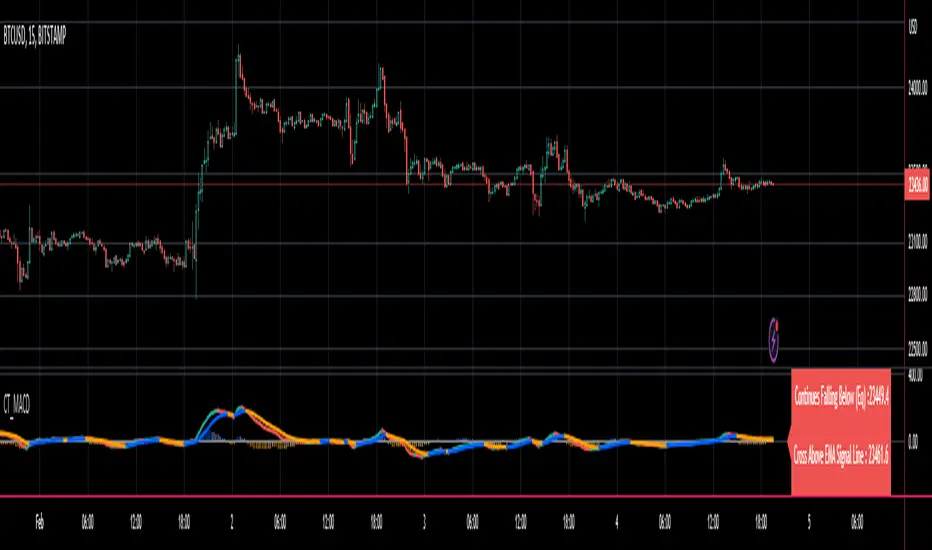
🔹The indicator tracks the value of the MACD relative to zero, taking into account the uncertainty zone, which is calculated at 50% of the average value of the deviation of the MACD for a short period. This avoids most false buy and sell signals.
🔹When the MACD value is positive and goes beyond uncertainty, a buy signal appears (green triangle on the chart), when the MACD value is negative and goes beyond uncertainty, a sell signal appears (red triangle on the chart). The built-in alert gives a signal of a trend change.
Also, the trend direction is highlighted by the background color of the price channel on the chart.
🔹If the MACD value is in the zone of uncertainty of the buyer and seller, the background turns gray and an orange square appears on the chart. The built-in alert gives a signal about the beginning of the flat zone.
A scoreboard is displayed in the upper right corner, which shows the current status of the indicator and a warning about the presence of a flat.
The flat display can be disabled in the indicator settings.
The colors can be changed in the Style menu.
👉 I wish everyone a profit and be sure to follow risk management in trading!
For any questions, you can write to me in private messages or by the contacts in my signature.
===============================================
💡 Индикатор MACD с интерпретацией тренда и флэтовых зон поверх графика!
👉 Данный индикатор наглядно показывает зоны преобладания покупателей, продавцов, а также зоны неопределенности (флэт).
Подходит для любого инструмента и таймфрейма!
Параметры настройки MACD - стандартные.
В меню настройки задается длина Fast, Slow и сглаживание для расчета MACD-осциллятора.
🔹Индикатор отслеживает значение MACD относительно нуля с учётом зон неопределённости, которая расчитывается в 50% среднего значения отклонения MACD за небольшой период. Это позволяет избежать большинства ложных сигналов на покупку и продажу.
🔹Когда значение MACD является положительным и выходит за пределы неопределённости - появляется сигнал на покупку (зеленый треугольник на графике), когда значение MACD является отрицательным и выходит за пределы неопределённости - появляется сигнал на продажу (красный треугольник на графике). Встроенное оповещение дает сигнал о смене тренда.
Также направление тренда подсвечивается окраской фона ценового канала на графике.
🔹Если значение MACD находится в зоне неопределённости покупателя и продавца - фон окрашивается в серый цвет и на графике появляется оранжевый квадрат. Встроенное оповещение дает сигнал о начале зоны флэта.
В правом верхнем углу высвечивается табло, которое показывает текущий статус индикатора и предупреждение о наличии флэта.
Отображение флэта можно отключить в настройках индикатора.
Цвета можно изменить в меню "Стиль".
👉 Желаю всем профита и обязательно соблюдайте риск-менеджмент в торговле!
По любым вопросам Вы можете написать мне в личные сообщения или по контактам в моей подписи.
"macd" için komut dosyalarını ara
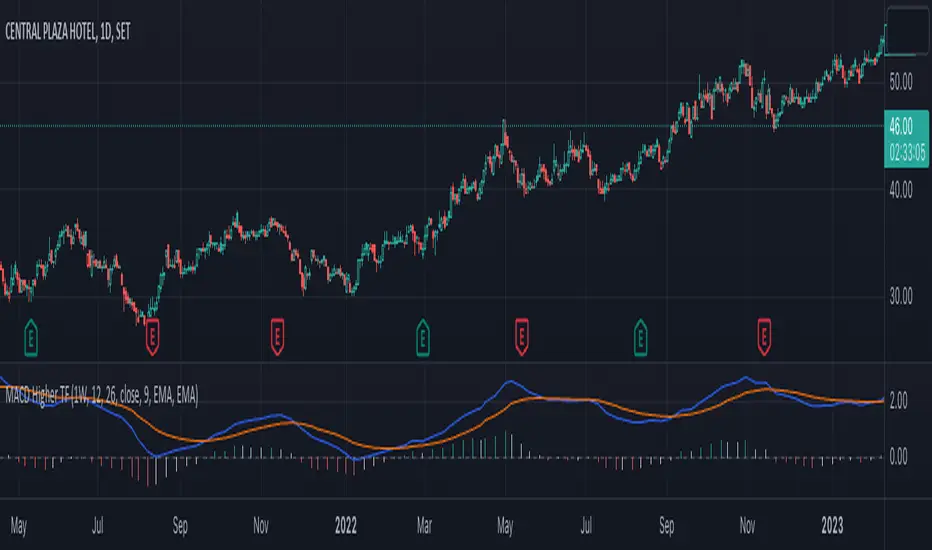
MACD Higher TimeFrameThis Pine script is an indicator called "MACD Higher TimeFrame" that calculates and displays the Moving Average Convergence Divergence (MACD) on a higher timeframe. It is designed to be used on a lower timeframe chart but show the MACD values from a specified higher timeframe.
The indicator takes several inputs, including the fast length, slow length, source data, signal smoothing length, and the types of moving averages to be used for the MACD and signal lines. The default values are set to 12, 26, the closing price, 9, and exponential moving averages (EMA) for both lines, respectively. These inputs can be modified by the user.
The script calculates the MACD and signal lines based on the specified inputs and the source data. It uses the `init_ma` function to initialize the moving average calculation based on the selected moving average type (EMA or SMA) and length.
To display the MACD and signal lines from the higher timeframe, the script utilizes the `request.security` function, fetching the values of MACD and signal lines one bar ago on the higher timeframe. It handles any gaps in data and lookahead considerations.
The script also includes a function called `int_htf_fillna`, which handles the filling of `na` (not available) values for the higher timeframe indicators. It ensures that the indicator values are carried forward if they are not available for a particular bar.
To enhance the visualization, the script includes customizable colors for the MACD line, signal line, and histogram bars. The histogram bars are styled using the `plot.style_columns` option, and their color is determined by the `color_handle_ducplicate_value` function. This function checks for duplicate values and assigns colors based on whether the indicator is rising or falling, and whether it is above or below zero.
The script also includes a zero line (color #787B86) to provide a visual reference for the zero level.
Overall, this Pine script allows users to view the MACD indicator from a higher timeframe on a lower timeframe chart, providing insights into the broader market trend.
Parabolic SAR + EMA 200 + MACD SignalsParabolic SAR + EMA 200 + MACD Signals Indicator, a powerful tool designed to help traders identify optimal entry points in the market.
This indicator combines three popular technical indicators: Parabolic SAR (Stop and Reverse), EMA200 (Exponential Moving Average 200) and MACD (Moving Average Convergence Divergence) - to provide clear and concise buy and sell signals based on market trends.
The MACD component of this indicator calculates the difference between two exponentially smoothed moving averages, providing insight into the trend strength of the market. The Parabolic SAR component helps identify potential price reversals, while the EMA200 acts as a key level of support and resistance, providing additional confirmation of the overall trend direction.
Whether you're a seasoned trader or just starting out, the MACD-Parabolic SAR-EMA200 Indicator is a must-have tool for anyone looking to improve their trading strategy and maximize profits in today's dynamic markets.
Buy conditions
The price should be above the EMA 200
Parabolic SAR should show an upward trend
MACD Delta should be positive
ُSell conditions
The price should be below the EMA 200
Parabolic SAR should show an downward trend
MACD Delta should be negative

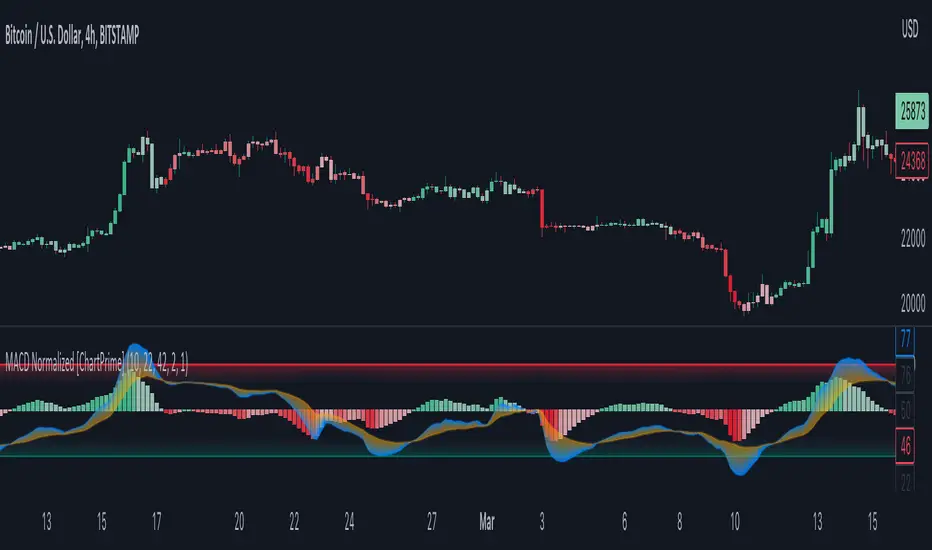
MACD Normalized [ChartPrime]Overview of MACD Normalized Indicator
The MACD Normalized indicator, serves as an asset for traders seeking to harness the power of the moving average convergence divergence (MACD) combined with the advantages of the stochastic oscillator. This novel indicator introduces a normalized MACD, offering a potentially enhanced flexibility and adaptability to numerous market conditions and trading techniques.
This indicator stands out by normalizing the MACD to its average high and average low, also factoring in the deviation of the high-low position from the mean. This approach incorporates the high and low in the calculations, providing the benefits of stochastic without its common drawbacks, such as clipping problems. As a result, the indicator becomes exceptionally versatile and suitable for various trading strategies, including both faster and slower settings.
The MACD Normalized Indicator boasts a variety of options and settings. The features include:
Enable Ribbon: Toggle the display of the ribbon accompanying the MACD Normalized, as desired.
Fast Length: Determine the movement speed of the fast line to receive advance notice of potential market opportunities.
Slow Length: Control the movement pace of the slow line for smoother signals and a comprehensive outlook on market trends.
Average Length: Specify the length used to calculate the high and low averages, providing greater control over the indicator's granularity.
Upper Deviation: Establish the extent to which the high and low values deviate from the mean, ensuring adaptability to diverse market situations.
Inner Band (Middle Deviation): Adjust the balance between the high and low deviations to create an inner band signal, giving traders a secondary level of market analysis and decision-making support.
Enable Candle Color: Enable the coloring of candles based on the MACD Normalized value for effortless visualization of trading potential.
Use Cases for the MACD Normalized Indicator
In addition to analyzing market trends and identifying potential trading opportunities, ChartPrime's MACD Normalized Indicator offers a range of applications for traders. These use cases encompass distinct trading scenarios and strategies:
Overbought and Oversold Regions
One of the key applications of the MACD Normalized Indicator is identifying overbought and oversold regions. Overbought refers to a situation where an asset's price has risen significantly and is expected to face a downturn, while oversold indicates a price drop that may subsequently lead to a reversal.
By adjusting the indicator's parameters, such as the upper and inner deviation levels, traders can set precise boundaries to determine overbought and oversold areas. When the MACD moves into the upper region, it may signal that the asset is overbought and due for a price correction. Conversely, if the MACD enters the lower region, it possibly indicates an oversold condition with the potential for a price rebound.
Signal Line Crossovers
The MACD Normalized Indicator displays two lines: the fast line and the slow line (inner band). A common trading strategy involves observing the intersection of these two lines, known as a crossover. When the fast line crosses above the slow line, it may signify a bullish trend or a potential buying opportunity. Conversely, a crossover with the fast line moving below the slow line typically indicates a bearish trend or a selling opportunity.
Divergence and Convergence
Divergence occurs when the price movement of an asset does not align with the corresponding MACD values. If the price establishes a new high while the MACD fails to do the same, a bearish divergence emerges, suggesting a potential downtrend. Similarly, a bullish divergence takes place when the price forms a new low but the MACD does not follow suit, hinting at an upcoming uptrend.
Convergence, on the other hand, is represented by the MACD lines moving closer together. This movement signifies a potential change in the trend, providing traders with a timely opportunity to enter or exit the market.
Color Changing MACDJapanese below / 日本語説明は下記
This indicator shows MACD with its colors changing based on trend strength.
The purpose of this indicator is to visually understand phases of trends, which are beginning, advancing and ending, measuring the range between MACD line and signal line.
Since MACD is originated from moving average, the range between MACD line and signal line gradually expands as trends progress while the range gets narrowed as trends come closer to the end. The indicator visualizes this characteristics.
The colors change as follows:
Green: In bullish trend, the range between MACD and signal gets expanded from previous candle, which indicates up trends continue
Purple: The range between MACD and signal gets narrowed from previous candle, which indicates trends gradually come to end.
Red: In bearish trend, the range between MACD and signal gets expanded from previous candle, which indicates down trends continue
See the chart below.
Features
Coloring
MACD line and signal line's colors change according to the logic above.
You can also fill the gap between MACD line and signal line with the same color changing logic as lines.
Signals
Golden cross and death cross signals can be displayed.
Alert
Alerts can be set when golden and death crosses occur.
---------------------
トレンドの強弱で色が変わるMACDのインジケーターです。トレンドが初期、進展期、終了期と移り変わる様子を視覚的に判断できることを目的に開発しています。
トレンドの強弱はMACDラインとシグナルラインの幅で判断します。
MACDは移動平均線を元にしたインジケーターであるため、トレンドが進展するにつれMACDラインとシグナルラインの幅は徐々に広がります。一方で、トレンドが終盤に差し掛かかるにつれ上記の幅は狭まります。インジケーターはこのMACDの特徴を色で可視化します。
色は以下の通り変化します。
緑:上昇トレンドにおいて、MACDラインとシグナルラインの幅が前のローソク足のそれよりも拡大している場合
=>トレンドの勢いが強まっていることを示唆
紫:MACDラインとシグナルラインの幅が前のローソク足のそれよりも縮小している場合
=>トレンドの勢いが弱まっていることを示唆
赤:下降トレンドにおいて、MACDラインとシグナルラインの幅が前のローソク足のそれよりも拡大している場合
=>トレンドの勢いが強まっていることを示唆
サンプルチャート
機能
色変更
上記のロジックでMACDとシグナルラインの色を変更します。また両ラインの間をラインと同じロジックで塗りつぶすことも可能です。
シグナル
ゴールデンクロスとデッドクロスでシグナルを表示
アラート
ゴールデンクロスとデッドクロスでアラートを設定可能

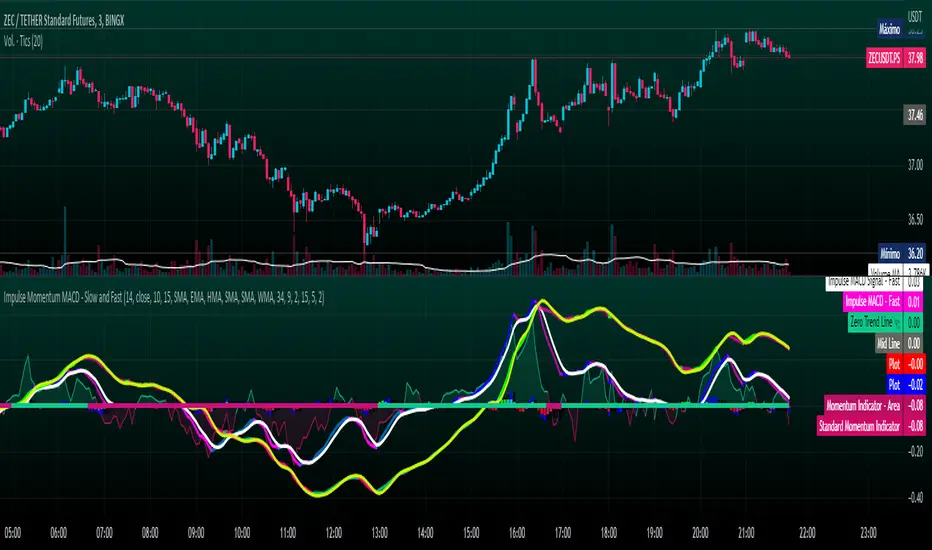
Impulse Momentum MACD - Slow and FastImpulse Momentum MACD - Slow and Fast
The Momentum indicator is a technical indicator that measures the speed and strength of the price movement of a financial asset. This indicator is used to identify the underlying strength of a trend and predict potential changes in price direction, when the indicator crosses the zero line, it can signal a change of direction in the price trend.
On the other hand, the MACD is an indicator used to identify the trend and strength of the market and shows the difference between two exponential moving averages ( EMA ) of different periods. The MACD is commonly used to determine the direction of an asset's price trend.
COPOSITION AND USE OF THE INDICATOR
This script is an implementation of the Impulse Momentum MACD indicator with two variations: slow and fast. It uses a combination of the Momentum indicator and the Moving Average Convergence/Divergence (MACD) indicator to identify trend reversals and momentum changes in an asset's price.
The combination of both indicators can help traders identify market entry and exit opportunities. The Impulse Momentum MACD is a Modified MACD, it is formed by filtering the values in a range of Modifiable Moving Averages by calculating their high and low ranges,This indicator has two parts: a slow part and a fast part. The slow part uses input values for the lengths of the moving averages and the length of the signal for the MACD indicator. The fast part uses different input values for the lengths of the moving averages. Also, each part has its own set of line colors and histogram colors for easy visualization.
The script also includes inputs to choose the type of moving average to use (SMA, EMA, etc.), the lookback period, the colors for the histogram lines and bars, and a zero trend line (also known as a horizontal trend line). ).
* Highest performing custom settings for the zero trend line. For Operations of:
- One Minute: Trend Line Time Frame = Five Minutes.
- Three Minutes: Trend Line Time Frame = Fifteen Minutes.
- Five Minutes: Trend Line Time Frame = Thirty Minutes.
- Fifteen Minutes: Trend Line Time Frame = Sixty Minutes.
Rules For Trading
🔹 Bullish:
* The Zero Horizontal Trend Line should be in Green Color.
* The Slow Histogram Bar should be in Green Color.
* The Fast Histogram Bar must be in Blue or Black Color or No Bar Appears.
* The Momentum Line or Momentum Area must be in Green Color.
crosses:
- When the Impulse Momentum MACD Slow line crosses the Impulse Momentum MACD Slow signal line upwards.
- When the Impulse Momentum MACD Fast line crosses the Impulse Momentum MACD Fast signal line upwards.
- Note 1: A Position is Opened when the condition of any of the aforementioned crossovers is met.
- Note 2: If the two aforementioned crossings anticipate the condition of the Zero Horizontal Tendency Line because it is in Red; A position is only opened immediately when the Zero Horizontal Trend line turns Green.
🔹 Bearish:
* The Zero Horizontal Trend Line should be in Red Color.
* The Slow Histogram Bar should be in Red Color.
* The Fast Histogram Bar must be in Blue or Black Color or No Bar Appears.
* The Momentum Line or Momentum Area must be in Red Color.
crosses:
- When the Impulse Momentum MACD Slow line crosses the Impulse Momentum MACD Slow signal line downwards.
- When the Impulse Momentum MACD Fast line crosses the Impulse Momentum MACD Fast signal line downwards.
- Note 1: A Position is Opened when the condition of any of the aforementioned crossovers is met.
- Note 2: If the two aforementioned crossings anticipate the condition of the Zero Horizontal Tendency Line because it is Green, an immediate position is only opened when the Zero Horizontal Tendency line turns Red.
This script can be used in different markets such as forex, indices and cryptocurrencies for analysis and trading. However, it is important to note that no trading strategy is guaranteed to be profitable, and traders should always conduct their own research and risk management.
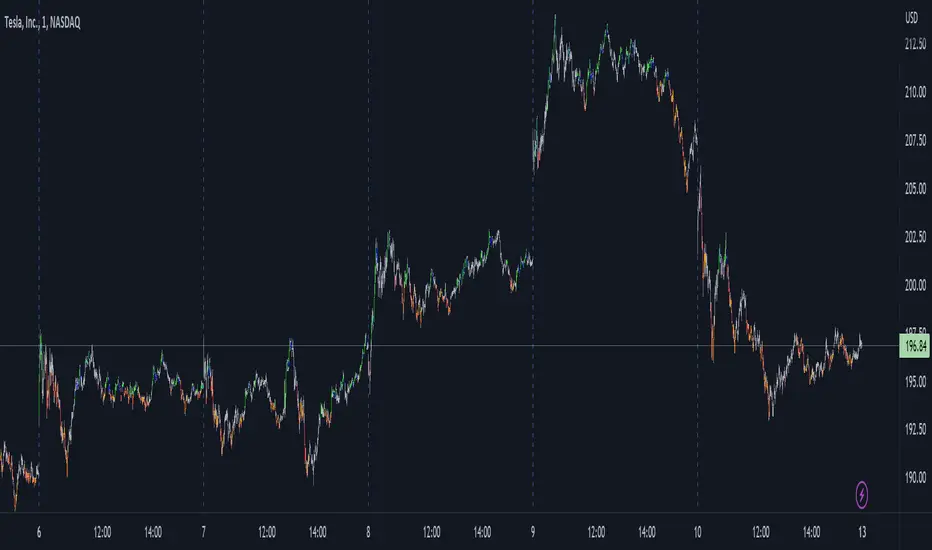
VWAP filtered MACD Bars with positive MACD histogram value and closing above VWAP are colored, long positions should be taken in areas made of those bars.
Similarly, bars with negative MACD histogram value and closing below VWAP are also colored, short positions should be taken there.
This indicator by default should be a part of your trend following trading system.
In the setting you can change colors
Above grow: positive and rising MACD histogram value
Above fall: positive and falling MACD histogram value
Below fall: negative and falling MACD histogram value
Below grow: negative and rising MACD histogram value
Rolling MACDThis indicator displays a Rolling Moving Average Convergence Divergence . Contrary to MACD indicators which use a fix time segment, RMACD calculates using a moving window defined by a time period (not a simple number of bars), so it shows better results.
This indicator is inspired by and use the Close & Inventory Bar Retracement Price Line to create an MACD in different timeframes.
█ CONCEPTS
If you are not already familiar with MACD, so look at Help Center will get you started www.tradingview.com
The typical MACD, short for moving average convergence/divergence, is a trading indicator used in technical analysis of stock prices, created by Gerald Appel in the late 1970s. It is designed to reveal changes in the strength, direction, momentum, and duration of a trend in a stock's price.
The MACD indicator(or "oscillator") is a collection of three time series calculated from historical price data, most often the closing price. These three series are: the MACD series proper, the "signal" or "average" series, and the "divergence" series which is the difference between the two. The MACD series is the difference between a "fast" (short period) exponential moving average (EMA), and a "slow" (longer period) EMA of the price series. The average series is an EMA of the MACD series itself.
Because RMACD uses a moving window, it does not exhibit the jumpiness of MACD plots. You can see the more jagged MACD on the chart above. I think both can be useful to traders; up to you to decide which flavor works for you.
█ HOW TO USE IT
Load the indicator on an active chart (see the Help Center if you don't know how).
Time period
By default, the script uses an auto-stepping mechanism to adjust the time period of its moving window to the chart's timeframe. The following table shows chart timeframes and the corresponding time period used by the script. When the chart's timeframe is less than or equal to the timeframe in the first column, the second column's time period is used to calculate RMACD:
Chart Time
timeframe period
1min 🠆 1H
5min 🠆 4H
1H 🠆 1D
4H 🠆 3D
12H 🠆 1W
1D 🠆 1M
1W 🠆 3M
You can use the script's inputs to specify a fixed time period, which you can express in any combination of days, hours and minutes.
By default, the time period currently used is displayed in the lower-right corner of the chart. The script's inputs allow you to hide the display or change its size and location.
Minimum Window Size
This input field determines the minimum number of values to keep in the moving window, even if these values are outside the prescribed time period. This mitigates situations where a large time gap between two bars would cause the time window to be empty, which can occur in non-24x7 markets where large time gaps may separate contiguous chart bars, namely across holidays or trading sessions. For example, if you were using a 1D time period and there is a two-day gap between two bars, then no chart bars would fit in the moving window after the gap. The default value is 10 bars.
//
This indicator should make trading easier and improve analysis. Nothing is worse than indicators that give confusingly different signals.
I hope you enjoy my new ideas
best regards
Chervolino

Normalized MACD with RSI [bkeevil]This indicator normalizes the MACD and RSI indicators to a range between -1.0 and 1.0 so they can be displayed together on the same chart to save screen real-estate.
While the MACD is a good indicator to detect trend changes, in some circumstances (such as a sideways range market) it can give false signals. The MACD is more likely to give a false signal when the RSI indicator is close to the centerline than if the RSI is signaling an overbought or oversold condition. Thus the RSI indicator and MACD indicator are commonly used together.
I have included a few features found in other MACD indicators that I have found helpful:
MACD line changes color if it is rising or falling
Dots at the MACD line to signal crossovers
The MACD signal line is hidden it by default as the information it contains is redundant. Hiding the signal line makes the indicator less busy.
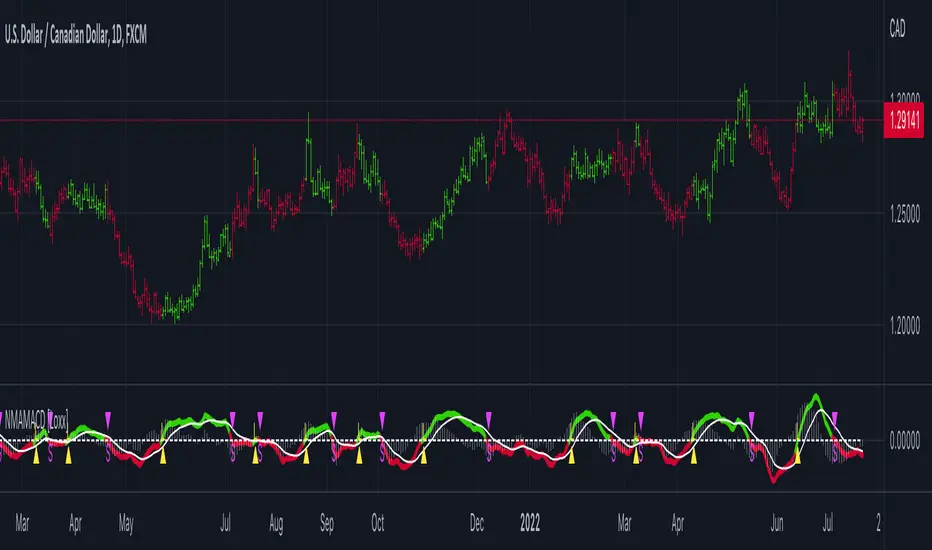
Nyquist Moving Average (NMA) MACD [Loxx]Nyquist Moving Average (NMA) MACD is a MACD indicator using Nyquist Moving Average for its calculation.
What is the Nyquist Moving Average?
A moving average outlined originally developed by Dr . Manfred G. Dürschner in his paper "Gleitende Durchschnitte 3.0".
In signal processing theory, the application of a MA to itself can be seen as a Sampling procedure. The sampled signal is the MA (referred to as MA.) and the sampling signal is the MA as well (referred to as MA). If additional periodic cycles which are not included in the price series are to be avoided sampling must obey the Nyquist Criterion.
It can be concluded that the Moving Averages 3.0 on the basis of the Nyquist Criterion bring about a significant improvement compared with the Moving Averages 2.0 and 1.0. Additionally, the efficiency of the Moving Averages 3.0 can be proven in the result of a trading system with NWMA as basis.
What is the MACD?
Moving average convergence divergence (MACD) is a trend-following momentum indicator that shows the relationship between two moving averages of a security’s price. The MACD is calculated by subtracting the 26-period exponential moving average (EMA) from the 12-period EMA.
The result of that calculation is the MACD line. A nine-day EMA of the MACD called the "signal line," is then plotted on top of the MACD line, which can function as a trigger for buy and sell signals. Traders may buy the security when the MACD crosses above its signal line and sell—or short—the security when the MACD crosses below the signal line. Moving average convergence divergence (MACD) indicators can be interpreted in several ways, but the more common methods are crossovers, divergences, and rapid rises/falls.
Included
Bar coloring
2 types of signal output options
Alerts
Loxx's Expanded Source Types
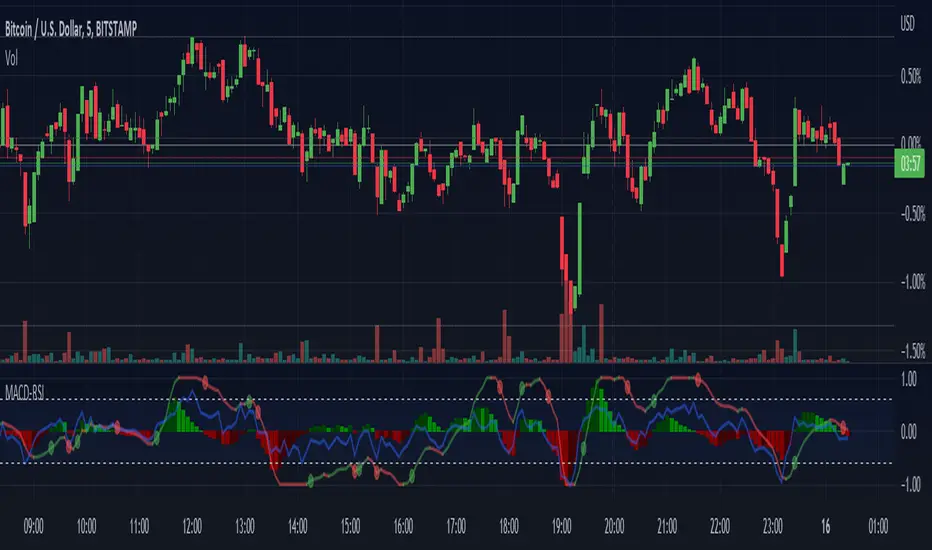
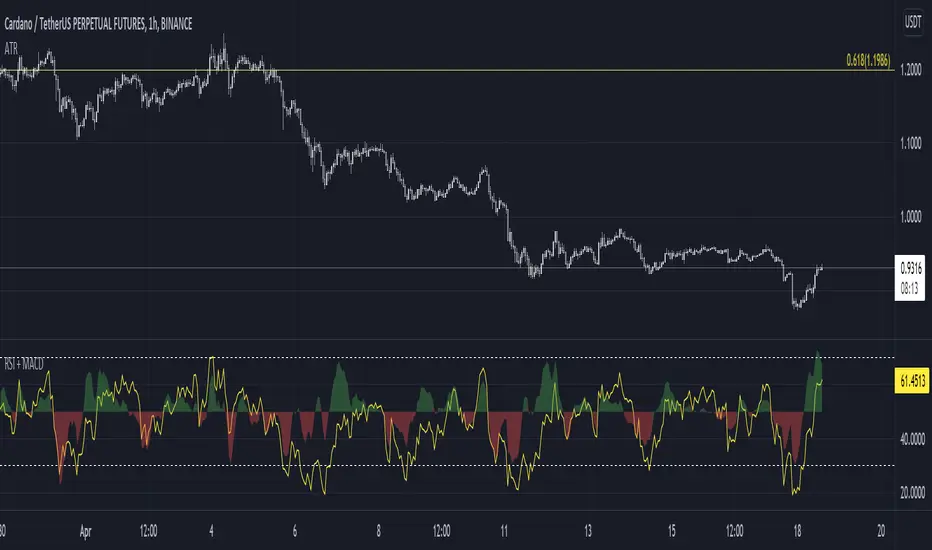
RSI + MACDRSI and MACD in one simplified indicator. Why? Because :
1. Save chart space, declutter, make decision making better, faster
2. MACD is not scaled to RSI range, now it is so you can have side by side comparison
Example how to use:
Enter on RSI oversold or overbought level, then exit on MACD crossover
See if there is an extra confluence to enter, hold or exit your trades, i.e oversold and falling macd is better than oversold and rising macd for short trades potentially.
MTF MACD (PPO) [TANHEF]Mult-Timeframe Moving Average Convergence Divergence (MACD) and Percentage Price Oscillator (PPO) indicator that allows for viewing of 1 to 5 different Timeframes.
Brief Summary
The primary benefit of multi-timeframe indicators is getting better entries and confirmation from viewing multiple time frames at once, which can often get overlooked.
MACD shouldn't be only used by itself, it is a lot more consistent when applied in the same direction as the trend as well as multiple other things including support, resistance, and volume improve the outcomes of the MACD results.
Personally, I look for good entries on higher and lower time frames (multiple timeframes must agree with the buying or selling). For example, if a higher timeframe looks like a good long entry (MACD line is crossing up and below the zero line), then the lower timeframes should be checked to ensure they are not oversold or overextended (the MACD line must be low or below the zero), once the lower and higher timeframes are in agreeance an entry can be made.
What is Moving Average Convergence Divergence (MACD)?
Moving average convergence divergence (MACD) is a trend-following momentum indicator that shows the relationship between two moving averages of the price. The MACD is calculated by subtracting the 26-period exponential moving average (EMA) from the 12-period EMA.
What is the Percentage Price Oscillator (PPO)?
The PPO is identical to the MACD indicator, except the PPO measures percentage difference between two EMAs, while the MACD measures absolute (or dollar) difference. The PPO has the advantage of being comparable to other assets with different prices, whereas MACD readings are not comparable. For example, regardless of the asset's price, a PPO result of 10 means the short-term average is 10% above the long-term average.
A signal line can be displayed on Timeframe, including:
- MACD & Signal Line crosses (Green when MACD above Signal Line and Red when MACD below Signal Line)
- Histogram Direction (fast and slow EMA gap)
- SuperTrend for identifying trend direction (green for uptrend, red for downtrend)
- EMA Trend for identifying trend direction (above EMA = up trend and green, below EMA = down trend and red)
Cross Dots and Potential cross dots
- Green Dot, is displayed when the MACD crosses the Signal Line
- Red Dot, is displayed when the MACD crosses the Signal Line
- Yellow Dot. Potential cross up (green dot) on next bar. Displayed when if the same distance a MACD moves on a bar is applied to the next bar will cause a MACD and Signal Line Cross. This is calculated by checking if the value change of one bar is added to the current MACD value would lead to a cross on the next bar, the it is a potential up dot.
- Purple Dot. Potential cross down (red dot) on next bar. Displayed when if the same distance a MACD moves on a bar is applied to the next bar will cause a MACD and Signal Line Cross. This is calculated by checking if the value change of one bar is added to the current MACD value would lead to a cross on the next bar, the it is a potential down dot.
Best Fit Settings
- Can be applied to the MACD, Signal Line, and Histogram to re-scale (stretch) to fit them within the space of the +2 and -2 range that each timeframe is provided on this indicator.
- The lookback distance value is used to lookback a certain distance to ensure everything scaled to fit well.
Labels are displayed on the right of the indicators, including:
- a label identifying 'line indicator' is currently being displayed
- the Timeframe corresponding to each MACD or PPO indicator
- the MACD or PPO of each Timeframe

Trend Following with Donchian Channels and MACDThis is a trend following system based on the Donchian Channels. Instead of using a simple moving average crossover, this system uses the MACD as the trendfilter:
Long positions:
* Price makes a new 50 day high,
* The MACD-line crosses above or is above the Signal-line.
* Both the MACD and the Signal-lines are above the zero-line.
Short positions:
* Price makes a new 50 day low,
* The MACD-line crosses below or is below the Signal-line.
* Both the MACD and the Signal-lines are below the zero-line.
Stoploss:
The initial and the trailing stoploss are 4 ATRs away from the price.

MACD including 6-period Forecast and Divergences█ OVERVIEW
This is my personal interpretation of the classic MACD Indicator. I am using the MACD as part of my analysis, and often I was wondering when I can expect the next signal (e.g. a Histogram cross). As I had come across some EMA forecast logics on tradingview, my goal was to use the EMA forecast calculation as basis to come to a complete MACD forecast. Here is the result.
Starting point is the classic MACD which is then plotted with MACD-Line, Signal Line and Histogram. In addition to the classic MACD, a 6 period Forecast for MACD, Signal and Histogram is available and divergences can be displayed on either the Histogram or the MACD Line.
Important:
As I am considering the closing price of the current candle as the basis for the calculation, the forecast values will REPAINT. But in my opinion this is fine as this indicator will not provide direct trading signals, but more an outlook into a potential future.
█ CALCULATION LOGIC
Below some details regarding the additional functionalities:
MACD Forecast:
The MACD Forecast is mainly based on a combination of EMA Forecasts. The inspiration for this basic forecast calculation is taken from the below tradingview members:
--> EMA Forecast input taken from "Triple MA Forecast" by yatrader2
--> Forecast Bias input taken from "Fancy Bollinger Bands" by BigBitsIO
When showing the forecast, the following options are available:
- Forecast Type: Determines if the Forecast is assuming a Flat price (last values of the MA calculation are replaced by current value) or if a Linear Regression is taken
- Number of candles taken for Linear Regression Calculation
- Bias of Forecast (Based on the recent Average True Range, the forecast values are either more bullish or more bearish calculated. "Neutral" turns off this function)
- Number of ATR Periods used to calculate Bias adjustment value
- Possibility to weight the Bias via a Multiplier - Default value is 1
Based on the above inputs, the forecasted values for MACD, Signal Line and Histogram are calculated and plotted for the next 6 periods.
Divergence Detection:
Based on the default tradingview divergence script with some adjustments:
- User can select to use either Histogram or MACD Line as basis for Divergence detection (Histogram by default)
- User can select if Divergence detection should be based on the candles including Wicks or only the Candle Bodies (Wicks by default)
█ DISCLAIMER
This is an experimental indicator and I do not know if my theory works in real life. So treat this not as financial advise, but purely for entertainment and educational purposes.
I publish this code open so that everyone can re-use it or hopefully even improve it.
Let me know if you have any ideas for improvement and if it is within my coding capabilities (which to be honest are quite limited), I will try to accomodate it.
Have fun.

RedK_xMACD: Extending the classic MACD with a simple filterThis is a simple concept that attempts to squeeze more price action insights from the classic MACD
we add a 3rd (longer length, slower) Moving Average line that acts as a trend filter - so whenever we are ("we" = the price and the 2 other MAs) are above that filter line, we consider ourselves to be in the up-trend territory, and vica versa .. so the MACD calculation here - that is represented by the main (reg/green) line in the plot - will represent the distance between the slow MA and the filter MA - when that MACD line crosses the zero axis up or down, that represents the trand reversing from one direction to the other.
A signal line (a smoothed version of that MACD line) is still added for 2 reasons
1 - the signal line makes it easy to see if an eminent trend reversal is to be expected
2 - to stay visually-consistent with the classic MACD :)
the distance (or delta) between the other 2 MAs continues to reflect an indication of the short-term momentum and is what the histogram represents.
we still have the benefit of the convergence/diversion between the price itself and the histogram similar to the classic MACD
this MACD version will also clearly show how price and momentum action will lead the trend -- i know that's a big discussion topic :)
i added a classic MACD at the bottom panel, and used the same length settings (fast / slow) for side-by-side comparison
i coded this when i found that i use 3 moving averages all the time during my chart analysis, and while i'm a big fan of the classic MACD, i wanted to find a simple way to get my MACD to reflect what the 3 MAs on the price chart show. turned out to be insightful - i hope other fellow traders may find this useful
the code is simple and i started it from the built-in MACD in TradingView. Other annotations are added to the chart here as i believe this will better explain how the eXtended MACD works
- there are 4 reversals that occur in that chart, and i chose to show one in step-by-step fashion.
if more explanation is needed to how this can be used, pls let me know in the comments.

Reverse MACD IndicatorIntroducing the reverse MACD Indicator.
This is my Pinescript implementation of the reverse MACD indicator.
Much respect to Mr Johnny Dough the original creator of this idea.
Feel free to reuse this script, drop me a note below if you find this useful.
Investopedia defines the MACD as a trend-following momentum indicator that shows the relationship between two moving averages of a security’s price.
The MACD is calculated by subtracting the 26-period Exponential Moving Average ( EMA ) from the 12-period EMA .
The result of that calculation is the MACD line.
A nine-day EMA of the MACD called the "signal line," is then plotted on top of the MACD line, which can function as a trigger for buy and sell signals.
Traders may buy the security when the MACD crosses above its signal line and sell—or short—the security when the MACD crosses below the signal line.
Moving Average Convergence Divergence ( MACD ) indicators can be interpreted in several ways, but the more common methods are crossovers, divergences, and rapid rises/falls.
MACD triggers technical signals when it crosses above (to buy) or below (to sell) its signal line.
The speed of crossovers is also taken as a signal of a market is overbought or oversold.
MACD helps investors understand whether the bullish or bearish movement in the price is strengthening or weakening.
The MACD has a positive value (shown as the red line on the price chart ) whenever the 12-period EMA ( indicated by the blue line on the price chart) is above the 26-period EMA (the red line in the price chart) and a negative value when the 12-period EMA is below the 26-period EMA .
The more distant the MACD is above or below its baseline indicates that the distance between the two EMAs is growing.
The baseline here is the white line.
The Reverse function of the MACD provides value by letting the user know the specific price needed to expect a MACD cross over in the opposite direction.
This function can be used to designate risk parameters for a potential trade if using the MACD as their source of edge, letting the user know exactly where and how much their risk is for a potential trade which can be used to design an effective trading plan.
MACD Trend CandlesThe script combines 2 indicators (MACD and Stoch-RSI) and puts them visually directly on the candles - can be used with normal OHLC candles or Heiken Ashi candles. Furthermore, you can derive divergences exremely easy directly visually from the candles as well. Lastly, a SMA 20 high and a SMA 20 low line build a trend channel.
Script is best used in trending markets to trade with the trend.
1) SMA trend channel:
* uptrend: close above
* downtrend: close below
* aggressive entry (uptrend) closing inside channel from below
* conservative entry (uptrend) closing above channel from inside
* hold (uptrend) until close below channel
* can be used accordingly for the downtrend
2) MACD candles
* visualization of the MACD histogram directly on the candles
* dark blue: histogram > 0 and histogram > histogram of previous candle
* light blue: histogram > 0 and histogram < histogram of previous candle
* orange: histogram < 0 and histogram < histogram of previous candle
* light blue: histogram < 0 and histogram > histogram of previous candle
* hold uptrend (dark/light blue candles) - combined with trend channel (above channel)
* hold downtrend (orange /yellow candles) - combined with trend channel (below channel)
* Color divergence: light blue candle > dark blue candle (price and MACD show divergence (bearish)
* Color divergence: yellow candle < orange candle (price and MACD show divergence (bullish)
* Trend change (0 line cross to upside) yellow or orange to dark blue
* Trend change (0 line cross to downside) dark or light blue to orange
3) Stoch RSI diamonds
* visualization of the STOCH-RSI as diamonds above or below the candle
* k, d line > 80: diamond above the candle
* k, d line < 20: diamond below the candle
* divergence caldle without diamond above > candle with diamond above (bearish divergence)
* divergence caldle without diamond below < candle with diamond below (bullish divergence)
Feel free to test each part individually and combine it with other indicators, e.g. BBands and Ichimoku Cloud - you will see it is a powerful visualization script
HAVE FUN

P-MACD by DGTPrice and Moving Averages Convergence/Divergence, shortly named as P-MACD
P-MACD is a trend-following momentum indicator that shows the relationship between Price and Long-term Moving Average (PMACD), and the relationship between two Moving Averages (MAMACD). P-MACD is composed of two lines, and an histogram, showing price distance (convergence/divergence) to its Long-term MA (PMACD), showing short-term MA distance (convergence/divergence) to long-term MA (MAMACD), and a histogram showing the difference (momentum) between the PMACD and MAMACD
The PMACD is calculated by dividing the Price to Long-term Moving Average (200-period SMA/EMA) and finally smoothed with 9-period SMA/EMA
- PMACD Line Formula : (Price / SlowMovingAverage -1) * 100 and smoothed with 9-period SMA/EMA
The MAMACD is calculated by dividing the Short-term Moving Average (such as 20 SMA/EMA) to the Long-term Moving Average (such as 200-period SMA/EMA)
- MAMACD Line Formula : (FastMovingAverage / SlowMovingAverage -1) * 100
The Histogram is calculated by subscripting PMACD and MAMACD
- Formula : PMACD - MAMACD
Optional
Trend Cloud calculated based on fast and slow version of MAMACD
What to look for:
- Line Crosses : PMACD Line can function as a trigger(signal) for buy and sell signals. Buy when the PMACD crosses above the MAMACD line and sell - or short - when the PMACD crosses below the MAMACD line
- Base Crosses : PMACD and/or MAMACD crosses above or below Baseline is another way to indicate the trend and momentum. MAMACD crosses of Baseline, MAMACD positive or negative, reflects short-term moving average crosses the long-term moving average and similarly, PMACD crosses of BaseLine, PMACD positive or negative, reflects price crosses a long-term moving average
- Momentum : P-MACD helps investors understand whether the bullish or bearish movement in the price is strengthening or weakening displayed with a histogram which graphs the distance between the PMACD and MAMACD. Additionally, upward momentum is confirmed with a bullish crossover, which occurs when PMACD and/or MAMACD crosses above Baseline. Conversely, downward momentum is confirmed with a bearish crossover, which occurs when PMACD and/or MAMACD crosses below Baseline
- Distance : Prices high above the moving average (MA) or low below it are likely to be remedied in the future by a reverse price movement. The more distant the PMACD is above or below its baseline indicates that the distance between the Price and its SMA is growing (regarding PMACD, You may find a detailed article explained in “Price Distance to its MA” indicator by DGT) . Similarly the more distant the MAMACD is above or below its baseline indicates that the distance between the two SMAs is growing
- Trend : A rising P-MACD indicates an uptrend, while a declining P-MACD indicates a downtrend
MACD vs. P-MACD
MACD measures the relationship between two MAs, while the P-MACD measures both the relationship between price and its MA, and the relationship between two MAs. MAMACD Line of P-MACD If set to same moving average type and same lengths as in MACD will produce the same line as MACD line, only values are represented as percentage with MAMACD. Both measure momentum in a market, but, because they measure different factors, they differentiate from each other even if they have similarities in presentation. P-MACD provides additional insights, not only to MA relation but also to Price and MA relation
Warning : Moving Average are calculated based on past prices, so they are lagging. The longer the time period for the moving average, the greater the lag as well as less sensitive to price changes. This study implements usage of 200-period long-term moving average, which implies that the P-MACD will provide insight especially for long-term trades, more suited for long-term trades, usage of P-MACD for short-term trades is recommend with lower timeframes (1H or lower).
Indicators aim to generate a potential signal/indication of an upcoming opportunity, but, the Indicators themselves do not guarantee the future movement of a given financial instrument, and are most useful when used in combination with other techniques.
Trading success is all about following your trading strategy and the indicators should fit within your trading strategy, and not to be traded upon solely
Disclaimer : The script is for informational and educational purposes only. Use of the script does not constitutes professional and/or financial advice. You alone the sole responsibility of evaluating the script output and risks associated with the use of the script. In exchange for using the script, you agree not to hold dgtrd tradingview user liable for any possible claim for damages arising from any decision you make based on use of the script

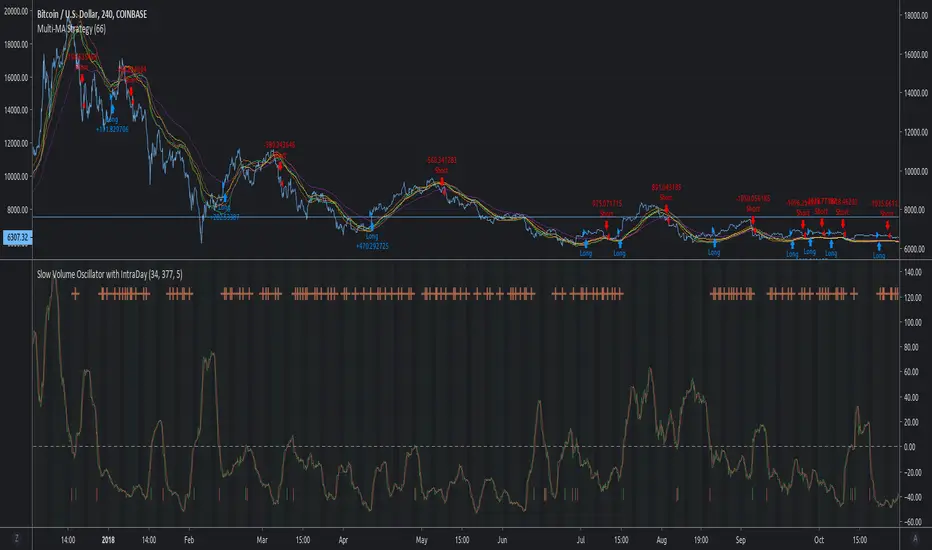
MACD Multi-MA StrategyThis script applies the average of each major MA (SMA, RMA, EMA, WVMA, WMA) to the MACD formula.
The logic is simple. When all 5 MA's are in agreement in direction, then then script will notify users of change.
I posted this as a strategy to help show how logic does in back test. If you use my simple yet effective solution to find take profit locations, you can blow this back testing out of the water!!!
To set alerts simply turn script into study
//@version=2
study(title="MACD Multi-MA Study", overlay=false)
src = close
len1 = input(8, "FAST LOOKBACK")
len2 = input(144, "SLOW LOOKBACK")
/////////////////////////////////////////////
length = len2-len1
ma = vwma(src, length)
plot(ma, title="VWMA", color=lime)
length1 = len2-len1
ma1 = rma(src, length1)
plot(ma1, title="RMA", color=purple)
length2 = len2-len1
ma2 = sma(src, length2)
plot(ma2, title="SMA", color=red)
length3 = len2-len1
ma3 = wma(src, length3)
plot(ma3, title="WMA", color=orange)
length4 = len2-len1
ma4 = ema(src, length4)
plot(ma4, title="EMA", color=yellow)
long = ma > ma and ma1 > ma1 and ma2 > ma2 and ma3 > ma3 and ma4 > ma4
short = ma < ma and ma1 < ma1 and ma2 < ma2 and ma3 < ma3 and ma4 < ma4
alertcondition(long == true, title='MACD LONG SIGNAL', message='MACD LONG!')
alertcondition(short == true, title='MACD SHORT SIGNAL', message='MACD SHORT!')
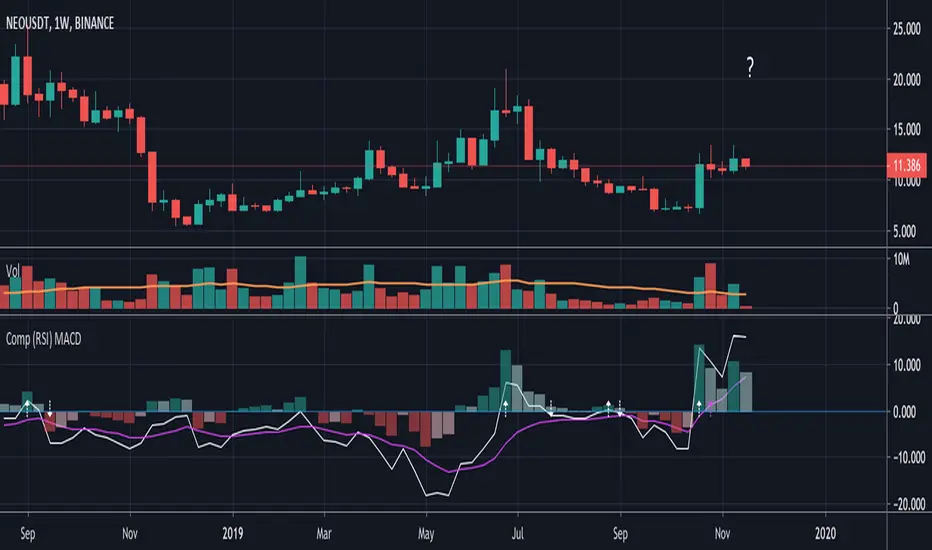
Compare (RSI) MACDHere I've created an indicator which can be used together with my "Compare (RSI) Ticker 3x" Indicator.
It makes it much easier to see the movements between the "RSI Ticker 1" and "RSI Ticker 2/3".
- The white line is the "MACD" of Ticker 1, which is the difference between the "RSI Ticker 1" and "RSI Ticker 2/3".
- The purple line is the "Signal" line, an EMA of the "MACD". (Length is adjustable)
- The "0-line" is the "RSI Ticker 2/3" line, when Ticker 2 is chosen, this will be blue coloured, when Ticker 3 is chosen it will be red.
Because 2 MACD in 1 indicator is way too messy, you only can choose the comparison against Ticker 2 OR Ticker 3.
- In "Settings" > "Inputs" you can enable/disable the second or third Ticker
(If Ticker 2 is enabled, Ticker 3 is disabled and vice versa)
- The second Ticker has multiple choices
- The third you can type any Ticker you want, for example CRYPTOCAP:BNB, BINANCE:ETHUSDT, NASDAQ_DLY:NDX or whatever,
just start typing and you'll see the possibilities (You also can choose between "Cryptocurrencies", "Index", "Forex", ...)
- When the "MACD" crosses the "0-line", arrows will appear, white ones for "MACD", purple ones for the "Signal" line.
- The "Histogram" makes it easier to see the difference between "MACD" and "Signal" line.
- The source of this indicator is adjustable
- When the second chosen Ticker is the same as the first Ticker, of course you will be seeing lines
(because there is no difference between the 2 Tickers, the EMA is visible though)
If you use both "Compare (RSI) Ticker 3x" AND "Compare (RSI) MACD", of course be aware that you have the same Ticker 2 or 3 in each indicator!
VC_ Coloured MACDMACD VonCrypto
Combined MACD and MACD 4C indicators to give quick visual of MACD position. My personal defaults are, remove histogram, set lines to thinest setting, make MACD lines 100% opaque, light blue and orange.
SMA+MACD+RSI+Stoch Entry📌 Tools Used:
• SMA 21, SMA 50, SMA 200
• MACD (12, 26, 9)
• Pivot Point Standard
• RSI (length 75)
• Stochastic (14, 3, 3)
Trading Timeframe:
• Usable on all timeframes
Chart Preparation:
• Analyze the overall market trend and the instrument being traded
• Set an appropriate timeframe according to the market
• Apply SMA 21, SMA 50, SMA 200
• Apply MACD and Pivot Point Standard
• Ensure a proper market trend by checking the position of SMA 21, SMA 50, and SMA 200 relative to each other
If there are too many crossings between SMA 21, SMA 50, and SMA 200, do not enter any trades until the market trend stabilizes
Conditions for Entering a Long Trade (Bullish Trigger):
• Candle closes above the pivot line
• Confirm an uptrend by checking that SMA 21 is above SMA 50, and SMA 50 is above SMA 200
• RSI is above the midpoint
• Presence of a suitable corrective step with normal slope, considering the strength of the previous step
• MACD histogram indicates bullish momentum
• Stochastic shows a bullish crossover from below
Conditions for Entering a Short Trade (Bearish Trigger):
• Candle closes below the pivot line
• Confirm a downtrend by checking that SMA 21 is below SMA 50, and SMA 50 is below SMA 200
• RSI is below the midpoint
• Presence of a suitable corrective step with normal slope, considering the strength of the previous step
• MACD histogram indicates bearish momentum
• Stochastic shows a bearish crossover from above

MACD + RSI + EMA + BB + ATR Day Trading StrategyEntry Conditions and Signals
The strategy implements a multi-layered filtering approach to entry conditions, requiring alignment across technical indicators, timeframes, and market conditions .
Long Entry Requirements
Trend Filter: Fast EMA (9) must be above Slow EMA (21), price must be above Fast EMA, and higher timeframe must confirm uptrend
MACD Signal: MACD line crosses above signal line, indicating increasing bullish momentum
RSI Condition: RSI below 70 (not overbought) but above 40 (showing momentum)
Volume & Volatility: Current volume exceeds 1.2x 20-period average and ATR shows sufficient market movement
Time Filter: Trading occurs during optimal hours (9:30-11:30 AM ET) when market volatility is typically highest
Exit Strategies
The strategy employs multiple exit mechanisms to adapt to changing market conditions and protect profits :
Stop Loss Management
Initial Stop: Placed at 2.0x ATR from entry price, adapting to current market volatility
Trailing Stop: 1.5x ATR trailing stop that moves up (for longs) or down (for shorts) as price moves favorably
Time-Based Exits: All positions closed by end of trading day (4:00 PM ET) to avoid overnight risk
Best Practices for Implementation
Settings
Chart Setup: 5-minute timeframe for execution with 15-minute chart for trend confirmation
Session Times: Focus on 9:30-11:30 AM ET trading for highest volatility and opportunity
