[blackcat] L3 Ichimoku FusionCOMPREHENSIVE ANALYSIS OF THE L3 ICHIMOKU FUSION INDICATOR
🌐 Overview:
The L3 Ichimoku Fusion is a sophisticated multi-layered technical analysis tool integrating classic Japanese market forecasting techniques with enhanced dynamic elements designed specifically for identifying potential turning points in financial instruments' pricing action.
Key Purpose:
To provide traders with an intuitive yet powerful framework combining established ichimoku principles while incorporating additional validation checkpoints derived from cross-timeframe convergence studies.
THEORETICAL FOUNDATION EXPLAINED
🎓 Conceptual Background:
:
• Conversion & Base Lines tracking intermediate term averages
• Lagging Span providing delayed feedback mechanism
• Lead Spans projecting future equilibrium states
:
• Adaptive parameter scaling options
• Automated labeling system for critical junctures
• Real-time alert infrastructure enabling immediate response capability
PARAMETER CONFIGURATION GUIDE
⚙️ Input Parameters Explained In Detail:
Regional Setting Selection:**
→ Oriental Configuration: Standardized approach emphasizing slower oscillation cycles
→ Occidental Variation: Optimized settings reducing lag characteristics typical of original methodology
Multiplier Adjustment Functionality:**
↔ Allows fine-graining oscillator responsiveness without altering core relationship dynamics
↕ Enables adaptation to various instrument volatility profiles efficiently
Displacement Value Control:**
↓ Controls lead/lag offset positioning relative to current prices
↑ Provides flexibility in adjusting visual representation alignment preferences
DYNAMIC CALCULATION PROCESSES
💻 Algorithmic Foundation:
:
Utilizes highest/lowest extremes over specified lookback windows
Produces more responsive conversions compared to simple MAs
:
→ Confirms directional bias across multiple independent criteria
← Ensures higher probability outcomes reduce random noise influence
:
♾ Creates persistent annotations documenting significant events
🔄 Handles complex state transitions maintaining historical record integrity
VISUALIZATION COMPONENTS OVERVIEW
🎨 Display Architecture Details:
:
→ Solid colored trendlines representing conversion/base relationships
↑ Fill effect overlay differentiating expansion/compression phases
↔ Offset spans positioned according to calculated displacement values
:
→ Green shading indicates positive configuration scenarios
↘ Red filling highlights negative arrangement situations
⟳ Orange transition areas mark transitional periods requiring caution
:
✔️ LE: Long Entry opportunity confirmed
❌ SE: Short Setup validated
☑ XL/XS: Position closure triggers active
✓ RL/RS: Potential re-entry chances emerging
STRATEGIC APPLICATION FRAMEWORK
📋 Practical Deployment Guidelines:
Initial Integration Phase:
Select appropriate timeframe matching trading horizon preference
Configure input parameters aligning with target asset behavior traits
Test thoroughly under simulated conditions prior to live usage
Active Monitoring Procedures:
• Regular observation of cloud formation evolution
• Tracking label placements against actual price movements
• Noting pattern development leading up to signaled entry/exit moments
Decision Making Process Flowchart:
→ Identify clear breakout/crossover events exceeding confirmation thresholds
← Evaluate contextual factors supporting/rejecting indicated direction
↑ Execute trades only after achieving required number of confirming inputs
PERFORMANCE OPTIMIZATION TECHNIQUES
🚀 Refinement Strategies:
Calibration Optimization Approach:
→ Start testing with default suggested configurations
↓ Gradually adjust individual components observing outcome changes
↑ Document findings systematically building personalized version profile
Context Adaptability Methods:
➕ Add supplementary indicators enhancing overall reliability
➖ Remove unnecessary complexity layers if causing confusion
✨ Incorporate custom rules adapting to specific security behaviors
Efficiency Improvement Tactics:
🔧 Streamline redundant processing routines where possible
♻️ Leverage shared data streams whenever feasible
⚡ Optimize refresh frequencies balancing update speed vs computational load
RISK MITIGATION PROTOCOLS
🛡️ Safety Measures Implementation Guide:
Position Sizing Principles:
∅ Never exceed preset maximum exposure limits defined by risk tolerance
± Scale positions proportionally per account size/market capitalization
× Include slippage allowances within planning stages accounting for liquidity variations
Validation Requirements Hierarchy:
☐ Verify signals meet minimum number of concurrent validations
⛔ Ignore isolated occurrences lacking adequate evidence backing
▶ Look for convergent evidence strengthening conviction level
Emergency Response Planning:
↩ Establish predefined exit strategies including trailing stops mechanisms
🌀 Plan worst-case scenario responses ahead avoiding panic reactions
⇄ Maintain contingency plans addressing unexpected adverse developments
USER EXPERIENCE ENHANCEMENT FEATURES
🌟 Additional Utility Functions:
Alert System Infrastructure:
→ Automatic notifications delivered directly to user devices
↑ Message content customized explaining triggered condition specifics
↔ Timing optimization ensuring minimal missed opportunities due to latency issues
Historical Review Capability:
→ Ability to analyze past performance retrospectively
↓ Assess effectiveness across varying market regimes objectively
↗ Generate statistics measuring success/failure rates quantitatively
Community Collaboration Support:
↪ Share personal optimizations benefiting wider trader community
↔ Exchange experiences improving collective understanding base
✍️ Provide constructive feedback aiding ongoing refinement process
CONCLUSION AND NEXT STEPS
This comprehensive guide serves as your roadmap toward mastering the capabilities offered by the L3 Ichimoku Fusion indicator effectively. Success relies heavily on disciplined application combined with continuous learning and adjustment processes throughout implementation journey.
Wishing you prosperous trading endeavors! 👋💰
"ma cross" için komut dosyalarını ara

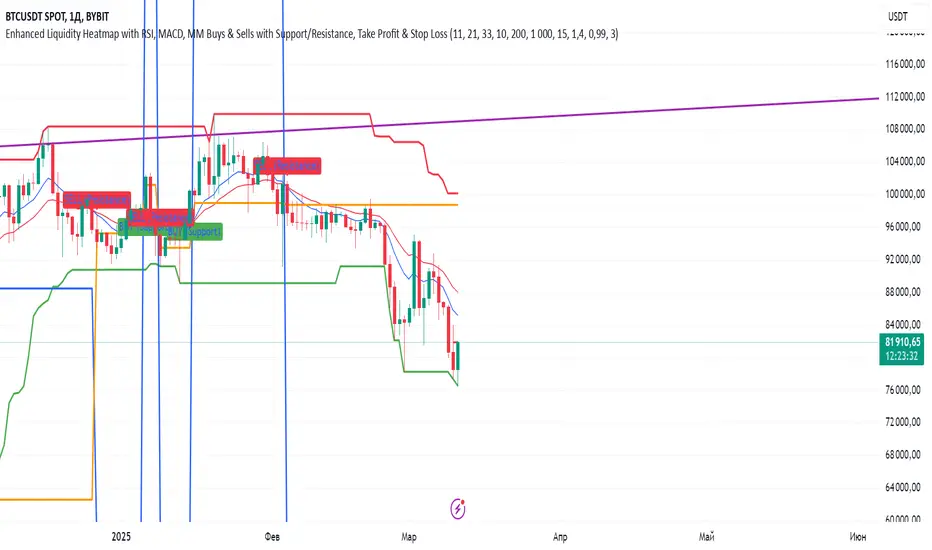
Indiq 2.0The functionality of the indicator includes the following features:
Moving Averages (MA):
The ability to adjust periods for short (short_ma_length) and long (long_ma_length) moving averages.
Display of moving averages on the chart:
Short MA (blue line).
Long MA (red line).
Generation of buy and sell signals:
Buy (BUY): When the short MA crosses the long MA from below.
Sell (SELL): When the short MA crosses the long MA from above.
Visualization of signals on the chart:
Buy is displayed as a green BUY marker below the candle.
Sell is displayed as a red SELL marker above the candle.
Liquidity Heatmap:
Liquidity levels:
Levels are calculated based on the closing price and a step (liquidity_step).
Levels are grouped by the nearest price values.
Volumes at levels:
Volume (volume) is accumulated for each liquidity level.
Levels with a volume less than min_volume_filter are not displayed.
Time filtering:
Levels that have not been updated within the last time_filter bars are not displayed.
Volatility filtering:
Levels are filtered by volatility (ATR) to exclude those outside the volatility range.
Color gradient:
The color of levels depends on volume (gradient from gradient_start_color to gradient_end_color).
Visualization:
Liquidity levels are displayed as horizontal lines.
Volumes at levels are shown as text labels.
RSI Filtering:
The ability to enable/disable RSI filtering (rsi_filter).
Liquidity levels are filtered based on overbought (rsi_overbought) and oversold (rsi_oversold) conditions.
Levels that do not meet RSI conditions are not displayed.
MACD Filtering:
The ability to enable/disable MACD filtering (macd_filter).
Liquidity levels are filtered based on the MACD histogram condition (e.g., only if the histogram is above zero).
Levels that do not meet MACD conditions are not displayed.
Display of Market Maker Buys:
Condition for market maker buys:
Volume exceeds the average volume over the last 20 bars by 2 times.
Closing price is above the opening price.
Market maker buys are displayed on the chart as orange MM Buy markers below the candle.
Indicator Settings:
Moving average parameters:
short_ma_length: Period for the short MA.
long_ma_length: Period for the long MA.
Liquidity heatmap parameters:
liquidity_step: Step between liquidity levels.
max_levels: Maximum number of levels to display.
time_filter: Time filter (last N bars).
min_volume_filter: Minimum volume for displaying a level.
volatility_filter: Volatility filter (ATR multiplier).
RSI parameters:
rsi_filter: Enable/disable RSI filtering.
rsi_overbought: Overbought RSI level.
rsi_oversold: Oversold RSI level.
MACD parameters:
macd_filter: Enable/disable MACD filtering.
Color settings:
gradient_start_color: Starting color of the gradient.
gradient_end_color: Ending color of the gradient.
Visualization:
Moving averages:
Short MA: Blue line.
Long MA: Red line.
Signals:
Buy: Green BUY marker.
Sell: Red SELL marker.
Liquidity heatmap:
Liquidity levels: Horizontal lines with a color gradient.
Volumes: Text labels at levels.
Market maker buys:
Orange MM Buy markers.
Alerts:
The ability to set alerts for signals:
Buy (BUY).
Sell (SELL).
Additional Features:
Flexible filter settings:
Filtering by time, volume, volatility, RSI, and MACD.
Extensibility:
The ability to add new filters (e.g., Stochastic, Volume Profile, etc.).
Visual customization:
Adjustment of colors, sizes, and display styles.
Summary:
The indicator provides a comprehensive tool for analyzing liquidity, generating trading signals, and tracking market maker activity. It combines:
A liquidity heatmap.
Signals based on moving averages.
Filtering by RSI and MACD.
Display of market maker buys.
Flexible settings and visualization.
This indicator is suitable for traders who want to analyze liquidity levels, identify entry and exit points, and monitor the actions of large market players.
Smart Moving AveragesSmart Moving Averages analyzes the dynamic interplay between price action and multiple moving averages to identify high-probability support and resistance zones.
The script's distinguishing features include:
Bounce detection that filters out noise by requiring specific penetration thresholds (0.1-1.5%), helping traders identify genuine support tests versus false signals
Real-time MA clustering analysis that reveals zones where multiple moving averages converge, indicating potentially stronger support/resistance levels
Statistical tracking of bounce success rates for each MA, allowing traders to identify which moving averages are most reliable for the current market conditions
Power bounce detection that combines EMA spread analysis with trend confirmation, highlighting especially strong bullish setups
Visual stack status system that instantly communicates market health through an intuitive color-coded display showing how many MAs are below price
The script helps traders make more informed decisions by quantifying the historical reliability of different moving averages while providing real-time analysis of MA interactions with price. This systematic approach moves beyond simple MA crossovers to identify higher probability trading opportunities.

Meme Coin Buy Signal Indicator by asharThis custom TradingView indicator is specifically designed for meme coins, using technical analysis indicators to identify optimal buy signals. It combines short-term moving averages, volume spikes, and Bitcoin trend alignment to pinpoint potential entry points during high-momentum periods.
Indicator Components:
Moving Averages (MA): A 5-period fast MA and a 13-period slow MA highlight short-term price momentum. Buy signals are generated when the fast MA crosses above the slow MA, indicating potential upward momentum.
Volume Spike Detection: The indicator detects high-volume periods using a multiplier. If the current volume exceeds the 10-period average volume by the set multiplier (default: 2.0), it indicates increased buying interest, which is crucial for meme coins.
Bitcoin Trend Alignment: The trend of Bitcoin, a market-wide sentiment indicator, is gauged with a 20-day moving average. Buy signals are validated only when Bitcoin is also in an uptrend, providing additional bullish confirmation for meme coins.
Buy Signal Criteria: A buy signal is triggered when:
The fast MA crosses above the slow MA.
Volume is above the average by the set multiplier.
The price is above the slow MA.
Bitcoin is trending up based on the 20-day moving average.
This indicator is ideal for meme coin traders looking to time entries with momentum-driven trends, aligning volume and trend indicators for a more comprehensive approach to high-risk assets.

Buy/Sell IndicatorBuy/Sell Indicator
Overview
The Buy/Sell Indicator is designed to help traders identify potential entry and exit points in the market using a combination of Simple Moving Averages (SMA) and the Relative Strength Index (RSI). This indicator plots buy and sell signals directly on the chart, making it easier to make informed trading decisions.
Inputs
Fast MA Length: The period for the fast-moving average. Default is 9.
Slow MA Length: The period for the slow-moving average. Default is 21.
RSI Length: The period for the RSI calculation. Default is 14.
RSI Overbought Level: The RSI level considered overbought. Default is 70.
RSI Oversold Level: The RSI level considered oversold. Default is 30.
How It Works
Moving Averages:
The indicator calculates two SMAs: a fast-moving average (fastMA) and a slow-moving average (slowMA).
The fast MA reacts more quickly to price changes, while the slow MA reacts more slowly.
RSI:
The RSI is calculated to measure the momentum of price movements.
It helps identify overbought and oversold conditions in the market.
Buy and Sell Conditions:
Buy Signal: A buy signal is generated when the fast MA crosses above the slow MA and the RSI is below the overbought level.
Sell Signal: A sell signal is generated when the fast MA crosses below the slow MA and the RSI is above the oversold level.
Plotting
Buy Signals: Displayed as green labels below the bars where the buy condition is met.
Sell Signals: Displayed as red labels above the bars where the sell condition is met.
Moving Averages: The fast MA is plotted in blue, and the slow MA is plotted in orange.

RSI with Swing Trade by Kelvin_VAlgorithm Description: "RSI with Swing Trade by Kelvin_V"
1. Introduction:
This algorithm uses the RSI (Relative Strength Index) and optional Moving Averages (MA) to detect potential uptrends and downtrends in the market. The key feature of this script is that it visually changes the candle colors based on the market conditions, making it easier for users to identify potential trend swings or wave patterns.
The strategy offers flexibility by allowing users to enable or disable the MA condition. When the MA condition is enabled, the strategy will confirm trends using two moving averages. When disabled, the strategy will only use RSI to detect potential market swings.
2. Key Features of the Algorithm:
RSI (Relative Strength Index):
The RSI is used to identify potential market turning points based on overbought and oversold conditions.
When the RSI exceeds a predefined upper threshold (e.g., 60), it suggests a potential uptrend.
When the RSI drops below a lower threshold (e.g., 40), it suggests a potential downtrend.
Moving Averages (MA) - Optional:
Two Moving Averages (Short MA and Long MA) are used to confirm trends.
If the Short MA crosses above the Long MA, it indicates an uptrend.
If the Short MA crosses below the Long MA, it indicates a downtrend.
Users have the option to enable or disable this MA condition.
Visual Candle Coloring:
Green candles represent a potential uptrend, indicating a bullish move based on RSI (and MA if enabled).
Red candles represent a potential downtrend, indicating a bearish move based on RSI (and MA if enabled).
3. How the Algorithm Works:
RSI Levels:
The user can set RSI upper and lower bands to represent potential overbought and oversold levels. For example:
RSI > 60: Indicates a potential uptrend (bullish move).
RSI < 40: Indicates a potential downtrend (bearish move).
Optional MA Condition:
The algorithm also allows the user to apply the MA condition to further confirm the trend:
Short MA > Long MA: Confirms an uptrend, reinforcing a bullish signal.
Short MA < Long MA: Confirms a downtrend, reinforcing a bearish signal.
This condition can be disabled, allowing the user to focus solely on RSI signals if desired.
Swing Trade Logic:
Uptrend: If the RSI exceeds the upper threshold (e.g., 60) and (optionally) the Short MA is above the Long MA, the candles will turn green to signal a potential uptrend.
Downtrend: If the RSI falls below the lower threshold (e.g., 40) and (optionally) the Short MA is below the Long MA, the candles will turn red to signal a potential downtrend.
Visual Representation:
The candle colors change dynamically based on the RSI values and moving average conditions, making it easier for traders to visually identify potential trend swings or wave patterns without relying on complex chart analysis.
4. User Customization:
The algorithm provides multiple customization options:
RSI Length: Users can adjust the period for RSI calculation (default is 4).
RSI Upper Band (Potential Uptrend): Users can customize the upper RSI level (default is 60) to indicate a potential bullish move.
RSI Lower Band (Potential Downtrend): Users can customize the lower RSI level (default is 40) to indicate a potential bearish move.
MA Type: Users can choose between SMA (Simple Moving Average) and EMA (Exponential Moving Average) for moving average calculations.
Enable/Disable MA Condition: Users can toggle the MA condition on or off, depending on whether they want to add moving averages to the trend confirmation process.
5. Benefits of the Algorithm:
Easy Identification of Trends: By changing candle colors based on RSI and MA conditions, the algorithm makes it easy for users to visually detect potential trend reversals and trend swings.
Flexible Conditions: The user has full control over the RSI and MA settings, allowing them to adapt the strategy to different market conditions and timeframes.
Clear Visualization: With the candle color changes, users can quickly recognize when a potential uptrend or downtrend is forming, enabling faster decision-making in their trading.
6. Example Usage:
Day traders: Can apply this strategy on short timeframes such as 5 minutes or 15 minutes to detect quick trends or reversals.
Swing traders: Can use this strategy on longer timeframes like 1 hour or 4 hours to identify and follow larger market swings.

Uptrick: RSI MA Buying/Selling signalsIndicator Purpose:
This indicator, titled "Uptrick: RSI MA Buying/Selling signals" or "UpRSIMA," aims to provide buying and selling signals based on the Moving Average (MA) of the Relative Strength Index (RSI).
It plots the RSI MA line and highlights whether the RSI MA value is above or below 50, indicating potential bullish or bearish signals, respectively.
RSI Calculation:
The script calculates the RSI using a user-defined length parameter (default is 14) and a specified source (typically the closing price).
It then computes the MA of the RSI using the Recursive Moving Average (RMA) function applied to the RSI values.
Color Representation:
The color of the RSI MA line is determined based on whether it's above or below the neutral level of 50.
If the RSI MA is above 50, indicating potential bullish signals, the color is set to green; otherwise, it's set to red for potential bearish signals.
Plotting:
The RSI MA line is plotted on the chart with the specified color based on its value relative to 50.
Additionally, a horizontal line is drawn at y = 50 to visually represent the neutral level.
Histogram bars are also added to visually represent the difference between the RSI MA and the neutral level, with green bars indicating bullish signals and red bars indicating bearish signals.
User Interface:
The indicator is designed to be used as an overlay on price charts, allowing traders to easily visualize potential buying and selling signals based on RSI MA crossovers and levels relative to 50.
Overall, the "Uptrick: RSI MA Buying/Selling signals" indicator offers traders insights into potential trend reversals or continuations based on the moving average of the Relative Strength Index, aiding them in making informed trading decisions.

buy/sell signals with Support/Resistance (InvestYourAsset) 📣The present indicator is a MACD based buy/sell signals indicator with support and resistance, that can be used to identify potential buy and sell signals in a security's price.
📣It is based on the MACD (Moving Average Convergence Divergence) indicator, which is a momentum indicator that shows the relationship between two moving averages of a security's price.
📣 The indicator also plots support and resistance levels, which can be used to confirm buy and sell signals. The support and resistance can also be used as a stoploss for existing position.
👉 To use the indicator, simply add it to your trading chart. The indicator will plot three sections:
📈 Price and Signals: This section plots the security's price and the MACD buy and sell signals.
📈 MACD Oscillator: This section plots the MACD oscillator, which is a histogram that shows the difference between the two moving averages.
📈 Moving Averages: This section plots the two moving averages that the MACD oscillator is based on.
📈 Support and Resistance: This section plots support and resistance levels, which are calculated based on the security's recent price action.
👉 To identify buy and sell signals, you can look for the following:
📈 Buy signal: When shorter Moving Average crosses over longer Moving Average.
📈 Sell signal: When shorter moving average crosses under longer moving average.
📈 You can also look for divergences between the MACD oscillator and the security's price. A divergence occurs when the MACD oscillator is moving in one direction, but the security's price is moving in the opposite direction. Divergences can be a sign of a potential trend reversal.
👉 To confirm buy and sell signals, you can look for support and resistance levels take a look at below snapshot. If a buy signal occurs at a support level, it is a stronger signal than if it occurs at a random price level. Similarly, if a sell signal occurs at a resistance level, it is a stronger signal than if it occurs at a random price level.
⚡ Here is a example of how to use the indicator to identify buy signal:
☑ Add the indicator to your trading chart.
☑Look for a buy signal when short MA crosses over Long MA.
☑Look for the buy signal to occur at a support level.
☑Enter a long position at the next candle.
☑Place a stop loss order below the support level.
☑Take profit when the MACD line crosses below the signal line, or when the security reaches a resistance level.
⚡ Here is an example of how to use the indicator to identify a sell signal:
☑Add the indicator to your trading chart.
☑Look for a sell signal, when shorter moving average crosses under longer moving average.
☑Look for the sell signal to occur at a resistance level.
☑Enter a short position at the next candle.
☑Place a stop loss order above the resistance level.
☑Take profit when the MACD line crosses above the signal line, or when the security reaches a support level.
✅Things to consider while using the indicator:
📈Look for buy signals in an uptrend and sell signals in a downtrend. This will increase the likelihood of your trades being successful.
📈Place your stop losses below the previous swing low or support for buy signals and above the previous swing high or resistance for sell signals. This will help to limit your losses if the trade goes against you.
📈Consider taking profits at key resistance and support levels. This will help you to lock in your profits and avoid giving them back to the market.
Follow us for timely updates regarding indicators that we may publish in future and give it a like if you appreciate the indicator.

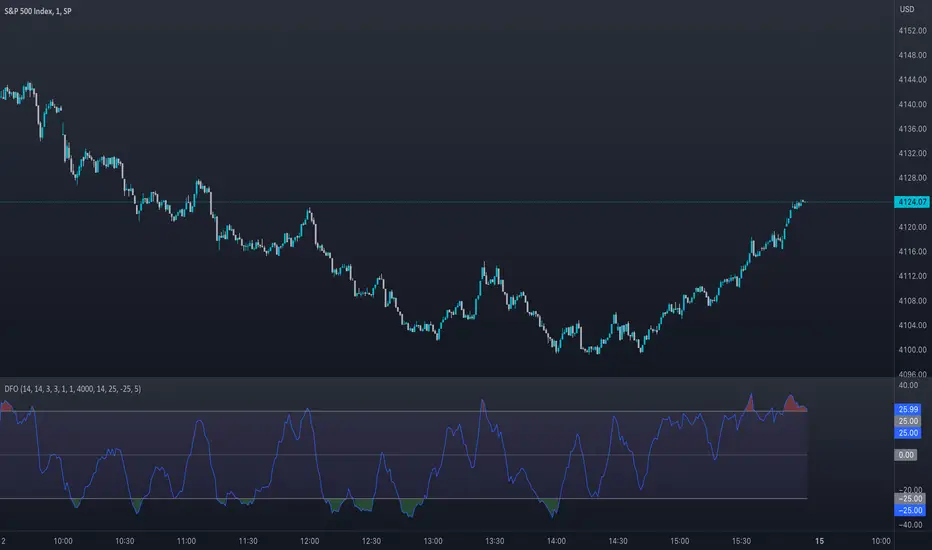
Dynamic Fusion Oscillator (DFO)The Dynamic Fusion Oscillator (DFO) is a uniquely crafted trading indicator that amalgamates the power of the Relative Strength Index (RSI) and the Stochastic Oscillator into a single, comprehensive tool. It provides traders with a more nuanced analysis of market momentum and overbought or oversold conditions. The DFO's distinctiveness lies in its ability to leverage the strengths of both RSI and Stochastic Oscillator, offering a more robust reading of market conditions. Moreover, it does so by offering a weighted approach, which combines the standardized values of both indicators. This flexibility in adjusting the weight of each component enhances its adaptability to different market scenarios, making it a versatile tool in a trader's arsenal. The following sections will delve into the intricacies of the DFO, demonstrating its advantages, usage, and applicability across various market conditions.
Differences from Existing Scripts:
The Dynamic Fusion Oscillator (DFO) is unique from other trading indicators as it combines the strengths of two popular technical analysis tools: the Relative Strength Index (RSI) and the Stochastic Oscillator. This fusion results in a dynamic, weighted oscillator that provides a more comprehensive view of the market's momentum and overbought or oversold conditions.
Usage and Market Conditions:
DFO can be used across different markets, including stocks, forex, commodities, and cryptocurrencies. It is designed to perform well in varying market conditions - trending or ranging. However, like any other technical indicator, it is advised to use it in conjunction with other technical analysis tools and not rely solely on it for making trading decisions.
Importance of Combining RSI and Stochastic Oscillator:
The RSI and Stochastic Oscillator are both momentum indicators, but they have their individual strengths and weaknesses. The RSI excels at identifying overbought and oversold conditions, while the Stochastic Oscillator is adept at predicting price reversals. By combining these two into a single oscillator, we can benefit from the strengths of both while minimizing their weaknesses. This fusion results in a more robust indicator that offers better signal quality and reliability.
Input Explanations:
RSI Length : This determines the number of periods used to calculate the RSI. A smaller value will make the RSI more sensitive to price changes, while a larger value will smooth out the RSI line.
Stochastic Length, Smooth K, Smooth D : These are parameters for calculating the Stochastic Oscillator. Length is the observation period, Smooth K is the smoothing factor for the %K line, and Smooth D is the smoothing factor for the %D line.
RSI Weight, Stochastic Weight : These determine the weights of the RSI and the Stochastic Oscillator in the final calculation. Increasing the weight of one will make the oscillator more sensitive to that component.
Standardization Length : This is the number of periods used to calculate the moving average and standard deviation for standardization purposes.
MA Length : This determines the number of periods used to calculate the moving average of the oscillator.
Upper Band Value, Lower Band Value : These set the maximum and minimum values for the oscillator. Signals are generated when the oscillator crosses these thresholds.
Number of periods above the band for alert condition : This sets the number of periods the oscillator stays above the band to trigger an alert.
Alert Conditions:
Alerts are generated under the following conditions:
Bullish Signal : An alert is generated when the Moving Average (MA) crosses above the Oscillator. This can be seen as a potential bullish signal indicating an upward price trend.
Bearish Signal : An alert is generated when the MA crosses below the Oscillator. This can be seen as a potential bearish signal indicating a downward price trend.
Oscillator above/below upper/lower band : Alerts are also generated when the oscillator has been above the upper band or below the lower band for a specified number of periods. This could signal overbought or oversold conditions, respectively. These signals can help traders identify potential reversal points in the market.
These alerts can help traders by providing timely signals for potential trading opportunities. However, they should be used as part of a comprehensive trading strategy that also takes into account other technical and fundamental factors.
Black RSI (Pro Suite)Black RSI (Pro Suite) is combination of RSI (Relative Strength Index), Volume RSI, Heikin Ashi RSI & other multi Oscillators with multi features into one indicator, features like (Quad Divergences, Multi Time Frame RSI, MTF RSI Panel, Oscillator Support/Resistance/Wedges/Trendlines, Oscillator Moving Average/BBs, Smooth RSI, RSI Price Estimator, Oscillator Over bought/sold Bars, Osc OB/OS Zones, Osc OB/OS Highlights, additionally Black RSI indicator is flexible & completely customizable).
Indicator goal: I have tried my best to organized RSI & other suitable oscillators and oscillator useful tools into one simple and free indicator for Tradingview users (specifically for Tradingview 'basic' subscription users). suggestions are always welcome. please give feedback & appreciate if you like my work.
Black RSI Indicator Features Summary:
Black RSI indicator includes many features mainly relevant to RSI and other Oscillators, these are briefly highlighted below:
Black RSI Dashboard
Multi Oscillators: Choose between multiple oscillators. All oscillators settings are customizable.
Multi Symbol: Multi Symbol Support, applicable on all oscillators
RSI (Relative Strength Index)
VRSI (Volume Relative Strength Index)
HA RSI (Heikin Ashi Relative Strength Index)
OBV (On Balance Volume)
CVD (Comulative Volume Delta)
MFI (Money Flow Index)
UO (Ultimate Oscillator)
MOM (Momentum Oscillator)
ATR (Average True Range)
Stoch (Stochastic Oscillator)
Stoch RSI (Stochastic RSI)
Oscillator Primary Tools ◢
Oscillator Moving Average/Bollinger Bands
Smooth RSI
Multi Timeframe RSI
Multi Timeframe RSI Panel
RSI Price Estimator
Oscillator Support/Resistance/Wedges/Trendlines
Oscillator Moving Average/BBs: Shows Moving Average for selected oscillator.
Smooth Smooth: Smooths out RSI
Multi Timeframe RSI: Displays Multiple Time Frame/Multiple Symbol RSI and converts it and shows it as it is in current time frame without effecting Primary RSI
Multi Timeframe RSI Panel: Displays Multiple Time Frame/Multiple Symbol RSI values of user input specific timeframes in compact panel (max 8 Time frames)
RSI Price Estimator: Calculates RSI estimate price values of 3 different user specific RSI input levels, RSI x MA cross price and RSI future value of user specific price input level.
Oscillator Support/Resistance/Wedges/Trendlines: Draws Trendlines, Wedges and Support & Resistance lines on selected oscillator
Oscillator Quad Divergence ◢
1st Oscillator Divergence: Traditional divergence indicator with enhancements & customization
2nd Oscillator Divergence: Traditional divergence indicator with enhancements & customization
3rd Oscillator Divergence: Advanced Divergence indicator with source selection, RSI/Price threshold, potential divergences & customization
4th Oscillator Divergence: Pivots divergence indicator with flexible pivots selection & customization
Regular bullish divergences are indicated when price is forming lower lows while an oscillator shows higher lows.
Regular bearish divergences are indicated when price is forming higher highs while an oscillator shows lower highs.
While regular divergences indicate trend reversals, hidden divergences indicate a trend continuation.
When the price is making higher lows and the oscillator is showing lower lows, we speak of a bullish hidden divergence.
When the price is making lower highs and the oscillator shows higher highs, it's a bearish hidden divergence.
Oscillator Secondary Tools ◢
Oscillator HH/LL pivots
Osc OB/OS Color Bars
Osc OB/OS Zones
Osc OB/OS Highlights
Background
Oscillator HH/LL pivots: Shows HH/LL pivot points on selected oscillator
Osc OB/OS Color Bars: Plots color chart bars based on RSI, MFI, Stochastic, Stochastic RSI or combine overbought/oversold conditions
Osc OB/OS Zones: Plots Osc OB/OS Zones with user input levels
Osc OB/OS Highlights: Highlight oscillator OB/OS background area
Background: background color customization
+ Primary RSI Settings ▾
- Primary RSI Length: User input RSI Length value
- Primary RSI Source: User RSI Source selection
- RSI Overbought Threshold: Allows the user to set the RSI overbought threshold value. This Overbought Threshold value will also be applied on "RSI Divergence overbought condition", "RSI OB Color Bars" and "Primary RSI Color Schemes
- RSI Oversold Threshold: Allows the user to set the RSI oversold threshold value. The lower band (oversold line) of RSI. This Oversold Threshold value will also be applied on "RSI Divergence oversold condition", "RSI OS Color Bars" and "Primary RSI Color Schemes
- RSI Middle Band: Allows the user to set the RSI middle band value. This value will also applied to "Center Line" color scheme from "Primary RSI Color Schemes" drop menu
- Primary RSI Colors:
Range color specifies a gradient of colors from the overbought to the oversold threshold user inputs from "Primary RSI" section. Color interpolation also a gradient but smoother than Range color. Center Line is similar but is not a gradient, linked to Middle Band ("Primary RSI" section) and changes color with RSI Middle Band. Traditional is simple with Overbought and Oversold colors change.
- RSI Bullish Band: Allows the user to plot extra/optional RSI band on RSI Oscillator (Note: it will not be plotted if "OB/OS Zone only" enabled from "OB/OS Zone Settings" section)
- RSI Bearish Band: Allows the user to plot extra/optional RSI band on RSI Oscillator (Note: it will not be plotted if "OB/OS Zone only" enabled from "OB/OS Zone Settings" section)
+ Primary RSI Smooth Settings ▾
- Smooth Moving Average Type: User selected Smooth MA type. With RSI Smooth enabled, will also effect all RSI Divergences detection (all divergences will be plot according to "Smoothed RSI line")
- Smooth Moving Average Length: User input Smooth MA length value
+ Oscillator Moving Average Settings ▾
- Osc Moving Average Colors: Allows user to select Bullish/Bearish colors of Oscillator Moving Average
- Osc Moving Average Type: Allows user to select Oscillator MA Type
- Osc Moving Average Length: User input Oscillator MA length value
- Osc Moving Average Thickness: User input Oscillator MA thickness
- BB StdDev: user input Bollinger Bands standard deviation value
+ Stochastic Oscillator Settings ▾
- Same as Traditional/Default indicator
+ Stochastic RSI Oscillator Settings ▾
- Same as Traditional/Default indicator
+ Money Index Flow Settings ▾
- Same as Traditional/Default indicator
+ Ultimate Oscillator Settings ▾
- Same as Traditional/Default indicator
+ Momentum Oscillator Settings ▾
- Same as Traditional/Default indicator
+ Average True Range Settings ▾
- Same as Traditional/Default indicator
+ Multi Timeframe RSI Settings ▾
- MTF RSI Time Frame: Allows user to select MTF RSI Time Frame
- MTF RSI Symbol: Allows user to select MTF RSI Time Symbol
- MTF RSI Length: User input MTF RSI length value
- MTF RSI Source: User selected MTF RSI source
- MTF RSI Line Width: User input MTF RSI line thickness value
- Number of Bars for MTF RSI plot
- MTF RSI Color > OB color > OS color : Allows user to select MTF RSI color with additionally Overbought/Oversold colors
+ MTF RSI Panel Settings ▾
- Select MTF RSI Type: If "Primary RSI" or "Volume RSI" selected MTF RSI Panel will show output values based on "Primary RSI" or "Volume RSI" parameters e.g. source, length, but without smooth.
- MTF RSI Panel Symbol: Allows user to select MTF RSI Panel symbol, leave symbol blank or uncheck "checkbox" for current chart symbol
- Show Symbol in Panel: Shows symbol ticker(current or user selected) in MTF RSI Panel
- Panel Background: Allows user to select MTF RSI Panel Background (enable/disable) and Background color selection
- TF1: MTF RSI Timeframe 1 user selection
- TF2: MTF RSI Timeframe 2 user selection
- TF3: MTF RSI Timeframe 3 user selection
- TF4: MTF RSI Timeframe 4 user selection
- TF5: MTF RSI Timeframe 5 user selection
- TF6: MTF RSI Timeframe 6 user selection
- TF7: MTF RSI Timeframe 7 user selection
- TF8: MTF RSI Timeframe 8 user selection
- Panel Top Offset: MTF RSI Panel offset input value
- Position: MTF RSI Panel position selection
- Text Size: MTF RSI Panel text size selection
- Bullish Colors: MTF RSI Panel bullish color selection. (Bullish colors range RSI >75, <75 to >65, <65 to >55)
- Bearish Colors: MTF RSI Panel bearish color selection. (Bearish colors range RSI <45 to >35, <35 to >25, <25)
+ RSI Price Estimator Settings ▾
- Price 1: User input value for RSI future price
- Price 2: User input value for RSI future price
- Price 3: User input value for RSI future price
- Panel Position Offset: User input value for panel position offset
- Price Decimals: User input value for output price decimals in panel
- Show RSI/OscMA cross Price: Enable/Disable RSIxOscillator MA cross future price
- Show RSI Level for Input Price: User input price for future RSI level
- Invisible Background: Enable/Disable Background
Auto Text Color > Auto color change of Panel text according to Dark/Light chart theme
+ Oscillator Support/Resistance Settings ▾
- Show Support line: Allows user to Enable/Disable Oscillator support line
Color > Auto Color: Auto color change of support line according to Dark/Light chart theme
- Show Resistance line: Allows user to Enable/Disable Oscillator resistance line
Color > Auto Color: Auto color display of resistance line according to Dark/Light chart theme
- Lookback lows/highs: User input of Lookback lows/highs value
- Distance threshold: Distance from the line to the low
- Line touch points: Number of points that have to be around the line
- Low/High left bars: User input of Low/High left bars value
- Low/High right bars: User input of Low/High right bars value
- Line style: User selection of line style
- Line thickness: User input of line thickness value
+ Oscillator 1st Divergence Settings ▾
- Divergence Source: User selection of divergence source. "High/Low" (high/low of oscillator/price divergence detection), "Close" (close of oscillator/price divergence detection) and "Both" (Both Close + High/Low of oscillator/price divergence detection). (Note: Traditional Divergence indicator default source is "High/Low")
- Pivot Lookback Right: How many candle to compare on the right side of a candle when deciding whether it is a pivot. The lower the number is, the earlier pivots (and therefore divergences) will be signaled, but the quality of those detections could be lower.
- Pivot Lookback Left: How many candle to compare on the left side of a candle when deciding whether it is a pivot. The lower the number is, the earlier pivots (and therefore divergences) will be signaled, but the quality of those detections could be lower.
- Divergence Max Length (Bars): The maximum length of a divergence (number of bars). If a detected divergence is longer than this, it will be discarded
- Divergence Min Length (Bars): The minimum length of a divergence (number of bars). If a detected divergence is shorter than this, it will be discarded
- Show Divergence as:
- Line Thickness: User input divergence line thickness value
- Label Transparency: it could reduce labels mess on oscillator line, input "100" for label text only without label background
- Labels Text Color: User label text color selection
Auto Text Color > Auto color change of label text according to Dark/Light chart theme
- Bull Divergences: Enable/Disable of Bull divergences
> Color: User selection of Bull divergence color
> Oversold only: It will show Regular Bullish RSI divergences in oversold zone only, RSI oversold threshold can be configure in "Primary RSI Settings" section.
- Bear Divergences: Enable/Disable of Bear divergences
> Color: User selection of Bear divergence color
> Overbought only: It will show Regular Bearish RSI divergences in overbought zone only, RSI overbought threshold can be configure in "Primary RSI Settings" section.
- Hidden Bull Div: Enable/Disable of Hidden Bull divergences
> Color: User selection of Hidden Bull divergence color
- Hidden Bear Div: Enable/Disable of Hidden Bear divergences
> Color: User selection of Hidden Bear divergence color
+ Oscillator 2nd Divergence Settings ▾
- Same as Oscillator 1st Divergence Settings
+ Oscillator 3rd Divergence Settings ▾
- Divergence source: User selection of divergence source . "oscillator" (divergence detection with high/low or close of selected oscillator), "price" (divergence detection with high/low or close of price)
- Bull price source: User selection of Bull price source. Bull price source: "Low" (low of price divergence detection), "Close" (close of price divergence detection) (linked to "price" in "Divergence source")
- Bear price source: User selection of Bear price source. Bear price source: "High" (high of price divergence detection), "Close" (close of price divergence detection) (linked to "price" in "Divergence source")
- Low/High left bars: How many candle to compare on the left side of a candle when deciding whether it is a pivot. The lower the number is, the earlier pivots (and therefore divergences) will be signaled, but the quality of those detections could be lower.
- Low/High right bars: How many candle to compare on the right side of a candle when deciding whether it is a pivot. The lower the number is, the earlier pivots (and therefore divergences) will be signaled, but the quality of those detections could be lower.
- Maximum lookback bars: The maximum length of a divergence (number of bars). If a detected divergence is longer than this, it will be discarded.
- Price threshold: User selection of Price threshold, higher values more lines
- RSI threshold: User selection of RSI threshold, higher values more lines
- Show Lows: Displays lows of RSI
- Show Highs: Displays highs of RSI
- Show Divergence as:
- Line Style:
- Line thickness: User input divergence line thickness value
- Label Transparency: it could reduce labels mess on oscillator line, input "100" for label text only without label background
- Labels Text Color: User label text color selection
Auto Text Color > Auto color change of label text according to Dark/Light chart theme
- Bull Divergences: Enable/Disable of Bull divergences
> Color: User selection of Bull divergence color
> Potential Bull: It will plot potential regular bull divergence with dotted line.
- Bear Divergences: Enable/Disable of Bear divergences
> Color: User selection of Bear divergence color
> Potential Bear: It will plot potential regular bear divergence with dotted line.
- Hidden Bull Div: Enable/Disable of Hidden Bull divergences
> Color: User selection of Hidden Bull divergence color
> Potential H.Bull: It will plot potential hidden bull divergence with dotted line.
- Hidden Bear Div: Enable/Disable of Hidden Bear divergences
> Color: User selection of Hidden Bear divergence color
> Hidden Bear divergence: It will plot potential hidden bear divergence with dotted line.
> Regular Bull oversold only: It will show Regular Bullish RSI divergences in oversold zone only, RSI oversold threshold can be configure in "Primary RSI Settings" section.
> Regular Bear overbought only: It will show Regular Bearish RSI divergences in overbought zone only, RSI overbought threshold can be configure in "Primary RSI Settings" section.
+ Oscillator 4th Divergences Settings ▾
- Upper Length: User pivot input value of draw upper divergence line From
- To Pivot:
- Lower Length: User pivot input value of draw lower divergence line From
- To Pivot:
- Show Divergence as:
- Line Style:
- Line thickness: User input divergence line thickness value
- Label Transparency: it could reduce labels mess on oscillator line, input "100" for label text only without label background
- Labels Text Color: User label text color selection
Auto Text Color > Auto color change of label text according to Dark/Light chart theme
- Bull Divergences: Enable/Disable of Bull divergences
> Color: User selection of Bull divergence color
- Bear Divergences: Enable/Disable of Bear divergences
> Color: User selection of Bear divergence color
- Regular Bull oversold only: It will show Regular Bullish RSI divergences in oversold zone only, RSI oversold threshold can be configure in "Primary RSI Settings" section.
- Regular Bear overbought only: It will show Regular Bearish RSI divergences in overbought zone only, RSI overbought threshold can be configure in "Primary RSI Settings" section.
+ Oscillator HHLL Pivots Settings ▾
- Pivot Length: User input value of HH/LL pivot length
> L.Text Color: User label text color selection
- HH color: User HH Label color selection
- HL color: User HL Label color selection
- LH color: User LH Label color selection
- LL color: User LL Label color selection
+ Oscillator OB/OS Colored Bars Settings▾
- Overbought/Oversold Bars Oscillator: Plots Overbought/Oversold color bars based on RSI, MFI, Stoch, Stoch RSI overbought/oversold threshold conditions separately or combined(when every oscillator reach its OB or OS threshold condition at same time).
- Overbought Bar Color: User RSI OB Bars color selection
- Oversold Bar Color: User RSI OS Bars color selection
+ Primary RSI Range Color ▾
- OB: Overbought Color
- OS: Oversold Color
- Bullish: Bullish Color
- Bearish: Bearish Color
+ Primary RSI Color interpolation ▾
- RSI Color: RSI Color
- OB: Overbought Color
- OS: Oversold Color
+ Primary RSI Center Line Color ▾
- OB: Overbought Color
- Bullish: Bullish Color
- Bearish: Bearish Color
- OS: Oversold Color
+ Primary RSI Traditional Color ▾
- RSI Color: RSI Color
- OB: Overbought Color
- OS: Oversold Color
Osc Overbought/Oversold Zones Settings ▾
- OB/OS Zone Band Lines: Enable/Disable OB/OS Zone Band Lines
- OB/OS Zones only: Only shows OB/OS Zones and disable all RSI band lines except Middle Band. Background will not be effected by this setting.
- Overbought Zone: User input value of Overbought Zone from
> To:
- Oversold Zone: User input value of Oversold Zone from
> To:
Osc Overbought/Oversold Highlights ▾
- Overbought Highlights : Enable/Disable Overbought Highlights
- Oversold Highlights : Enable/Disable Oversold Highlights
- Transparency: Gradient transparency of highlighted area
+ 'Oscillators Color Settings ▾
- Show Osc Symbol label : Enable/Disable of oscillator symbol label. Displays current oscillator symbol, but with "Override Oscillator Symbol" enabled from "Black RSI Dashboard" it will Auto/forcefully displays Override Oscillator Symbol on Oscillator
- Fade out Oscillator line: Fade out the oscillator line color, focusing only the most recent periods prominent for a clearer chart
- Fill Stoch/StochRSI lines: Fills Stoch/Stoch RSI lines
- Oscillator line thickness: user input value of oscillator line thickness
- Oscillator line offset: Shifts the oscillator to the left or to the right on the given number of bars, Default is 0
- OBV Color
- MFI Color
- ATR Color
- UO Color
- MOM Color
- CVD Bullish Color
- CVD Bearish Color
+ Background Setting ▾
- Custom Background Color: User selection of Background color
Authors & Credits: I'd like to THANK to Nabeel Black(myself), LonesomeTheBlue, iFuSiiOnzZ, jmosullivan, zdmre, creengrack, and TradingView for the locally sourced ingredients.
Disclaimer: DYOR. Not financial advice. Not a trading system. I am not affiliated with TradingView or any authors mentioned here; You alone have the sole responsibility of evaluating the script output and risks associated with the use of the script. Trading success is all about following your trading strategy and the indicators should fit within your trading strategy, and not to be traded upon solely. Always trade with confluence and Risk Management.
Feedback & Bug report
if you found any bug in this indicator or any suggestion, please let me know. Please give feedback & appreciate if you like to see more future updates and indicators. Thank you

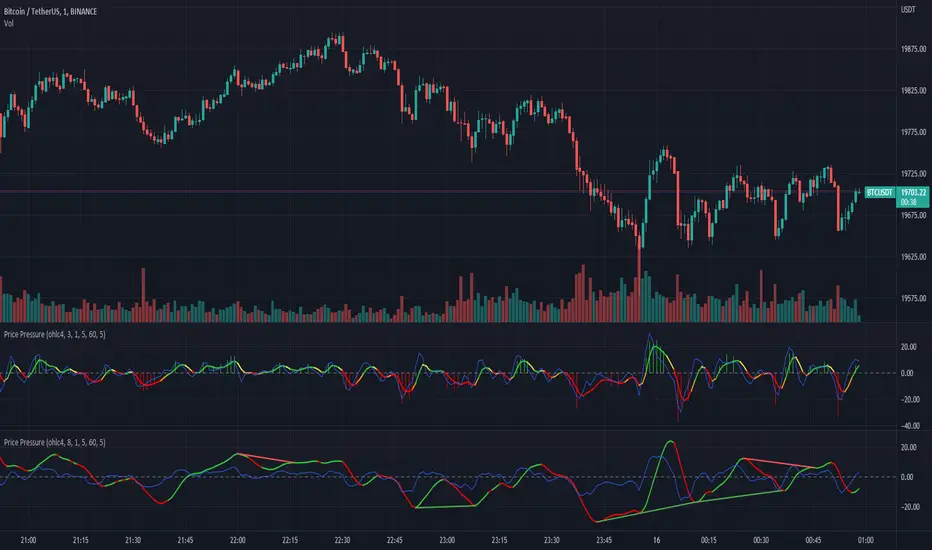
Price PressureThe Price Pressure indicator shows directional price movement similar to how MACD works but rather than showing the difference between 2 moving averages of different lengths it shows the changing behaviour of different types of moving averages of the same length.
Price spike pressure outside the moving high and lows can also be shown and divergence detection can be enabled.
There are multiple modes of colouring:-
4 colour mode off (based on fast MA crossing slow MA)
- green: up
- red: down
4 colour mode on (based on fast MA crossing slow MA and slowing fast MA)
- green: up
- yellow: weakening up
- red: down
- orange: weakening down
fast mode (only uses the fast MA direction)
- green: up
- red: down
Volume Analysis*Sourced code from Volume Flow v3 by oh92 for Bull\Bear volume flow calculations. Thank you so much for your engineering skills!
This indicator integrates the Ma-over-MA crossover strategy in oh92's V3 DepthHouse calculation with a volume-over-MA
calculation to further narrow down "Areas of Interest" levels for a potential re-test zone to the right of the chart.
I added a Moving Average calculation for a multi-level cloud and further broke down more conditions to highlight both
volume flow crossover on the High and Extreme High MA's and also high and extreme high volume spikes on set period average
without bull\bear conditions. Original Bull/Bear Spikes are still viewable although that was the only plot from oh92's script
that was integrated.
Session backgrounds set for research purposes.
Please note: Setting MA Cloud to "None" will remove all plots calculated with the MA Cloud from the chart entirely. Turn off visuals
in the Style tab.

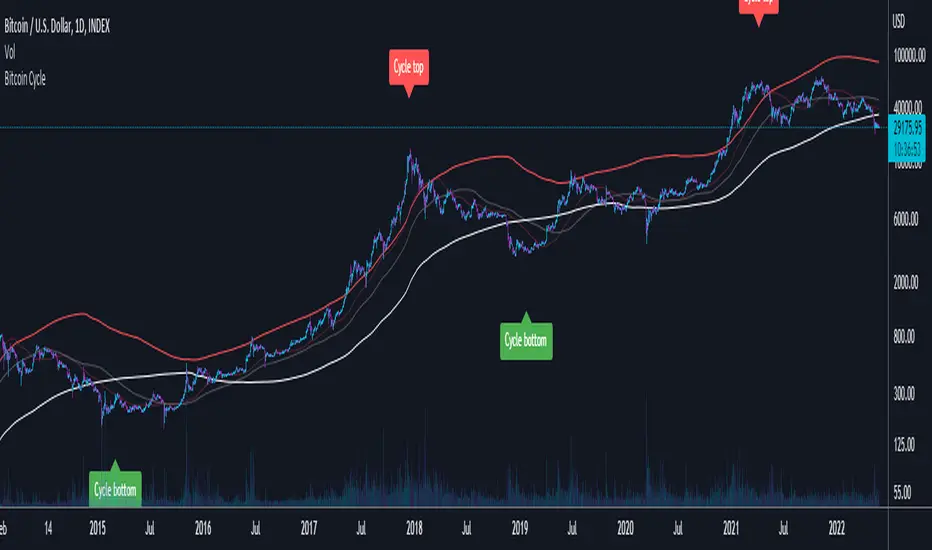
Bitcoin CycleThis script displays 4 different Moving Averages:
2 Year Moving Average (White)
1 Year Moving Average (Doubled in value, Red)
116 Day Moving Average (Transparent, Red)
232 Day Moving Average (Transparent, White)
For the last cycles: once the 2 year MA crossed the 232 Day MA, it marked the cycle bottom within a few days and once the 1 year MA (x2) crossed the 116 Day MA, it marked the cycle top within a few days.
It is interesting to note that both 365/116 and 730/232 equal 3.1465, which is very close to Pi (3.142). It is actually the closest we can get to Pi when dividing 365 by another whole number.
Trend MasterThis is a trend aggregator for confirmation and trend signals. It basically aggregates many buy/sell signals and confirmation and by combining them provides a strong buy/sell signal or trend confirmation.
The actual layout idea and trend confirmation is derived from Trend Meter and this indicator uses few other indicator, such as Chandelier Exit, WaveTrend, QQE Signals, Parabolic SAR and AlphaTrend. This indicator aggregates signal from different methods to find out more powerful and confirmed Trend and combines them into one Signal. It also uses Technical Ratings from TradingView team to filter out false signal, it tremendously opts out false signals and improve profitability.
The first seven dots are these
All 3 Trend Meters Now Align
MACD Crossover - Fast - 8, 21, 5
RSI 13: > or < 50
RSI 5: > or < 50
MA Crossover
MA Crossover
Chaikin Money Flow
Alphatrend
Technical Ratings
Then trend
Chandelier Exit
WaveTrend
QQE Signals
Parabolic Sar
All 3 Trend Meters aligns and A signal from trend i
Instructions
Change buy/sell policy based on market trend
Works on all TimeFrame but gives more accuracy on 4H, 1D.
Buy when green big dot appears at the bottom.
Sell when red big dot appears at the bottom.
Red/green dot at the top line appears when three trend meter is aligned and this is a good confirmation.
Any red/green dot below horizontal bars are trend signals.
Big red/green got at the bottom appears whenever there's a good confirmation from trend meter and a buy/sell signal comes from any trend signals.
Also look on the technical ratings bar, green means buy, red means sell and yellow means neutral.
Look for Support or Resistance Levels for price to be attracted to.
Find confluence with other indicators.
The more Trend meters are lit up the better.
Alert
01 Buy Signal = Strong Buy Signal
02 Sell Signal = Strong Sell Signal
03 Buy Signal = Strong Buy Signal
04 Sell Signal = Strong Sell Signal
Thanks to TradingView Technical Ratings authors, evergot, Lij_MC, KivancOzbilgic for their work. This indicator was heavily inspired from their work.

ALMA cross signal by hk4jerry<< ALMA CROSS signal >>
*NONE REPAINT STRATEGY*
--As a result of testing for a month, using alma does not result in repainting--
--ALMA 크로스 결과는 한달간의 테스트 결과, 리페인팅되지 않습니다--
(ENGLISH description O)
==NOTE==
1. MA 크로스 지표는 잘못된 신호들이 자주 등장합니다. 정확성을 더 높일수 있는 방법은 없을까 고민을 해봤습니다. 더 낮은 가격에 매수하고, 더 높은 가격에서 매도하는 것이 중요했습니다. 우리가 흔히 저점, 고점을 알아내기 위한 지표이자, 선행지표인 RSI를 추가하는 방법을 연구했습니다.
2. 예를 들어, MA 크로스 매수 신호가 발생했을때, rsi값이 50이면 가격이 더 떨어질 가능성이 큽니다. 하지만, rsi값이 30이하인 경우에만 매수 신호가 발생한다면, 그 가격이 저점일 확률이 매우 높아지는 원리 입니다.
3. 신호는 확률입니다. 트레이딩에 100%는 없습니다. 그 확률을 높이는 것은 리스크 관리 입니다. 분할 매수 관점으로 포지션을 잡으시거나, 단기 매매로 가져가시는걸 추천드립니다.
==rsi ma source 설정==
1. 'rsi ma' 값의 소스입니다.
2. 'rsi 길이' 는 값이 클수록 더욱 정확한 시그널이 발생합니다.
3. EMA 길이가 짧을수록 더 많은 시그널이 발생합니다. 그러나, 정확도는 떨어집니다.
==rsi ma 설정==
1. rsi를 source로한 EMA입니다.
2. rsi와 유사한 성격을 가집니다.
3. 'rsi ma' 값이 30이하이면 과매도, 70이상이면 과매수 입니다.
4. ' rsi ma long value' 이 30이면 매수 신호가 rsi ma 값이 30 이하인 경우에만 발생함을 의미 합니다.
5. "rsi ma short value' 가 70이면 매도 신호가 rsi ma 값이 70 이상인 경우에만 발생함을 의미 합니다.
==rsi 설정==
1. 실제 rsi(14,close) 값을 의미합니다.
2. rsi ma value와 비슷한 기능입니다.
3. rsi 길이가 14이므로, 값은 40~50 사이가 적당합니다.
4. 30 또는 70으로 설정할 시, 신호가 거의 발생하지 않습니다.
(ENG)
==NOTE==
1. MA cross indicator often shows false signals. I was wondering if there is a way to increase the accuracy further. It was important to buy at a lower price and sell at a higher price. We studied how to add RSI, which is a leading indicator and an indicator to find lows and highs, often.
2. For example, when a buy MA cross signal occurs, if the rsi value is 50, the price is more likely to fall. However, if a buy signal occurs only when the rsi value is below 30, the probability that the price is at the bottom is very high.
3. A signal is a probability. There is no 100% in trading. Increasing that probability is risk management. It is recommended to hold a position from the perspective of a split buy or take it as a short-term trade.
==rsi ma source option==
1. The source of the 'rsi ma' value.
2. The larger the 'rsi length' value, the more accurate the signal is generated.
3. Shorter EMA lengths produce more signals. However, the accuracy is reduced.
==rsi ma options==
1. EMA with rsi as the source.
2. It has similar characteristics to rsi.
3. If the 'rsi ma' value is below 30, it is oversold, and if it is above 70, it is overbought.
4. If 'rsi ma long value' is 30, it means that a buy signal will only occur when the rsi ma value is less than or equal to 30.
5. If "rsi ma short value' is 70, it means that a sell signal will only occur when the rsi ma value is above 70.
==rsi option==
1. It means the actual rsi(14,close) value.
2. This function is similar to rsi ma value.
3. Since the rsi length is 14, a value between 40 and 50 is appropriate.
4. When set to 30 or 70, almost no signal is generated.

EMA/MA Cross + BB + Alerts Short hand notes - I made this for friend and I. Unsure how to share it with him so made it public.
u/ tmyerskerry for the math on slope and look back period (look back period isn't perfect for slope calculation as 200ma is slow moving so some signals are goign to be strong instead of weak and visa versa. If you know a better way than i'm all ears!
Can set mutliple EMA's and MA's.
Default BB built in. Couldn't figure out how to set default shadow transparency so you will have to turn it down.
Added red and green lines that indicate when price has gone above and below the BB shadow.
Added arrows for when EMA1 crosses EMA2. Right now set for 9 + 32. And depending on MA200 color changes if its with the trend or against.
Alerts in the works. (please don't ask for them as i'm doing this part time and don't know pinescript)

Moving Average Trend█ OVERVIEW
This is a Moving Average Script that contains both a cloud and a ribbon that has independent MA-type selection.
⬆ green arrow up = up trend flip
⬇ red arrow down = down trend flip
🟢 Green Dot = Potential Long
🔴 Red Dot = Potential Short
█ CONCEPTS
1 — Cloud, like most trading algo, the cloud is made of 8 short term MA , with MA cross and MA cross (longema)
2 — Ribbon, this is by default turned off, the default values , an option in setting to change longema to look for ribbon cross
3 — Sequence, It goes from 1 – 9 at 9 the sequence resets. The sequence changes colour depending on if it’s a down trend(red) or uptrend(green) or an over extended trend (yellow)
Setup definitions
Red sell start = current close < the close 4 candles back
Yellow sell extended = current close < last close and current close < two closes back
Green buy start = current close > the close 4 candles back
Yellow buy extended = current close last close and current close < two closes back
This can help you find when it’s time to get out, or sit out of a choppy trend.
4 - Moving Average types:
sma = Simple Moving Average
ema = Exponential Moving Average
wma = Weighted Moving Average
vwma = Volume Weighted Moving Average
rma = Running Moving Average
alma = Arnaud Legoux Moving Average
hma = Hull Moving Average
jma = Jurik Moving Average
frama-o = frama
frama-m = frama mod
dema = Double Exponential Moving Average
tema = Triple Exponential Moving Average
zlema = Zero lag Exponential Moving Average
smma = Smoothed Moving Average
kma = kaufman Moving Average
tma = triangular Moving Average
gmma = Geometric Mean Moving Average
vida = Variable Index Dynamic Average
cma = Corrective Moving average
rema = Range Exponential Moving average
█ OTHER SECTIONS
• FEATURES: to describe the detailed features of the script, usually arranged in the same order as users will find them in the script's inputs.
• HOW TO USE
• LIMITATIONS: Like with any MA script there is a lag factor associated with is.
• RAMBLINGS: Experiment to your hearts content with all the MA types, I'm impartial to HMA as is
• NOTES: some of the MA's are more taxing, therefore take longer to load, be patience, this is a trimmed down version of an existing invite only script i have
RedK_MAGicWAVe_v3: Improved Visual & Code RevampI have been planning to re-write the MAGicWAVe script for a long time, so here's a totally revamped version.
What is the MAGic WAVe ?
- this is one of my first indicators - and is a constant in my trading charts ...
- It's really a simple idea that plays with weighted moving averages (WMA) to produce a low-lag MAGnified Weighted Average (hence the name MAGic WAVe) - that enables me to better visualize how the momentum of the price move changes and when a change in trend is to be expected.
see link to the TA series below for more info.
- This simple concept can then be utilized in trading in a similar way to a basic MA Crossover approach, with the added benefit of the ability to magnify the trend moves
- you can also think of this as a MACD plotted on the price chart - in fact if you add a MACD to the chart and compare to the WAVe, you will see exactly what i mean.
What are the improvements in this new version
- better visualization, removed a lot of the clutter from previous versions
- the WAVe code was re-written to produce a "smoother" WAVe line.
note that the WAVe line in this version is also "lazier" than the previous version .. we need to set length to around 7 to match a 10 in v2 due to the increased lag caused by the smoothing.
- introduced the cloud fill to act as additional visual clue - introduced a WAVe "depth" variable - which will grow/shrink the fill area as preferred for improved visual.
- kept the optional slow EMA filter line set by default to 50EMA
here's a comparison of MAGic WAVe v3 (top panel) vs the older version (lower panel)
can be used with any timeframe and any instrument .. adjust settings as needed to suit the trader's own style.
- i'm not a big fan of alerts and always prefer "less signals" than "too many signals" in trading, so i don't think i will add alerts to this script in future.
Please feel free to use and comment. good luck!

Binance 2MA CrossBinance default 2 MA Cross.
Binance is the largest crypto trading platform nowadays.
Most people are using default settings.
Somehow these settings would perform better than other length pairs.
BUY/SELL Moving Average StrategyThis script allows you to use 2 moving averages a slow and a fast MA (e.g. 200 & 50). You are able to define the length of both MA and you can change the moving average type: Simple Moving Average (SMA) or Exponential Moving Average (EMA). The script will plot a SELL signal if the slow MA crosses over the fast MA and it will plot a BUY signal if the slow MA crosses under the fast MA. You are also able to define alerts for the BUY & SELL signals.
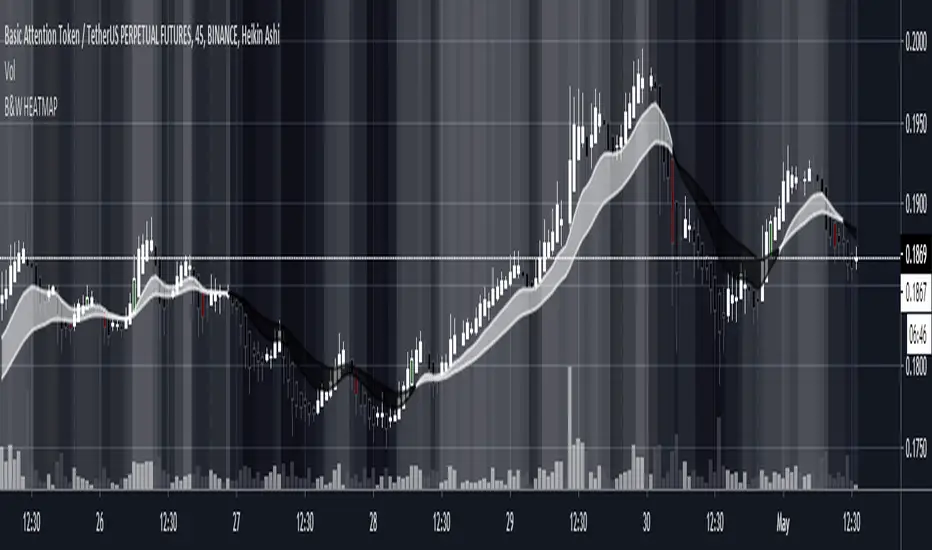
B&W HEATMAP
A Black and white heatmap (you can change to any colors in settings) overlay for better trend analysis. Use the crossovers to determine directional bias. Can be used with any other MA cross, baseline, or trendline strategies to help decide if a trade is worth taking. The gradient from black to white represent the strength of the trend . Black = Downtrend, White = Uptrend, Gray=range/chop. Candle colors indicate potential Long/Short
3MA CROSS with long(buy)/short(sell) alertsSimple triple MA cross script with LONG/SHORT (BUY/SELL) alerts as green and red arrows. Great for BTC and any chart.
My default it uses 20,50 and 100 EMA crosses and also indicates it with green/red circles on the chart.
