Low Lag Exponential Moving AverageThis is a low-lag EMA, colorized to help identify turn around points. You have the option of making it adaptive as well, different methods
of signal processing or simply an average of the two.
See my previous script to understand how these adaptive methods work
"low" için komut dosyalarını ara

Session High-Low Box,
Session High-Low Box Session High-Low Box indicatorSession High-Low BoxSession High-Low BoxSession High-Low BoxSession High-Low BoxSession High-Low BoxSession High-Low BoxSession High-Low BoxSession High-Low BoxSession High-Low BoxSession High-Low BoxSession High-Low BoxSession High-Low BoxSession High-Low BoxSession High-Low BoxSession High-Low BoxSession High-Low BoxSession High-Low BoxSession High-Low BoxSession High-Low BoxSession High-Low BoxSession High-Low BoxSession High-Low Boxwrtvtrvwrtv4v2tr2Session High-Low Box24v2v2Session High-Low Box
Long and Short Term Highs and LowsLong and Short Term Highs and Lows
Overview:
This indicator is designed to help traders identify significant price points by marking new highs and lows over two distinct timeframes—a long-term and a short-term period. It achieves this by drawing optional channel lines that outline the highest highs and lowest lows over the chosen time periods and by plotting visual markers (triangles) on the chart when a new high or low is detected.
Key Features:
Dual Timeframe Analysis:
Long Term: Uses a user-defined “Time Period” (default 52) and “Time Unit” (default: Weekly) to determine long-term high and low levels.
Short Term: Uses a separate “Time Period” (default 50) and “Time Unit” (default: Daily) to compute short-term high and low levels.
Optional Channel Display:
For both long and short term periods, you have the option to display a channel by plotting the highest and lowest values as lines. This visual channel helps to delineate the range within which the price has traded over the selected period.
New High/Low Markers:
The indicator identifies moments when the highest high or lowest low is updated relative to the previous bar.
When a new high is established, an up triangle is plotted above the bar.
Conversely, when a new low occurs, a down triangle is plotted below the bar.
Separate input toggles allow you to enable or disable these markers independently for the long-term and short-term setups.
Inputs and Settings:
Long Term High/Low Period Settings:
Show New High/Low? (STW): Toggle to enable or disable the plotting of new high/low markers for the long-term period.
Time Period: The number of bars used to calculate the highest high and lowest low (default is 52).
Time Unit: The timeframe on which the long-term calculation is based (default is Weekly).
Show Channel? (SCW): Toggle to display the channel lines that connect the long-term high and low levels.
Short Term High/Low Period Settings:
Show New High/Low?: Toggle to enable or disable the plotting of new high/low markers for the short-term period.
Time Period: The number of bars used for calculating the short-term extremes (default is 50).
Time Unit: The timeframe on which the short-term calculations are based (default is Daily).
Show Channel?: Toggle to display the channel lines for the short-term highs and lows.
Indicator Logic:
Channel Calculation:
The script uses the request.security function to pull data from the specified timeframes. For each timeframe:
It calculates the lowest low over the defined period using ta.lowest.
It calculates the highest high over the defined period using ta.highest.
These values can be optionally plotted as channel lines when the “Show Channel?” option is enabled.
New High/Low Detection:
For each timeframe, the indicator compares the current high (or low) with its immediate previous value:
New High: When the current high exceeds the previous bar’s high, an up triangle is drawn above the bar.
New Low: When the current low falls below the previous bar’s low, a down triangle is drawn below the bar.
Usage and Interpretation:
Trend Identification:
When new highs (or lows) occur, they can signal the start of a strong upward (or downward) movement. The indicator helps you visually track these critical turning points over both longer and shorter periods.
Channel Breakouts:
The optional channel display offers additional context. Price movement beyond these channels may indicate a breakout or a significant shift in trend.
Customizable Timeframes:
You can adjust both the time period and time unit to fit your trading style—whether you’re focusing on longer-term trends or short-term price action.
Conclusion:
This indicator provides a dual-layer analysis by combining long-term and short-term perspectives, making it a versatile tool for identifying key highs and lows. Whether you are looking to confirm trend strength or spot potential breakouts, the “Long and Short Term Highs and Lows” indicator adds a valuable visual element to your TradingView charts.

High-Low IndexHello All,
High-Low Index is a breadth indicator based on Record High Percent (RHP). RHP is based on new 52-week highs and new 52-week lows. RHP => 100 * (new highs) / (new highs + new lows). High-Low Index is a 10-day Simple Moving Average of the RHP, which makes it a smoothed version of RHP. You can find many articles about High-Low Index on the net.
High-Low Index above 50 indicates that there are more new highs than new lows, and considered as Bullish.
High-Low Index below 50 indicates that there are more new lows than new highs, and considered as Bearish.
High-Low Index = 0 indicates there is no new highs (0% new highs).
High-Low Index = 100 indicates that there is at least 1 new high and no new lows.
and High-Low Index = 50 indicates that new highs and new lows is equal.
by default 40 cryptos are used in the script and shows High-Low Index for these cryptos. but you can change them as you wish. for example you can set all of them as stocks and see High-Low Index for these stocks.
You can set " Time frame " and the " Length " using the options. For example; if you set " Time frame " = 1 Week and the " Length " = 52 then it finds High-Low Index for 52weeks .
or another example; if you set " Time frame " = 1 Day and the " Length " = 22 the High-Low Indexn it finds High-Low Index for 22days.
You can enable/disable Record High Percent or Simple Moving Average of High-Low Index. Some traders use High-Low Index with its SMA, for example; High-Low Index generates a buy signal when it crosses above its moving average, and a sell signal when it crosses below its moving average.
Optionally you can see the securities in a table on the left bottom, you can change table size by usşng the options.
In the Table, for each security/cell;
=> if background is green then it has New High
=> if background is red then it has New Low
=> if background is gray then no New High, no New Low
=> if background is back then Data is not available for the security
As you can see in the screenshot below, the securities were changed and stocks are used instead of cryptos, so it calculates & shows High-Low Index for these stocks.
you can also find explanation in this screenshot:
Enjoy!

Contrarian Period High & LowContrarian Period High & Low
This indicator pairs nicely with the Contrarian 100 MA and can be located here:
Overview
The "Contrarian Period High & Low" indicator is a powerful technical analysis tool designed for traders seeking to identify key support and resistance levels and capitalize on contrarian trading opportunities. By tracking the highest highs and lowest lows over user-defined periods (Daily, Weekly, or Monthly), this indicator plots historical levels and generates buy and sell signals when price breaks these levels in a contrarian manner. A unique blue dot counter and action table enhance decision-making, making it ideal for swing traders, trend followers, and those trading forex, stocks, or cryptocurrencies. Optimized for daily charts, it can be adapted to other timeframes with proper testing.
How It Works
The indicator identifies the highest high and lowest low within a specified period (e.g., daily, weekly, or monthly) and draws horizontal lines for the previous period’s extremes on the chart. These levels act as dynamic support and resistance zones. Contrarian signals are generated when the price crosses below the previous period’s low (buy signal) or above the previous period’s high (sell signal), indicating potential reversals. A blue dot counter tracks consecutive buy signals, and a table displays the count and recommended action, helping traders decide whether to hold or flip positions.
Key Components
Period High/Low Levels: Tracks the highest high and lowest low for each period, plotting red lines for highs and green lines for lows from the bar where they occurred, extending for a user-defined length (default: 200 bars).
Contrarian Signals: Generates buy signals (blue circles) when price crosses below the previous period’s low and sell signals (white circles) when price crosses above the previous period’s high, designed to capture potential reversals.
Blue Dot Tracker: Counts consecutive buy signals (“blue dots”). If three or more occur, it suggests a stronger trend, with the table recommending whether to “Hold Investment” or “Flip Investment.”
Action Table: A 2x2 table in the bottom-right corner displays the blue dot count and action (“Hold Investment” if count ≥ 4, else “Flip Investment”) for quick reference.
Mathematical Concepts
Period Detection: Uses an approximate bar count to define periods (1 bar for Daily, 5 bars for Weekly, 20 bars for Monthly on a daily chart). When a new period starts, the previous period’s high/low is finalized and plotted.
High/Low Tracking:
Highest high (periodHigh) and lowest low (periodLow) are updated within the period.
Lines are drawn at these levels when the period ends, starting from the bar where the extreme occurred (periodHighBar, periodLowBar).
Signal Logic:
Buy signal: ta.crossunder(close , prevPeriodLow) and not lowBroken and barstate.isconfirmed
Sell signal: ta.crossover(close , prevPeriodHigh) and not highBroken and barstate.isconfirmed
Flags (highBroken, lowBroken) prevent multiple signals for the same level within a period.
Blue Dot Counter: Increments on each buy signal, resets on a sell signal or if price exceeds the entry price after three or more buy signals.
Entry and Exit Rules
Buy Signal (Blue Circle): Triggered when the price crosses below the previous period’s low, suggesting a potential oversold condition and buying opportunity. The signal appears as a blue circle below the price bar.
Sell Signal (White Circle): Triggered when the price crosses above the previous period’s high, indicating a potential overbought condition and selling opportunity. The signal appears as a white circle above the price bar.
Blue Dot Tracker:
Increments blueDotCount on each buy signal and sets an entryPrice on the first buy.
Resets on a sell signal or if price exceeds entryPrice after three or more buy signals.
If blueDotCount >= 3, the table suggests holding; if >= 4, it reinforces “Hold Investment.”
Exit Rules: Exit a buy position on a sell signal or when price exceeds the entry price after three or more buy signals. Combine with other tools (e.g., trendlines, support/resistance) for additional confirmation. Always apply proper risk management.
Recommended Usage
The "Contrarian Period High & Low" indicator is optimized for daily charts but can be adapted to other timeframes (e.g., 1H, 4H) with adjustments to the period bar count. It excels in markets with clear support/resistance levels and potential reversal zones. Traders should:
Backtest the indicator on their chosen asset and timeframe to validate signal reliability.
Combine with other technical tools (e.g., moving averages, Fibonacci levels) for stronger trade confirmation.
Adjust barsPerPeriod (e.g., ~120 bars for Weekly on hourly charts) based on the chart timeframe and market volatility.
Monitor the action table to guide position management based on blue dot counts.
Customization Options
Period Type: Choose between Daily, Weekly, or Monthly periods (default: Monthly).
Line Length: Set the length of high/low lines in bars (default: 200).
Show Highs/Lows: Toggle visibility of period high (red) and low (green) lines.
Max Lines to Keep: Limit the number of historical lines displayed (default: 10).
Hide Signals: Toggle buy/sell signal visibility for a cleaner chart.
Table Display: A fixed table in the bottom-right corner shows the blue dot count and action, with yellow (Hold) or green (Flip) backgrounds based on the count.
Why Use This Indicator?
The "Contrarian Period High & Low" indicator offers a unique blend of support/resistance visualization and contrarian signal generation, making it a versatile tool for identifying potential reversals. Its clear visual cues (lines and signals), blue dot tracker, and actionable table provide traders with an intuitive way to monitor market structure and manage trades. Whether you’re a beginner or an experienced trader, this indicator enhances your ability to spot key levels and time entries/exits effectively.
Tips for Users
Test the indicator thoroughly on your chosen market and timeframe to optimize settings (e.g., adjust barsPerPeriod for non-daily charts).
Use in conjunction with price action or other indicators for stronger trade setups.
Monitor the action table to decide whether to hold or flip positions based on blue dot counts.
Ensure your chart timeframe aligns with the selected period type (e.g., daily chart for Monthly periods).
Apply strict risk management to protect against false breakouts.
Happy trading with the Contrarian Period High & Low indicator! Share your feedback and strategies in the TradingView community!

TR FVG & Swing High Low FinderTR FVG & Swing Level Finder
Overview:
The TR FVG & Swing Level Finder is a powerful Pine Script indicator designed for traders who want to identify Fair Value Gaps (FVGs) and Swing Highs/Lows on their charts. This indicator combines two essential technical analysis tools into one, helping traders spot potential areas of support, resistance, and trend reversals. FVGs are price gaps that often act as areas of interest for price to return to, while swing highs and lows help identify key turning points in the market. The indicator is highly customizable, allowing users to adjust colors, limits, and display options to suit their trading style.
Key Features:
1: Fair Value Gap (FVG) Detection:
- Identifies Bullish FVGs: Occur when the high of two candles ago is lower than the low of the current candle, indicating a potential upward price movement.
- Identifies Bearish FVGs: Occur when the low of two candles ago is higher than the high of the current candle, indicating a potential downward price movement.
- Displays FVGs as colored boxes on the chart, with customizable border and fill colors based on the timeframe.
- Labels each FVG box with the corresponding timeframe (e.g., "1m FVG", "1h FVG", "Daily FVG").
2: Swing High and Swing Low Detection:
- Detects Swing Highs: A 3-candle pattern where the middle candle's high is higher than the highs of the candles on either side.
- Detects Swing Lows: A 3-candle pattern where the middle candle's low is lower than the lows of the candles on either side.
- Draws a solid black line with 50% opacity at each swing high and low, extending 5 bars to the right for better visibility.
- Adds a small Swing High or Swing Low label at the right end of each line, colored according to user-defined settings.
3: Timeframe-Specific FVG Visualization:
- FVGs are color-coded based on the chart's timeframe, making it easy to distinguish between FVGs on different timeframes.
- Each timeframe has its own fill color for bullish and bearish FVGs, with adjustable transparency for better chart clarity.
- A dashed black line is drawn in the middle of each FVG box to highlight the midpoint of the gap.
4: Customizable Display Options:
- FVG Limit: Control the maximum number of FVGs displayed on the chart (from 1 to 20).
- Extend Options for FVG Boxes:
- "None": FVG boxes extend only 2 bars to the right.
- "Limited": FVG boxes extend a user-defined number of candles to the right (1 to 100 candles).
- "Default": FVG boxes extend 3 bars to the right of the current bar.
- Color Customization:
- Set border colors for bullish and bearish FVGs.
- Adjust fill colors for FVGs on different timeframes (1m, 5m, 15m, 30m, 1h, 4h, Daily, Weekly, Monthly).
- Customize the colors of swing high and swing low labels.
5: Performance Optimization:
- The indicator only plots FVGs and swings on the last confirmed bar (barstate.islastconfirmedhistory), ensuring efficient performance and reducing chart clutter.
- Limits the number of displayed FVGs and swings to the user-defined fvgLimit, keeping the chart clean and focused on the most recent price action.
6: Inputs and Customization:
- Number of FVGs to Show (fvgLimit): Set the maximum number of FVGs and swings to display (default: 3, range: 1 to 20).
- Bullish FVG Border Color (bullishColor): Choose the border color for bullish FVGs (default: green).
- Bearish FVG Border Color (bearishColor): Choose the border color for bearish FVGs (default: red).
- Swing High Color (swingHighColor): Set the color for swing high labels (default: blue).
- Swing Low Color (swingLowColor): Set the color for swing low labels (default: purple).
- Extend Options:
- Extend Option (extendOption): Choose how far FVG boxes extend to the right ("None", "Limited", or "Default"; default: "Default").
- Extend Candles (extendCandles): If "Limited" is selected, specify the number of candles to extend FVG boxes (default: 8, range: 1 to 100).
- Timeframe-Specific Fill Colors:
- Customize fill colors for bullish and bearish FVGs on various timeframes (1m, 5m, 15m, 30m, 1h, 4h, Daily, Weekly, Monthly).
- Each fill color has a default transparency (e.g., 93% for most timeframes, 90% for 30m), which can be adjusted as needed.
How to Use:
1: Add the Indicator to Your Chart:
- Open TradingView, go to the Pine Editor, and paste the script.
- Click "Add to Chart" to apply the indicator to your current chart.
2: Adjust Settings:
- Open the indicator settings by clicking the gear icon next to the indicator name on your chart.
- Modify the inputs to suit your preferences:
- Set the number of FVGs and swings to display.
- Choose your preferred colors for FVGs and swings.
- Adjust the extend options for FVG boxes.
3: Interpret the Indicator:
- FVG Boxes: Look for colored boxes on the chart, which represent Fair Value Gaps. Bullish FVGs (green borders by default) suggest potential buying opportunities, while bearish FVGs (red borders by default) suggest potential selling opportunities. The label inside each box indicates the timeframe of the FVG.
- Swing Highs and Lows: Identify key turning points with solid black lines (50% opacity) at swing highs and lows. Each line extends 5 bars to the right, with an "SH" (Swing High) or "SL" (Swing Low) label at the end. Swing highs can act as resistance levels, while swing lows can act as support levels.
4: Combine with Your Strategy:
- Use FVGs to identify areas where price might return to fill the gap, often acting as support or resistance.
- Use swing highs and lows to spot potential trend reversals or to set stop-loss and take-profit levels.
- Combine the indicator with other tools (e.g., trendlines, moving averages) for a more comprehensive trading strategy.
Notes:
- The indicator works on all timeframes, but the appearance of FVGs and swings will vary depending on the chart's timeframe.
- For best results, use the indicator on a clean chart to avoid visual clutter, especially if you increase the fvgLimit.
- The swing high/low lines are drawn with 50% opacity to ensure they don’t overpower other chart elements, but they are still clearly visible.
Author’s Note:
This script was developed to help traders identify key price levels with ease. I hope it adds value to your trading! If you have any feedback or suggestions for improvement, feel free to leave a comment. Happy trading!

Historical High/Lows Statistical Analysis(More Timeframe interval options coming in the future)
Indicator Description
The Hourly and Weekly High/Low (H/L) Analysis indicator provides a powerful tool for tracking the most frequent high and low points during different periods, specifically on an hourly basis and a weekly basis, broken down by the days of the week (DOTW). This indicator is particularly useful for traders seeking to understand historical behavior and patterns of high/low occurrences across both hourly intervals and weekly days, helping them make more informed decisions based on historical data.
With its customizable options, this indicator is versatile and applicable to a variety of trading strategies, ranging from intraday to swing trading. It is designed to meet the needs of both novice and experienced traders.
Key Features
Hourly High/Low Analysis:
Tracks and displays the frequency of hourly high and low occurrences across a user-defined date range.
Enables traders to identify which hours of the day are historically more likely to set highs or lows, offering valuable insights into intraday price action.
Customizable options for:
Hourly session start and end times.
22-hour session support for futures traders.
Hourly label formatting (e.g., 12-hour or 24-hour format).
Table position, size, and design flexibility.
Weekly High/Low Analysis by Day of the Week (DOTW):
Captures weekly high and low occurrences for each day of the week.
Allows traders to evaluate which days are most likely to produce highs or lows during the week, providing insights into weekly price movement tendencies.
Displays the aggregated counts of highs and lows for each day in a clean, customizable table format.
Options for hiding specific days (e.g., weekends) and customizing table appearance.
User-Friendly Table Display:
Both hourly and weekly data are displayed in separate tables, ensuring clarity and non-interference.
Tables can be positioned on the chart according to user preferences and are designed to be visually appealing yet highly informative.
Customizable Date Range:
Users can specify a start and end date for the analysis, allowing them to focus on specific periods of interest.
Possible Uses
Intraday Traders (Hourly Analysis):
Analyze hourly price action to determine which hours are more likely to produce highs or lows.
Identify intraday trading opportunities during statistically significant time intervals.
Use hourly insights to time entries and exits more effectively.
Swing Traders (Weekly DOTW Analysis):
Evaluate weekly price patterns by identifying which days of the week are more likely to set highs or lows.
Plan trades around days that historically exhibit strong movements or price reversals.
Futures and Forex Traders:
Use the 22-hour session feature to exclude the CME break or other session-specific gaps from analysis.
Combine hourly and DOTW insights to optimize strategies for continuous markets.
Data-Driven Trading Strategies:
Use historical high/low data to test and refine trading strategies.
Quantify market tendencies and evaluate whether observed patterns align with your strategy's assumptions.
How the Indicator Works
Hourly H/L Analysis:
The indicator calculates the highest and lowest prices for each hour in the specified date range.
Each hourly high and low occurrence is recorded and aggregated into a table, with counts displayed for all 24 hours.
Users can toggle the visibility of empty cells (hours with no high/low occurrences) and adjust the table's design to suit their preferences.
Supports both 12-hour (AM/PM) and 24-hour formats.
Weekly H/L DOTW Analysis:
The indicator tracks the highest and lowest prices for each day of the week during the user-specified date range.
Highs and lows are identified for the entire week, and the specific days when they occur are recorded.
Counts for each day are aggregated and displayed in a table, with a "Totals" column summarizing the overall occurrences.
The analysis resets weekly, ensuring accurate tracking of high/low days.
Code Breakdown:
Data Aggregation:
The script uses arrays to store counts of high/low occurrences for both hourly and weekly intervals.
Daily data is fetched using the request.security() function, ensuring consistent results regardless of the chart's timeframe.
Weekly Reset Mechanism:
Weekly high/low values are reset at the start of a new week (Monday) to ensure accurate weekly tracking.
A processing flag ensures that weekly data is counted only once at the end of the week (Sunday).
Table Visualization:
Tables are created using the table.new() function, with customizable styles and positions.
Header rows, data rows, and totals are dynamically populated based on the aggregated data.
User Inputs:
Customization options include text colors, background colors, table positioning, label formatting, and date ranges.
Code Explanation
The script is structured into two main sections:
Hourly H/L Analysis:
This section captures and aggregates high/low occurrences for each hour of the day.
The logic is session-aware, allowing users to define custom session times (e.g., 22-hour futures sessions).
Data is displayed in a clean table format with hourly labels.
Weekly H/L DOTW Analysis:
This section tracks weekly highs and lows by day of the week.
Highs and lows are identified for each week, and counts are updated only once per week to prevent duplication.
A user-friendly table displays the counts for each day of the week, along with totals.
Both sections are completely independent of each other to avoid interference. This ensures that enabling or disabling one section does not impact the functionality of the other.
Customization Options
For Hourly Analysis:
Toggle hourly table visibility.
Choose session start and end times.
Select hourly label format (12-hour or 24-hour).
Customize table appearance (colors, position, text size).
For Weekly DOTW Analysis:
Toggle DOTW table visibility.
Choose which days to include (e.g., hide weekends).
Customize table appearance (colors, position, text size).
Select values format (percentages or occurrences).
Conclusion
The Hourly and Weekly H/L Analysis indicator is a versatile tool designed to empower traders with data-driven insights into intraday and weekly market tendencies. Its highly customizable design ensures compatibility with various trading styles and instruments, making it an essential addition to any trader's toolkit.
With its focus on accuracy, clarity, and customization, this indicator adheres to TradingView's guidelines, ensuring a robust and valuable user experience.

Weekly High/Low Day BreakdownThe "Weekly High/Low Day Breakdown" is a tool designed to help identify patterns in market behaviour by analysing the days of the week when weekly highs and lows occur. This indicator calculates the frequency and percentage of weekly highs and lows for each day from Monday to Sunday within the visible range of your chart.
Features:
Weekly Analysis: Calculates weekly highs and lows based on daily open high and low prices from Monday to Sunday.
Day-Specific Breakdown: Tracks which day of the week each weekly high and low occurred.
Visible Range Focus: Only considers data within the current visible range of your chart for precise analysis.
Interactive Table Display: Presents the results in an easy-to-read table directly on your chart.
How It Works:
Data Collection: Fetches daily high, low, day of the week, and time data regardless of your chart's timeframe. Uses these daily figures to determine the weekly high and low for each week.
Weekly Tracking: Monitors the day of the week when the weekly high and low prices occur. Resets tracking at the end of each week (Sunday).
Visible Range Analysis: Only includes weeks that fall entirely within the visible time range of your chart. Ensures that the analysis is relevant to the period you are focusing on.
Percentage Calculation: Counts the occurrences of weekly highs and lows for each day. Calculates the percentage based on the total number of weeks in the visible range.
Result Display: Generates a table with days of the week as columns and "Weekly High" and "Weekly Low" as rows. Displays the percentage values, indicating how often highs and lows occur on each day.
How to Use:
Add the Indicator: Apply the "Weekly High/Low Day Breakdown" indicator to your TradingView chart.
Adjust Visible Range: Zoom in or out to set the desired visible time range for your analysis.
Interpret the Table:
Columns: Represent days from Monday to Sunday.
"Weekly High" Row: Shows the percentage of times the weekly high occurred on each day. "Weekly Low" Row: Shows the percentage of times the weekly low occurred on each day.
Colors: Blue text indicates high percentages, red text indicates low percentages.
Example Interpretation:
If the table shows a 30% value under "Tuesday" for "Weekly High," it means that in 30% of the weeks within the visible range, the highest price of the week occurred on a Tuesday.
Similarly, a 40% value under "Friday" for "Weekly Low" indicates that 40% of the weekly lows happened on a Friday.

Pivot-based Swing Highs and LowsRelease Notes for Pivot-based Swing Highs and Lows Indicator with HH, HL, LH, LL and Labels
Version 1.0.0
Release Date: 29th Sept 2024
Overview:
This Pine Script version 5 indicator is designed to identify and display Swing Highs and Swing Lows based on pivot points. The indicator visually marks Higher Highs (HH), Lower Highs (LH), Higher Lows (HL), and Lower Lows (LL) on the chart. The release introduces an improved visual representation with dotted lines and colored labels for easy identification of market structure, using plotshape() and line.new().
Key Features:
1. Pivot-Based Swing Identification:
The indicator uses ta.pivothigh() and ta.pivotlow() to detect significant pivot points on the chart.
The length of the pivot can be adjusted through the pivot_length parameter, allowing users to customize the sensitivity of swing identification.
2. Swing Highs and Lows with Labels:
Higher High (HH) and Lower High (LH) points are marked with green downward triangles.
Higher Low (HL) and Lower Low (LL) points are marked with red upward triangles.
The plotshape() function is used to provide clear visual markers, making it easy to spot the changes in market structure.
3. Dotted Line Visuals:
Green Dotted Lines: Connect Higher Highs (HH) and Higher Lows (HL) to their corresponding previous swings.
Red Dotted Lines: Connect Lower Highs (LH) and Lower Lows (LL) to their corresponding previous swings.
The use of color-coded dotted lines ensures better visual understanding of the trend continuation or reversal patterns.
4. Customizable Input:
The user can adjust the pivot_length parameter to fine-tune the detection of pivot highs and lows according to different timeframes or trading strategies.
Usage:
Higher High (HH): Green downward triangle, indicating a new high compared to the previous pivot high.
Lower High (LH): Green downward triangle, indicating a lower high compared to the previous pivot high.
Higher Low (HL): Red upward triangle, indicating a higher low compared to the previous pivot low.
Lower Low (LL): Red upward triangle, indicating a new lower low compared to the previous pivot low.
Dotted Lines: Connect previous swing points, helping users visualize the trend and potential market structure changes.
Improvements:
Label Substitution: In place of label.new() (which might cause issues in some environments), the indicator now uses plotshape() to provide a reliable and visually effective solution for marking swings.
Streamlined Performance: The logic for determining higher highs, lower highs, higher lows, and lower lows has been optimized for smooth performance across multiple timeframes.
Known Limitations:
No Direct Text Labels: Due to the constraints of plotshape(), text labels like "HH", "LH", "HL", and "LL" are not directly displayed. Instead, color-coded shapes are used for easy identification.
How to Use:
Apply the script to your chart via the TradingView Pine Editor.
Customize the pivot_length to suit your trading style or the timeframe you are analyzing.
Monitor the chart for marked Higher Highs, Lower Highs, Higher Lows, and Lower Lows for potential trend continuation or reversal opportunities.
Use the dotted lines to trace the evolution of market structure.
Please share your comments, thoughts. Also please follow me for more scripts in future. Mean time Happy Trading :)

Hardwaybets' Protected Highs / Protected Lows TradingProtected Highs & Lows – Multi-Condition Structural Marker
This indicator identifies specific candle formations where price breaks a previous candle’s high or low, fails to maintain that break, and confirms the rejection with an additional condition involving prior candles. These marked locations offer a visual reference for areas where price attempted directional expansion but did not sustain it. All levels remain visible until later invalidated by price movement.
Protected High – Detection Logic
A Protected High is marked only when all three of the following conditions occur:
1. Break of Previous High
The current candle trades above the prior candle’s high.
2. Close Back Inside Range
The current candle closes within the high-to-low range of the previous candle, indicating the upward expansion was not sustained.
3. Reversal Through Prior Bullish Structure
After forming the high, price closes below the opening price of one or more bullish candles that were part of the upward movement into that high.
This reflects a shift away from the prior upward structure.
When all three conditions are met, the high of the candle that created the event is marked on the chart.
Protected Low – Detection Logic
A Protected Low is marked only when all three of the following conditions occur:
1. Break of Previous Low
The current candle trades below the prior candle’s low.
2. Close Back Inside Range
The current candle closes within the high-to-low range of the previous candle, indicating the downward expansion was not sustained.
3. Reversal Through Prior Bearish Structure
After forming the low, price closes above the opening price of one or more bearish candles that were part of the downward movement into that low.
This reflects a shift away from the prior downward structure.
When all three conditions are met, the low of the candle that created the event is marked on the chart.
Level Management
* Marked highs and lows remain active as long as price does not trade beyond them.
* If price moves past a marked level, that level is removed.
* Only active, unviolated structural reference points remain displayed.
Market Structure Context (Strictly Non-Signaling)
Protected highs and lows can help traders observe areas where:
* Price briefly exceeded a previous high or low
* That expansion was not maintained
* Price then moved back through recent candles associated with the prior direction
These observations can be used by traders to understand how price interacts with nearby structural reference points.
The indicator itself does not provide trade entries, exits, or directional guidance.
Customization Options
The indicator provides adjustable settings for:
* Marker style (labels or shapes)
* Shape type (circle, square, diamond, etc.)
* Colors for highs and lows
* Vertical spacing between markers and candles
These options help maintain clarity on different chart types and timeframes.
Intended Use
The indicator does not generate forecasts or trading signals.
Its purpose is to visually highlight multi-condition candle formations where price briefly exceeded a prior high or low, failed to sustain that expansion, and later reversed through nearby structural points.
Compatibility
Suitable for all assets and timeframes.
Swing High/Low (Adaptive)Swing High/Low (Adaptive)
Overview
The Indicator is a pivot point detection tool that identifies swing highs and lows with invalidation tracking. The key differentiator of this indicator is its adaptive invalidation system . Most pivot indicators simply mark every detected pivot without considering whether subsequent price action has made earlier pivots less relevant.
How It Works
The indicator uses Pine Script's native ta.pivotlow() and ta.pivothigh() functions combined with custom logic to detect swing points. The adaptive algorithm evaluates each potential pivot against the following criteria:
For Low Pivots:
Confirms a new low pivot when it's the next expected pivot type in the swing sequence
If consecutive lows occur, only accepts a new low if it's lower than the previous low
Marks the previous low as invalidated when a stronger low is detected
For High Pivots:
Confirms a new high pivot when it's the next expected pivot type in the swing sequence
If consecutive highs occur, only accepts a new high if it's higher than the previous high
Marks the previous high as invalidated when a stronger high is detected
This approach ensures that the indicator maintains clean swing structure and automatically adjusts when price action creates stronger pivots, providing a more realistic view of support and resistance levels.
Settings
Pivot Settings:
Left Bars : Number of bars to the left required for pivot confirmation (default: 5)
Right Bars : Number of bars to the right required for pivot confirmation (default: 5)
Pivot Display Settings:
Toggle visibility for low and high pivots independently
Customizable colors for valid pivot markers
Low pivots marked with upward triangle (▲)
High pivots marked with downward triangle (▼)
Invalid Pivot Settings:
Optional display of invalidated pivots
Separate color customization for invalid low and high pivots
Helps visualize where market structure expectations changed
ZigZag Settings:
Toggle ZigZag line display on/off
Separate colors for upward and downward price swings
Adjustable line width
Use Cases
1. Market Structure Analysis
Identify key swing points to understand the current market structure and trend direction. The adaptive invalidation feature ensures you're always looking at the most relevant pivots.
2. Support and Resistance Identification
Use confirmed swing highs and lows as potential support and resistance levels for entry and exit planning.
3. Trend Confirmation
The ZigZag visualization helps confirm trends by showing the sequence of higher highs and higher lows (uptrend) or lower highs and lower lows (downtrend).
Disclaimer
This indicator is designed as a technical analysis tool and should be used in conjunction with other forms of analysis and proper risk management. Past performance does not guarantee future results, and traders should thoroughly test any strategy before implementing it with real capital.

Sessions High/Low with Break LogicSessions High/Low with Break Logic – Indicator Description
Update 27.10.25
Overview
This indicator marks the highs and lows of key trading sessions (Tokyo, London, New York) and highlights when these levels are broken. It is ideal for traders using session-based strategies to monitor breakouts or support/resistance levels in real time.
Key Features
Session-Based Highs/Lows:
Tracks highs and lows for three trading sessions:
Tokyo: 02:00–09:00 (UTC+1)
London: 09:00–17:00 (UTC+1)
New York: 15:30–22:00 (UTC+1)
Break Logic:
Detects when the current price breaks a session high or low.
Labels are updated with a "Break" note when a level is breached.
Visual Display:
Draws horizontal lines for highs and lows of each session.
Adds labels with values (optionally including price).
Colors are customizable for each session:
Tokyo: Purple
London: Teal
New York: Orange
Customizable Settings:
Horizontal Offset: Shifts lines and labels horizontally for clarity.
Time Zone: Adjustable to UTC+1 (default).
Price Display: Option to show the exact price next to the label.
Settings and Translations
Display Settings
Horizontal Offset: Horizontal shift for lines and labels.
Show Price with Text: Displays the price next to the label (e.g., "London High: 123.45").
Time Settings
UTC: Time zone (default: UTC+1).
Session 1 (Tokyo)
Session 1: 02:00–09:00
High Text: "Tokyo High"
Low Text: "Tokyo Low"
High Color: Purple
Low Color: Purple
Session 2 (London)
Session 2: 09:00–17:00
High Text: "London High"
Low Text: "London Low"
High Color: Teal
Low Color: Teal
Session 3 (New York)
Session 3: 15:30–22:00
High Text: "New York High"
Low Text: "New York Low"
High Color: Orange
Low Color: Orange

Fibonacci Pivot Points & Previous D,W&M Highs/LowsIndicator Overview
This indicator combines Fibonacci Pivot Points with previous high and low levels for different timeframes (day, week, month). It plots these levels on the chart to provide traders with key support and resistance areas, making it easier to identify potential trading opportunities.
Features
Fibonacci Pivot Points:
The indicator calculates pivot points based on the high, low, and close prices.
Fibonacci levels are used to determine support (S1, S2, S3, S4, S5) and resistance (R1, R2, R3, R4, R5) levels.
Users can customize the Fibonacci levels for both support and resistance.
Previous Highs and Lows:
The indicator plots previous day, week, and month high and low levels.
Each of these lines can be customized in terms of visibility, color, and width.
This helps traders to see key historical levels that might act as support or resistance in the future.
Inputs and Customization:
Fibonacci Time Frame:
Users can select the timeframe for calculating the pivot points (Daily, Weekly, Monthly).
Fibonacci Levels:
Customizable input fields for each Fibonacci level (R1, R2, R3, R4, R5, S1, S2, S3, S4, S5).
Previous High/Low Lines:
Day Lines:
Options to show or hide previous day's high/low lines.
Customizable color and width for these lines.
Week Lines:
Options to show or hide previous week's high/low lines.
Customizable color and width for these lines.
Month Lines:
Options to show or hide previous month's high/low lines.
Customizable color and width for these lines.
Technical Calculations:
Fibonacci Pivot Points:
Calculated as:
pp = (High + Low + Close) / 3
S1 = pp - ((High - Low) * Fibonacci Level)
R1 = pp + ((High - Low) * Fibonacci Level)
Previous High/Low Levels:
Uses request.security to fetch previous high and low values for the selected timeframe.
Plotted using line.new to draw lines across the chart.
Plotting:
The indicator plots Fibonacci Pivot Points and previous high/low lines on the chart, using distinct colors for each level.
Customizable transparency and linewidths make it easier to visually interpret the levels.
This indicator is particularly useful for traders who rely on technical analysis to identify key support and resistance levels, offering a blend of historical data and Fibonacci-based predictions.
Feel free to ask if you have any specific questions or need further adjustments!

Trading Sessions Highs/Lows | InvrsROBINHOODTrading Sessions Highs/Lows | InvrsROBINHOOD
🚀 A powerful indicator for tracking key trading sessions and the highs and lows of each session!
📌 Description
The Trading Sessions Highs/Lows indicator visually marks the most critical trading sessions—Asia, London, and New York—using small colored dots at the bottom of the candle. It also tracks and plots the highs and lows of each session, along with the Daily Open and Weekly Open levels.
This tool is designed to help traders identify session-based liquidity zones, price reactions, and potential trade setups with minimal chart clutter.
Key Features:
✅ Session markers (Asia, London, NY AM, NY Lunch, NY PM) plotted as small dots
✅ Plots session highs and lows for market structure insights
✅ Daily Open line for intraday reference
✅ Weekly Open line for higher timeframe bias
✅ Alerts for session high/low breaks to capture momentum shifts
✅ User-defined UTC offset for global traders
✅ Customizable session colors for personal preference
📖 How to Use the Indicator
1️⃣ Understanding the Sessions
Asia Session (Yellow Dot) → Marks liquidity buildup & pre-London moves
London Session (Blue Dot) → Strong volatility, breakout opportunities
New York AM Session (Green Dot) → Major trends & institutional participation
New York Lunch (Red Dot) → Low volume, ranging market
New York PM Session (Dark Green Dot) → End-of-day movements & reversals
2️⃣ Session Highs & Lows for Market Structure
Session Highs can act as resistance or breakout points.
Session Lows can act as support or stop-hunt zones.
Break of a session high/low with volume may indicate continuation or reversal.
3️⃣ Using the Daily & Weekly Open
The Daily Open (Black Line) helps gauge the intraday trend.
Above Daily Open → Bearish Bias
Below Daily Open → Bullish Bias
The Weekly Open (Red Line) sets the higher timeframe directional bias.
4️⃣ Alerts for Breakouts
The indicator will trigger alerts when price breaks session highs or lows.
Useful for setting stop-losses, breakout trades, and risk management.
💡 Why This Indicator is Important for Beginners
1️⃣ Avoids Overtrading:
Many beginners trade in low-volume periods (NY Lunch, Asia session) and get stuck in choppy price action.
This indicator highlights when volatility is high so traders focus on better opportunities.
2️⃣ Session-Based Liquidity Traps:
Market makers often run stops at session highs/lows before reversing.
Watching session breaks prevents traders from falling into liquidity grabs.
3️⃣ Reduces Emotional Trading:
If price is above the Daily Open, a beginner shouldn’t look for shorts.
If price is below a key session low, it may signal a fake breakout.
4️⃣ Aligns with Institutional Trading:
Smart money traders use session highs/lows to set stop hunts & reversals.
Beginners can use this indicator to spot these zones before entering trades.
🛡️ How to Mitigate Risk with This Indicator
✅ Wait for Confirmations – Don’t trade blindly at session highs/lows. Look for wicks, rejections, or break/retests.
✅ Use Stop-Loss Above/Below Session Levels – If you’re going long, set SL below a session low. If short, set SL above a session high.
✅ Watch Volume & News Events – Breakouts without strong volume or news may be fake moves.
✅ Combine with Other Strategies – Use price action, trendlines, or EMAs with this indicator for higher probability trades.
✅ Use the Weekly Open for Trend Bias – If price stays below the Weekly Open, avoid bullish setups unless key support holds.
🎯 Who is This Indicator For?
📌 Beginners who need clear session-based trading levels.
📌 Day traders & scalpers looking to refine their intraday setups.
📌 Smart money traders using liquidity concepts.
📌 Swing traders tracking higher timeframe momentum shifts.
🚀 Final Thoughts
This indicator is an essential tool for traders who want to understand market structure, liquidity, and volatility cycles. Whether you’re trading forex, stocks, or crypto, it helps you stay on the right side of the market and avoid unnecessary risks.
🔹 Set it up, customize your colors, define your UTC offset, and start trading smarter today! 🏆📈

[SHORT ONLY] 10 Bar Low Pullback█ STRATEGY DESCRIPTION
The "10 Bar Low Pullback" strategy is a contrarian short trading system designed to capture pullbacks after a new 10‐bar low is made. it identifies a potential short opportunity when the current bar’s low breaks below the lowest low of the previous 10 bars, provided that the bar exhibits strong internal momentum as measured by its IBS value. An optional trend filter further refines entries by requiring that the close is below a 200-period EMA.
█ WHAT IS INTERNAL BAR STRENGTH (IBS)?
Internal Bar Strength (IBS) measures where the closing price falls within the high-low range of a bar. It is calculated as:
ibs = (close - low) / (high - low)
- Low IBS (≤ 0.2): Indicates the close is near the bar's low, suggesting oversold conditions.
- High IBS (≥ 0.8): Indicates the close is near the bar's high, suggesting overbought conditions.
█ SIGNAL GENERATION
1. SHORT ENTRY
A Short Signal is triggered when:
The current bar’s low is below the lowest low of the past X bars (default: 10).
The bar’s IBS is greater than the specified threshold (default: 0.85).
The signal occurs within the defined trading window (between Start Time and End Time).
If the EMA Filter is enabled, the close must be below the 200-period EMA.
2. EXIT CONDITION
An exit Signal is generated when the current close falls below the previous bar’s low (close < low ), indicating a potential bearish reversal and prompting the strategy to close its short position.
█ ADDITIONAL SETTINGS
Lookback Period: Defines the number of bars (default is 10) over which the lowest low is calculated.
IBS Threshold: Sets the minimum required IBS value (default is 0.85) to qualify as a pullback.
Trading Window: Trades are only executed between the user-defined Start Time and End Time.
EMA Filter (Optional): When enabled, short entries are only considered if the current close is below the 200-period EMA, with the EMA period being adjustable (default is 200).
█ PERFORMANCE OVERVIEW
Designed for shorting opportunities, this strategy aims to capture pullbacks following an aggressive 10-bar low break.
It leverages a combination of a lookback low and IBS measurement to identify overextended bullish moves that may revert.
The optional EMA filter helps confirm a bearish market environment by ensuring the price remains under the trend line.
Suitable for use on various assets, including stocks and ETFs, on daily or similar timeframes.
Backtesting and parameter optimization are recommended to tailor the strategy to specific market conditions.

Prior Day High/Low and Highest High/Lowest LowFeatures:
Prior Day High and Low:
The script tracks and displays the previous trading day's high and low prices. These levels can serve as important areas of support or resistance, helping traders to make informed decisions about potential price reversals or breakouts.
Highest High and Lowest Low Over N Days:
This indicator also tracks and displays the highest high and lowest low over the last N days, where N is user-configurable. This allows traders to see broader trends in price action and identify key levels for potential trend changes.
User-Configurable Inputs:
Show Prior Day High/Low: Toggle whether to display the prior day’s high and low levels.
Days to Consider for Highest High/Lowest Low: Define the number of days over which the highest high and lowest low are calculated.
Show Highest High/Lowest Low: Toggle whether to display the highest high and lowest low levels over the specified period.
Low Source and High Source: Customize the data sources for the high and low values.
Automatic Data Handling:
The script automatically tracks the daily high and low prices, storing them in arrays, and calculates the highest and lowest prices over the user-specified number of days. When a new day begins, the prior day's data is saved, and the calculations are updated accordingly.
Visual Display:
The indicator uses distinct colors and plotting styles:
Prior day’s high and low are plotted as blue circles.
The highest high over N days is plotted as a red circle.
The lowest low over N days is plotted as a green circle.
This indicator helps traders stay informed about significant price levels, which are often used in trading strategies for breakouts, trend following, or reversals.

High-Low of X BarOverview
The High-Low of X Bar indicator allows traders to visualize historical high and low values from a specific number of bars ago directly on the chart.
Provides insight into past price action by displaying high, low, and their difference at the most recent bar.
Customizable inputs and color settings for labels enhance usability and visual integration with your chart.
Key Features
Historical Data Analysis: Displays the high, low, and the difference between these values from a specified number of bars ago.
Customizable Inputs: Set the number of bars ago to review historical price points, with a range from 1 to 2000 bars. Premium users can exceed this range.
Dynamic Labeling: Option to show high, low, and difference values as labels on the chart, with customizable text and background colors.
Color Customization: Customize label colors for high, low, and difference values, as well as for cases with insufficient bars.
Inputs
Number of Bars Ago: Enter the number of bars back from the current bar to analyze historical high and low values.
Show High Value: Toggle to display the historical high value.
Show Low Value: Toggle to display the historical low value.
Show Difference Value: Toggle to display the difference between high and low values.
Color Settings
High Label Background Color: Set the background color of the high value label.
High Label Text Color: Choose the text color for the high value label.
Low Label Background Color: Set the background color of the low value label.
Low Label Text Color: Choose the text color for the low value label.
Difference Label Background Color: Set the background color of the difference label.
Difference Label Text Color: Choose the text color for the difference label.
Not Enough Bars Label Background Color: Set the background color for the label shown when there are insufficient bars.
Not Enough Bars Label Text Color: Choose the text color for the insufficient bars label.
Usage Instructions
Add to Chart: Apply the High-Low of X Bar indicator to your TradingView chart.
Configure Settings: Adjust the number of bars ago and display options according to your analysis needs.
Customize Appearance: Set the colors for the labels to match your chart's style.
Analyze: Review the high, low, and their difference directly on your chart for immediate insights into past price movements.
Notes
Ensure your chart has sufficient historical data for the indicator to function properly.
Customize label visibility and colors based on your preference and trading strategy.
Merovinh - Mean Reversion Lowest lowThe "Merovinh - Mean Reversion Lowest Low" strategy is a mean reversion trading approach that aims to identify potential reversal points based on the updated lowest low of the specified number of bars. This strategy focuses on the detection of bullish price movements. Works well on Tech giant's shares.
Strategy Overview:
The strategy detects the lowest low and highest high over a specified number of bars.
It uses a mean reversion concept where it expects the price to revert back towards the updated lowest low.
The strategy enters a long position when the current lowest low breaks the previous lowest low (based on the specified number of broken lows).
It closes the long position when the highest high breaks the previous highest high.
The strategy aims to capitalize on potential reversals in the market by buying at lower price levels and selling at higher price levels.
Strategy Parameters:
Minimum number of bars: Specifies the minimum number of bars considered for calculating the lowest low and highest high.
Number of broken lows: Determines the number of previous lows that need to be broken for entering a long position.
How It Works:
The strategy calculates the lowest low and highest high based on the specified number of bars.
It compares the current lowest low with the previous lowest low.
If the current lowest low breaks the previous lowest low (based on the specified number of broken lows), a long position is entered.
The strategy continuously updates the previous lows and highs.
It closes the long position if the highest high breaks the previous highest high.

Highest High and lowest low - Sachin Wakpaijan
The "Highest High and Lowest Low" indicator, created by Sachin Wakpaijan, is a powerful tool designed to identify the highest high and lowest low in a trading instrument's price history. This indicator can be used on TradingView to gain insights into significant price levels and potential trend reversals.
Inputs:
Display Emoji: This input parameter enables or disables the display of emoji symbols on the chart.
Functionality:
The indicator calculates the highest high and lowest low based on the price history. It performs the following steps:
Highest High Calculation: The indicator calculates the highest high by comparing the current high with the previously recorded highest high. If a new high is found, the highest high is updated. The lowest low is set to the highest high.
Lowest Low Calculation: The indicator calculates the lowest low based on the current low. If a new low is found, the lowest low is updated, and the highest after the low is set to the lowest low.
Checking for Highest After Low: If the current high exceeds the highest after the low, the highest after the low is updated.
Plotting: The indicator plots the highest high, highest after low, and lowest high on the chart. Additionally, it displays emoji symbols on the chart based on specific conditions, such as the highest high and the relationship between the high and the open/close prices.
Usage:
The "Highest High and Lowest Low" indicator can be applied to any trading instrument and time frame. It helps traders identify significant price levels, potential trend reversal points, and gauge the strength of price movements. The indicator's customizable input parameter allows users to adjust the visual appearance according to their preferences.
Note:
This indicator is provided for informational purposes only and should not be considered as financial advice. Traders should conduct thorough analysis and use additional indicators or techniques to validate their trading decisions.
Author:
This indicator was created by Sachin Wakpaijan. You can find more of their work on TradingView.
Disclaimer:
Trading involves risks, and it is essential to understand and acknowledge the risks associated with trading before making any investment decisions. The author do not assume any responsibility for any trading losses incurred as a result of using this indicator.

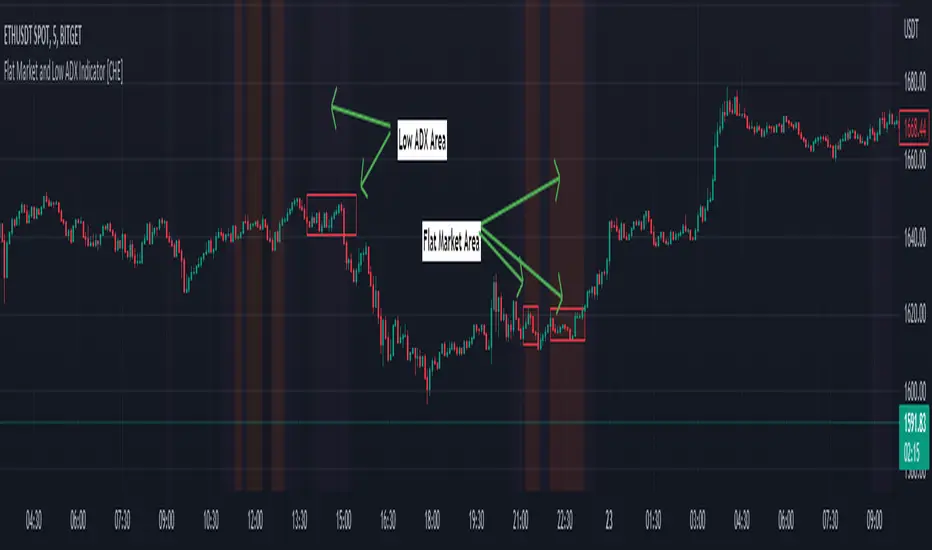
Flat Market and Low ADX Indicator [CHE]Why use the Flat Market and Low ADX Indicator ?
Flat markets, where prices remain within a narrow range for an extended period, can be both critical and dangerous for traders. In a flat market, the price action becomes less predictable, and traders may struggle to find profitable trading opportunities. As a result, many traders may decide to take a break from the market until a clear trend emerges.
However, flat markets can also be dangerous for traders who continue to trade despite the lack of clear trends. In the absence of a clear direction, traders may be tempted to take larger risks or make impulsive trades in an attempt to capture small profits. Such behavior can quickly lead to significant losses, especially if the market suddenly breaks out of its flat range, causing traders to experience large drawdowns.
Therefore, it is essential to approach flat markets with caution and to have a clear trading plan that incorporates strategies for both trending and flat markets. Traders may also use technical indicators, such as the Flat Market and Low ADX Indicator, to help identify flat markets and determine when it is appropriate to enter or exit a position.
The confluence between flat markets and low ADX readings can further increase the risk of trading during these periods. The ADX (Average Directional Index) is a technical indicator used to measure the strength of a trend. A low ADX reading indicates that the market is in a consolidation phase, which can coincide with a flat market. When a flat market occurs during a period of low ADX, traders should be even more cautious, as there is little to no directional bias in the market. In this situation, traders may want to consider waiting for a clear trend to emerge or using range-bound trading strategies to avoid taking excessive risks.
Introduction:
Pine Script is a programming language used for developing custom technical analysis indicators and trading strategies in TradingView. This particular script is an indicator designed to identify flat markets and low ADX conditions. In this description, we will delve deeper into the functionality of this script and how it can be used to improve trading decisions.
Description:
The first input in the script is the length of the moving average used for calculating the center line. This moving average is used to define the high and low range of the market. The script then calculates the middle value of the range by taking the double exponential moving average (EMA) of the high, low, and close prices.
The script then determines whether the market is flat by comparing the middle value of the range with the high and low values. If the middle value is greater than the high value or less than the low value, the market is not flat. If the middle value is within the high and low range, the script considers the market to be flat. The script also uses RSI filter settings to further confirm if the market is flat or not. If the RSI value is between the RSI min and max values, then the market is considered flat. If the RSI value is outside this range, the market is not considered flat.
The script also calculates the ADX (Average Directional Index) to determine whether it's in a low area. ADX is a technical indicator used to measure the strength of a trend. The script uses the ADX filter settings to define the ADX threshold value. If the ADX value is below the threshold value, the script considers the market to be in a low ADX area.
The script provides various input options to customize the display settings, including the option to show the flat market and low ADX areas. Users can choose their preferred colors for the flat market and low ADX areas and adjust the transparency levels to suit their needs.
Conclusion:
In conclusion, this Pine Script indicator is designed to identify flat market and low ADX conditions, which can help traders make informed trading decisions. The script uses a range of inputs and calculations to determine the market direction, RSI filter, and ADX filter. By customizing the display settings, users can adjust the indicator to suit their preferences and improve their trading strategies. Overall, this script can be a valuable tool for traders looking to gain an edge in the markets.
Acknowledgments:
Thanks to the Pine Script™ v5 User Manual www.tradingview.com
AP Capital – Volatility + High/Low Projection v1.1📌 AP Capital – Volatility + High/Low Projection v1.1
Predictive Daily Volatility • Session Logic • High/Low Projection Indicator
This indicator is designed to help traders visually understand daily volatility conditions, identify session-based turning points, and anticipate potential highs and lows of the day using statistical behavior observed across thousands of bars of intraday data.
It combines intraday session structure, volatility regime classification, and context from the previous day’s expansion to highlight high-probability areas where the market may set its daily high or daily low.
🔍 What This Indicator Does
1. Volatility Regime Detection
Each day is classified into:
🔴 High Volatility (trend continuation & expansion likely)
🟡 Normal Volatility
🔵 Low Volatility (chop, false breaks, mean-reversion common)
The background color automatically adapts so you always know what environment you're trading in.
2. Session-Based High/Low Identification
Different global sessions tend to create different market behaviors:
Asia session frequently sets the LOW of day
New York & Late US sessions frequently set the HIGH of day
This indicator uses those probabilities to highlight potential turning points.
3. Potential High / Low of Day Projections
The script plots:
🟢 Potential LOW of Day
🔴 Potential HIGH of Day
These appear only when:
Price hits the session-statistical turning zone
Volatility conditions match
Yesterday’s expansion or compression context agrees
This keeps signals clean and prevents over-marking.
4. Clean Visuals
Instead of cluttering the chart, highs and lows are marked only when conditions align, making this tool ideal for:
Session scalpers
Day traders
Gold / NAS100 / FX intraday traders
High-probability reversal traders
🧠 How It Works
The engine combines:
Daily range vs 20-day average
Real-time intraday high/low formation
Session-specific probability weighting
Previous day expansion and volatility filters
This results in highly reliable signals for:
Fade trades
Reversal setups
Timing entries more accurately
✔️ Best Uses
Identifying where the day’s range is likely to complete
Avoiding trades during low-volatility compression days
Detecting where the market is likely to turn during major sessions
Using potential HIGH/LOW levels as take-profit zones
Enhancing breakout or reversal strategies
⚠️ Disclaimer
This indicator does not repaint, but it is not a standalone entry tool.
It is designed to provide context, session awareness, and volatility-driven turning points to assist your existing strategy.
Always combine with sound risk management.

High and low statisticsHigh/Low Pattern Analyzer (All Timeframes)
Ever wonder if there's a hidden pattern in the market?
Does the high of the week usually happen on a Tuesday?
Does the low of the month always form in the first week?
Which 15-minute candle really sets the high for the entire day?
This indicator is a powerful statistical tool designed to answer these questions by analyzing historical price action to find patterns in when the high and low of a period are formed.
The Core Idea: Daily High & Low of the Week
The simplest and most popular feature of this indicator is the "Daily high and low of the week" analysis.
What it does:
It looks back over your chosen number of weeks (e.g., the last 100) and finds out which day of the week (Monday, Tuesday, Wednesday, etc.) made the final high and which day made the final low for each of those weeks.
How to use it:
Go to the script settings.
Enable the "Daily High/Low of the Week" module.
Set your chart to the 1D (Daily) timeframe.
A table will appear on your chart (bottom-right by default) showing the exact count and percentage for each day. This lets you see at a glance if there's a strong tendency for the market you're watching.
Advanced Analysis: Other Timeframes
This script goes far beyond just the daily chart. It includes four other independent analysis modules:
1. 4-Hour High/Low of the Week
What it does: For intraday and swing traders. This module finds which 4-hour candle session (e.g., the 08:00 candle, the 16:00 candle) tends to form the high or low of the entire week.
Key Feature (DST Aware): This table is "season-aware." It knows that the 08:00 "summertime" (DST) candle is the same trading session as the 07:00 "wintertime" (STD) candle. It groups them together so your data is never split or messy.
2. Weekly High/Low of the Month
What it does: For a monthly perspective. This module finds which week of the month (Week 1, 2, 3, 4, or 5) is most likely to form the monthly high or low.
How to use: Enable it and set your chart to the 1W (Weekly) timeframe.
3. Monthly High/Low of the Year
What it does: The ultimate "big picture" view. This module finds which month (Jan, Feb, Mar, etc.) most frequently forms the high or low for the entire year.
How to use: Enable it and set your chart to the 1M (Monthly) timeframe.
The Power User Module: Custom Timeframe Analysis
This is the most powerful feature. It lets you analyze any timeframe combination you want.
What it does: It finds out which "Lower Timeframe" (LTF) candle made the high or low of any "Higher Timeframe" (HTF) you choose.
Example: Do you want to know which 15-minute candle makes the Daily high?
Set your chart to the 15M timeframe.
Go to the "Custom Timeframe Analysis" settings.
Set the "Higher Timeframe" to "1D".
The script will draw a "season-aware" table (just like the 4H module) showing you the exact 15-minute candles (09:15, 09:30, etc.) that are statistically most likely to form the day's high or low.
Other Features
Show Labels: Each module has an option to "Show labels," which will draw a label (e.g., "Daily High of the Week") directly on the chart at the exact bar that made the high or low.
Custom Dividers: Each module has its own optional, color-customizable divider (e.g., weekly, monthly) that you can toggle on to see the periods more clearly.
Clean Settings: All modules are disabled by default (except for "Daily") to keep your chart clean. You only need to enable the specific analysis you want to see.
This tool was built to turn your curiosity about market patterns into actionable, statistical data. Enjoy!

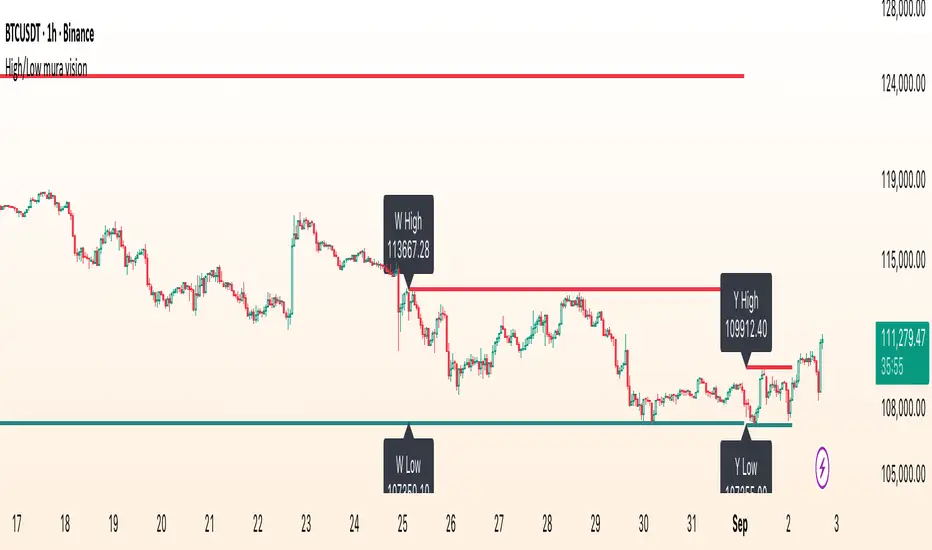
High/Low mura visionDescription
High/Low mura vision plots static support and resistance lines based on the completed high and low values of the prior trading day, week and calendar month.
This script:
Anchors each level to the exact start and end bars of the completed period
Does not repaint or extend levels into the current period
Uses request.security() to retrieve only historical data (no lookahead)
This indicator was built to give traders clear, unambiguous reference points for breakout entries, pullback targets or confirmation of supply/demand zones without guessing where to draw manually.
How It Works
At the close of each daily candle, the script captures high and low via request.security() and draws flat lines spanning only that day’s bars.
Similarly, at the close of Friday’s weekly candle and the last bar of each calendar month, it draws the completed week’s and month’s high/low ranges.
All lines are deleted and redrawn only once per period completion, ensuring no forward painting or hidden repainting logic.
Key Features
No repaint: levels appear exactly once, immediately after the period closes
Period‑specific: lines confined to the bars of the prior day, week or month
Customizable: toggle each period on/off; choose independent colors, line styles (Solid, Dotted, Dashed) and width
Lightweight: minimal calculations for maximum performance on any timeframe
How to Use
Apply to any chart (M1 to MN).
In the Inputs panel, enable the levels you need: Yesterday, Last Week or Last Month.
Adjust High and Low line color, style and thickness to suit your chart layout.
Use these historic levels for support/resistance, breakout confirmation or confluence with other tools.
Inputs
Show Yesterday’s High: toggle yesterday’s high line
Show Yesterday’s Low: toggle yesterday’s low line
Show Last Week’s High: toggle last week’s high line
Show Last Week’s Low: toggle last week’s low line
Show Last Month’s High: toggle last month’s high line
Show Last Month’s Low: toggle last month’s low line
High Line Color / Low Line Color: choose colors for each set of lines
High Line Style / Low Line Style: select Solid, Dotted or Dashed
Line Width: adjust overall thickness
Disclaimer
This script is provided “as‐is” under the Public License. It is intended for educational and analytical purposes only and does not constitute trading or investment advice. Past performance does not guarantee future results. Always perform your own analysis and manage risk responsibly.