Stochastic RibbonA series of highs and lows of different lengths to create a ribbon-like indicator to emulate the stochastic oscillator's top (100), middle (50) and bottom (0). Traders can determine the strength of the support and resistance by the number of converging lines, choose price points and visualise momentum waves.
Inputs:
Theme: multiple colours/themes (theme 2)
Length: high/low length (14)
Start: plot number to start ribbon on (1)
PlotNumber: number of plots to show; maximum 10 per top, middle, bottom (10)
Example:
Length: 14
Start: 5
PlotNumber: 10
"low" için komut dosyalarını ara

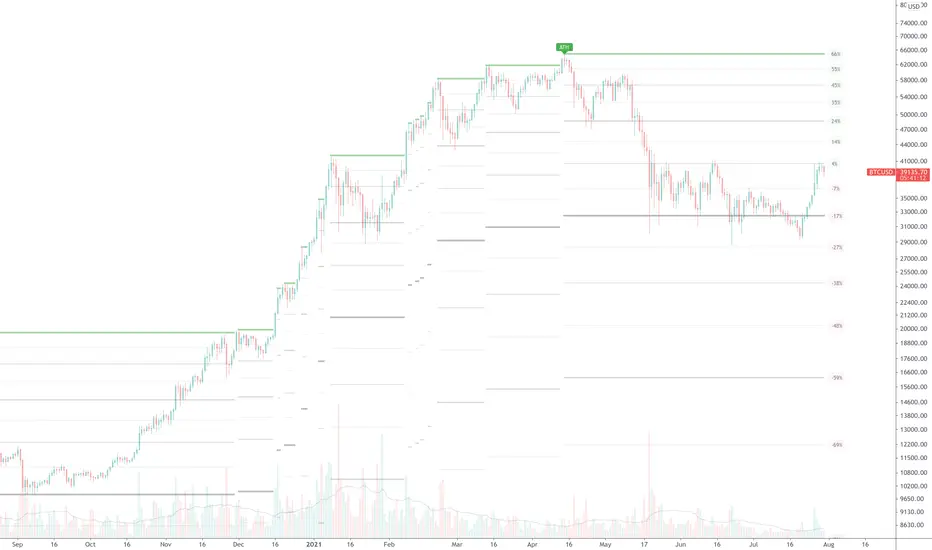
True ATH/ATL w/ labelsPlots the All Time High and All Time Low, with optional labels when a new ATH/ATL is created. Reaches all the way back in history for the true high/low, not limited to the most recent 5000 candles like most scripts. Works on all time frames.
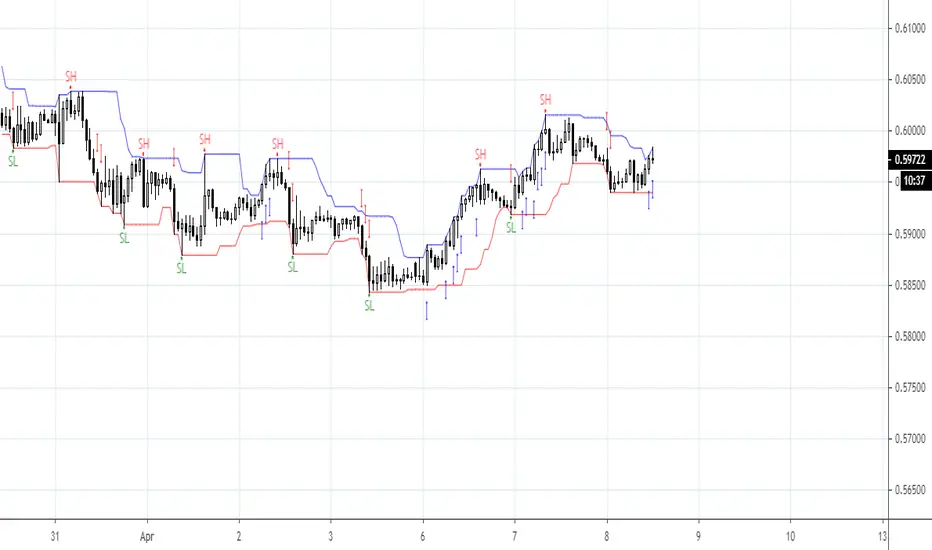
High/Low stopFirst of all let me quote some important points :
• You need stops; a trade without a stop is a gamble.
• You need to know where you’ll put your stop before you enter
a trade.
• Everybody needs hard stops.
• Whenever you change a stop, you may move it only in the direc-
tion of the trade.
There is a variety of techniques available to traders who like to use
trailing stops:
• You can use a multibar low as a trailing stop; for example, you
can keep moving your stop to the lowest low of the last three
bars (but never against your trade).
• You can trail prices with a very short moving average and use its
level for a trailing stop.
• You can use a Chandelier stop—every time the market makes a
new high, move the stop within a certain distance from the top—
either a specific price range or a number based on an ATR (aver-
age true range). Any time your stock makes a new high, you place
your stop within that distance from the top, like hanging a chan-
delier (this method is described in Come into My Trading Room).
• You can use a Parabolic stop .
• You can use a SafeZone stop .
• You can use a Volatility-Drop stop (described below, for the first
time in trading literature).
• You can use a Time Stop to get out of your trade if it does not
move within a certain time. For example, if you enter a day-trade
and the stock does not move within 10 or 15 minutes, it is clearly
not doing what you expected and it is best to scratch that trade.
If you put on a swing trade which you expect to last several
days, but then a week goes by and the stock is still flat, it is
clearly not confirming your analysis and the safest action would
be to get out.
This is a summary taken from Dr Elder book and this indicator i coded from one of his book where he briefly mention this trailing stop technique but don't dive a lot into it, but still i found to be very effective.
You can use even the short stop (the green dots) as an entry point.

Number Bars High/Low BreakoutThis indicator is a visual representation of the price swing indicator and can be seen used alongside it. If both indicators are set at the same input settings the Swing Highs will show when there is a break of the blue line (which indicates the high of the previous "X" number of bars) and the Swing Lows will show when there is a break of the red line (which indicates the low of the previous "X" number of bars)
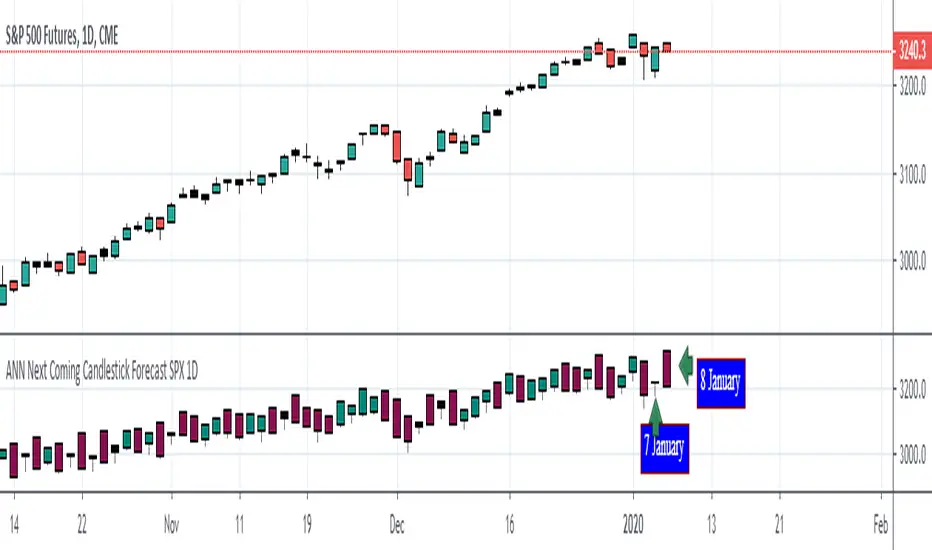
ANN Next Coming Candlestick Forecast SPX 1D v1.0WARNING:
Experimental and incomplete.
Script is open to development and will be developed.
This is just version 1.0
STRUCTURE
This script is trained according to the open, close, high and low values of the bars.
It is tried to predict the future values of opening, closing, high and low values.
A few simple codes were used to correlate expectation with current values. (You can see between line 129 - 159 )
Therefore, they are all individually trained.
You can see in functions.
The average training error of each variable is less than 0.011.
NOTE :
This script is designed for experimental use on S & P 500 and connected instruments only on 1-day bars.
The Plotcandle function is inspired by the following script of alexgrover :
Since we estimate the next values, our error rates should be much lower for all candlestick values. This is just first version to show logic.
I will continue to look for other variables to reach average error = 0.001 - 0.005 for each candlestick status.
Feel free to use and improve , this is open-source.
Best regards.
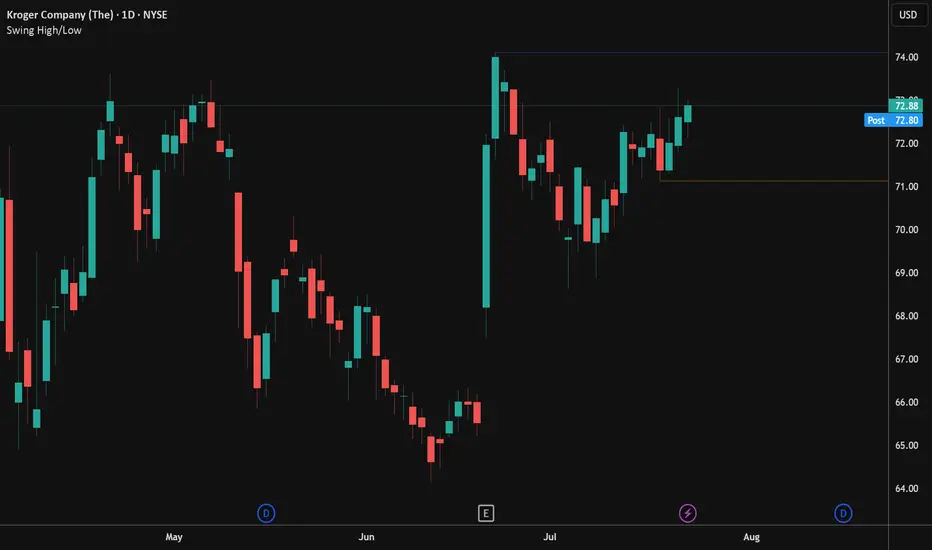
Swing High/LowPlots the swing high and low points based on user configurable look back settings. Also allows you to plot the most recent swing low as a horizontal line for obvious stop point on long setups.
15M 2PM-3PM High/LowThis script will draw horizontal lines based on the high and low values between 2PM and 3PM (inclusive 2PM & 3PM) on 15 minute time frame. This indicator can be used in 15 minute time frame to plot the high and low lines correctly. This indicator can be used for previous day 2PM-3PM range breakout or breakdown trades.

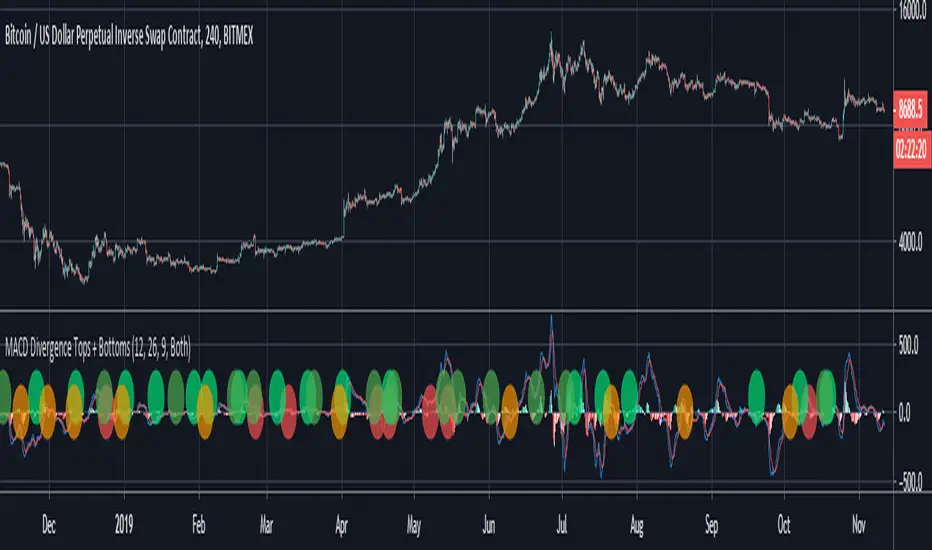
MACD Divergence Tops + BottomsMACD Indicator which plots local peaks and troughs in divergence.
"Classic" Divergence is specified as:
- A higher price, with reduced MACD high --> Potential Sell Point
- A lower price, with higher MACD low --> Potential Buy Point
"Alternative" Divergence is specified as:
- A higher MACD high, with reduced price --> Potential Sell Point
- A lower MACD low, with higher price --> Potential Buy Point
MACD Divergence should be used in combination with other indicators. This indicator identifies local tops and bottoms, with potential for macro trend shifts.
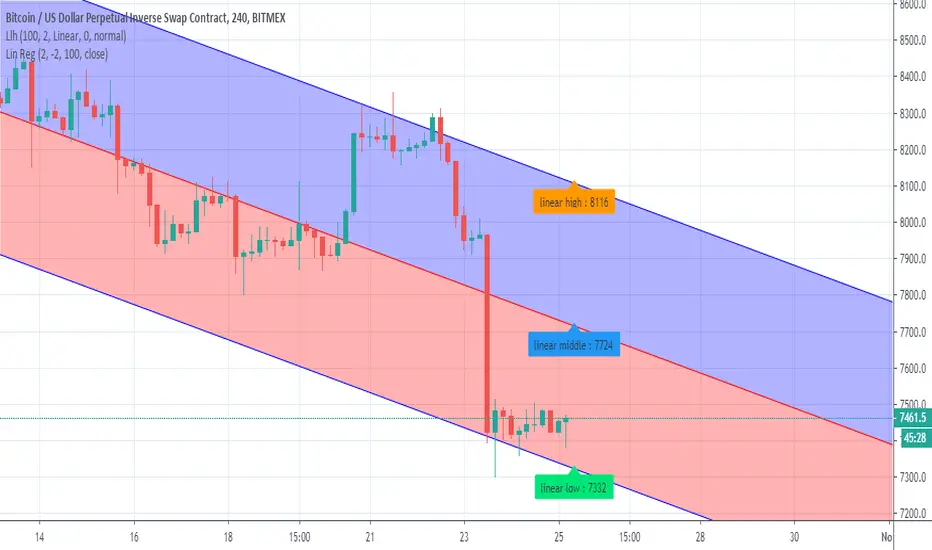
Linear low highcode from linear regression used with author consent
So this metod give us the high the middle and the low of the linear trend
you can use it with regular pivots or by its own in oreder to determine the high and the low
I advise to add linear regression to this indicator
finding the lowEasy script that give you to find low points in much more effective way ,so it very good to find entry
exit can be by fibs , pivot or take profit system etc
but the hardest thing in a trade is to locate where the low is found
so using this special rsi +mtf system of no repaint it more easy to detect it


52 Week High/Low to YesterdayThis script adds the 52 weeks (one year) high/low to the chart but it wouldn't update the value on the current trading day, so that it would remain at the same level for the whole trading day. It can come really handy for day trading the day of the 52 weeks high/low breakout/breakdown.

High/Low Breaker v2Specify Candles back to determine if high/low has been broken. Can choose to either calculate with source of high/low or close.

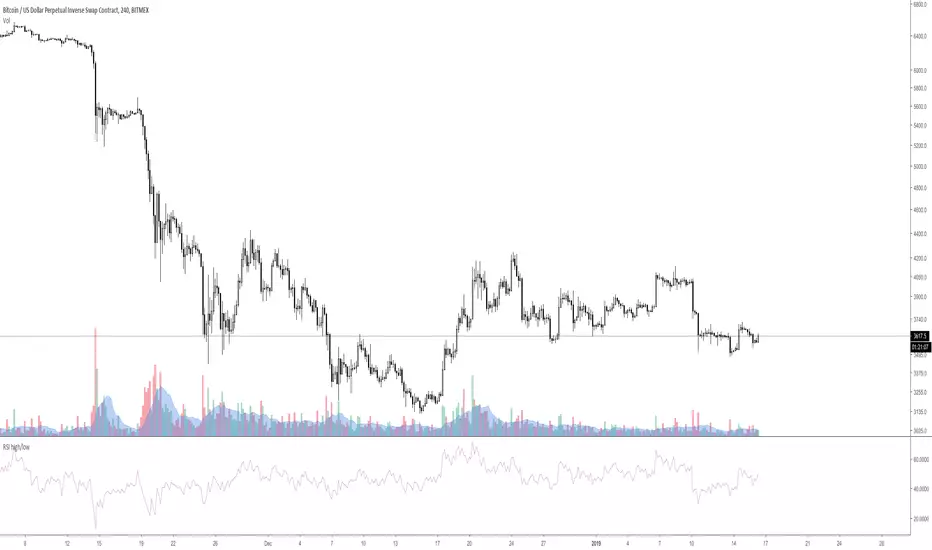
RSI high/low [experiment]This is an experiment.
This is a RSI based on candle high / low instead of close.
If the candle is up / green then the high is used.
If the candle is down / red then the low is used.
Feel free to ask if you have any question.
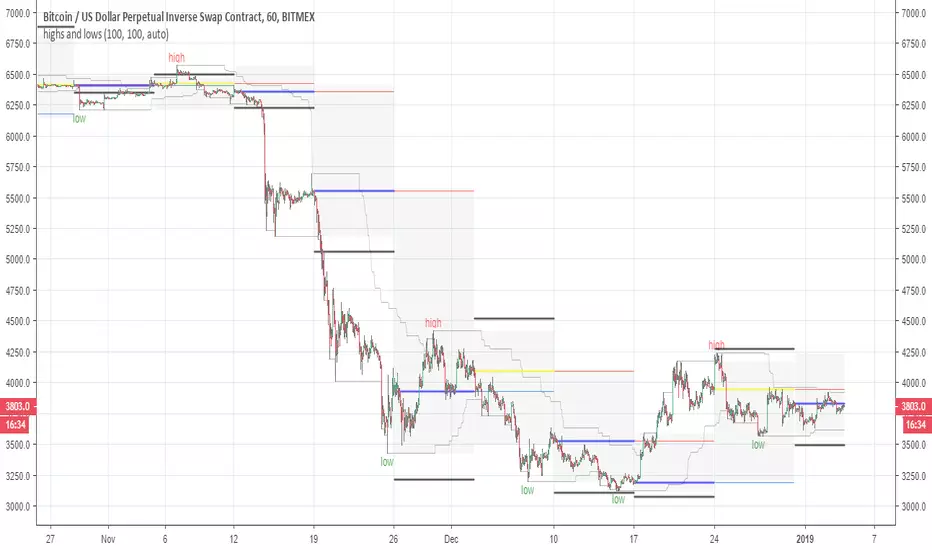
highs and lowsThis system allow you to detect the highs and the lows based on open and close and donchian channel
with this system you can easy find the resistance and the support level
good from 4 hour chart to 5 min chart
The black line are the 10% margin which you can use as you exit point or your stop once we find a low by the donochian cahannel
The system try to help you to find the target of your take profit once you decided to go either short or long
There is no alerts but they can be added if one wish to do it
one can add TP to it or change settings as he wish if want to play with code. I keep it as idea only
main scripts are made from scripts that are open in TV
15 min graph
4 hour graph
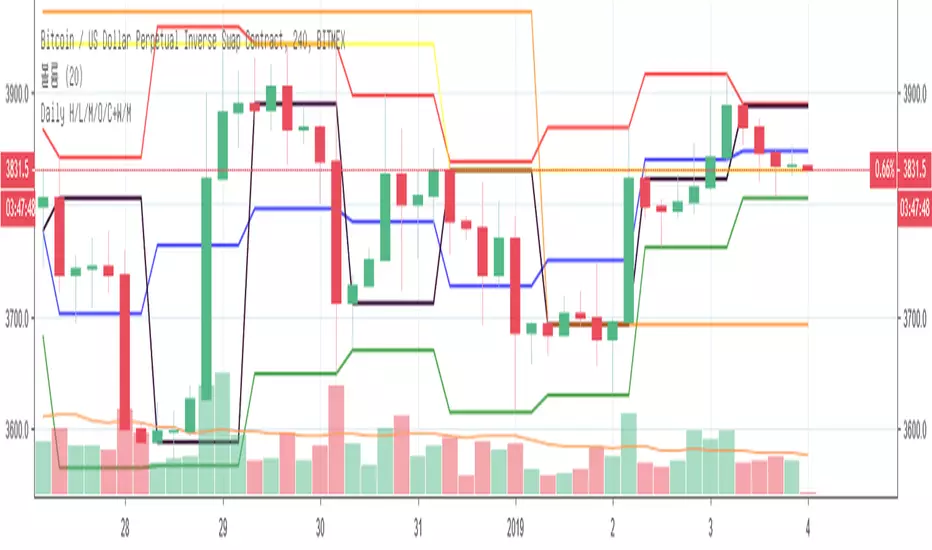
Daily High/Low/Mid/Open/CloseI modify existing scripts about Daily High/Low, Daily Open, Previous Daily Close, etc.
Daily High = red color
Daily Low = green color
Daily Mid = blue color
Daily Open = purple color
Previous Daily Close = black color

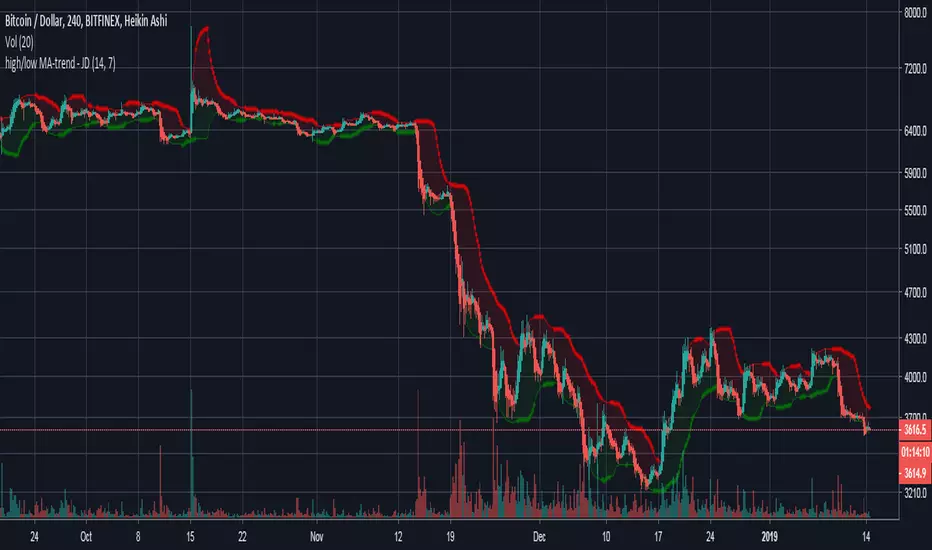
high/low MA-trend - JDShort script for trend indication taking a moving average of the highs and the lows seperately.
Lookback period for the highs/lows can be altered.
Ema length can be altered.
JD.
[M]HLC PlotsHLC Plots
Draws points (lines) to high low and close. In some trading situations, this method is more convenient than candles or bars.
--------------------------------------
Рисует точки(линии) по high low и close. В некоторых ситуациях торговли такой способ бывает удобней, чем свечи или бары. На вкус и цвет все фломастеры разные =)

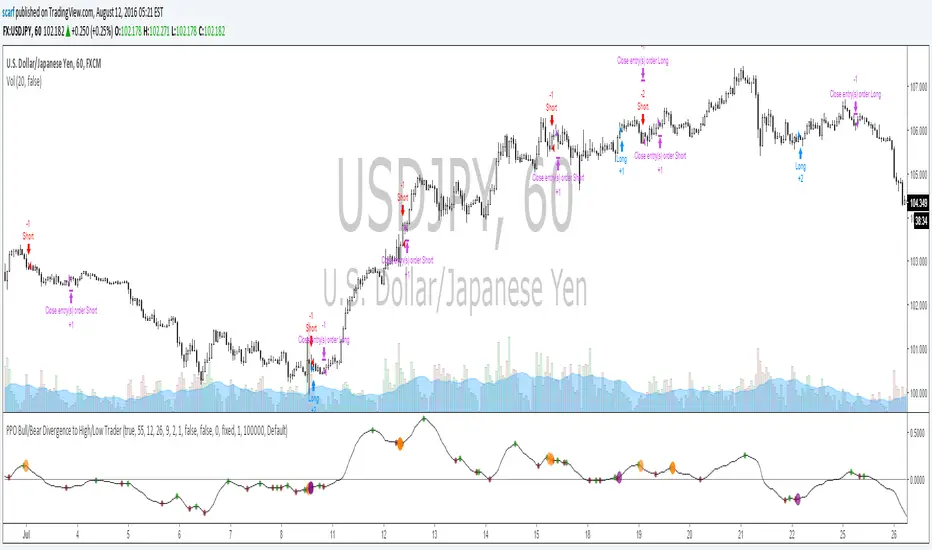
PPO Bull/Bear Divergence to High/Low StrategyA simple strategy that uses the PPO divergences to open trades and the highs/lows to close them. Credit to Pekipek for this PPO Divergence indicator (I changed the visuals a bit)
STRATEGY
Purple circle - bullish divergence - enter LONG
Orange circle - bearish divergence - enter SHORT
Green dot - high point - exit LONG
Red dot - low point - exit SHORT
That's it. Not very profitable, but I like Pekipek's indicator a lot so figured I'd see what a strategy was like. Would love to see any variations.
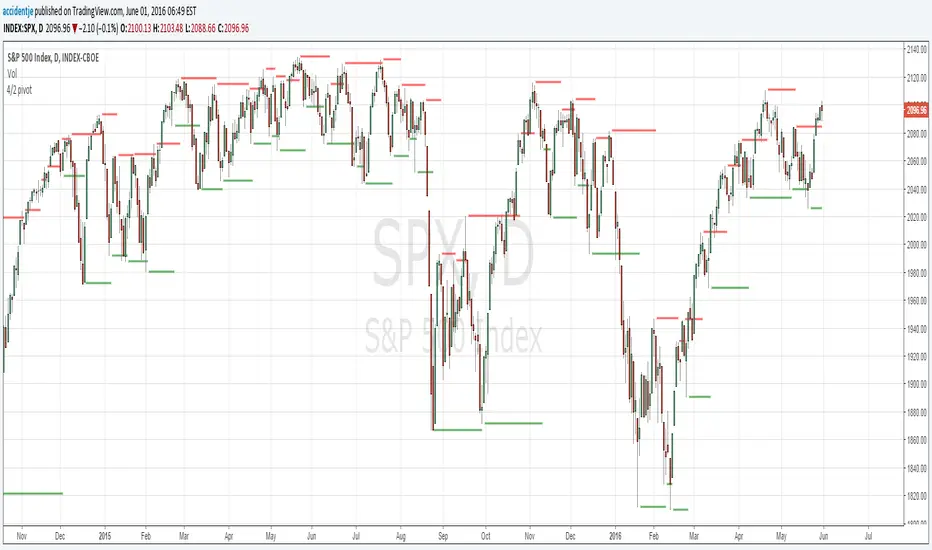
4/2 pivot levelsPlots...
Confirmed highs when 1. it's higher than the 4 prior (lower) highs AND 2. higher than the 2 following (lower) highs.
Confirmed lows when 1. it's lower than the 4 prior (higher) lows AND 2. lower than the 2 following (higher) lows.
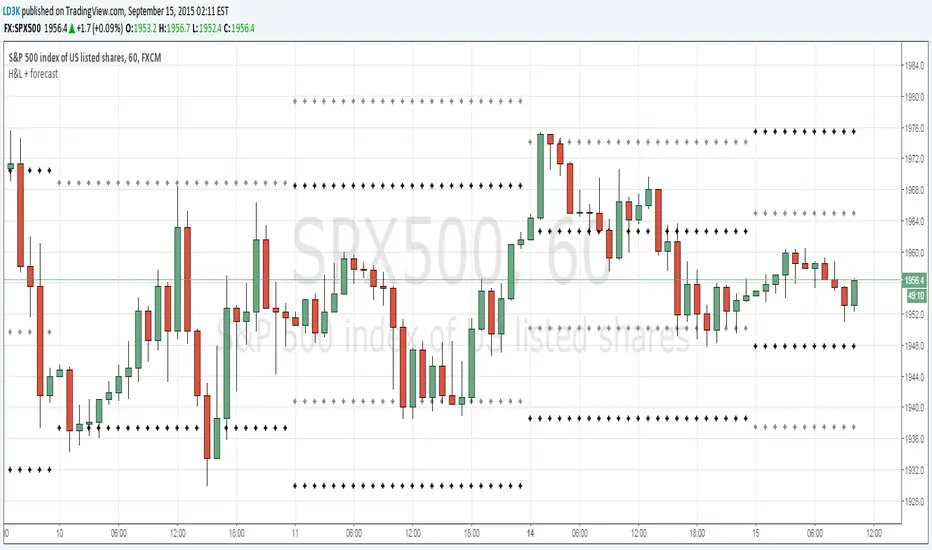
Previous H/Ls and Forecast H/LPlots the previous periods High and Lows (black crosses) and forecasts the next day's High and Lows (gray crosses)
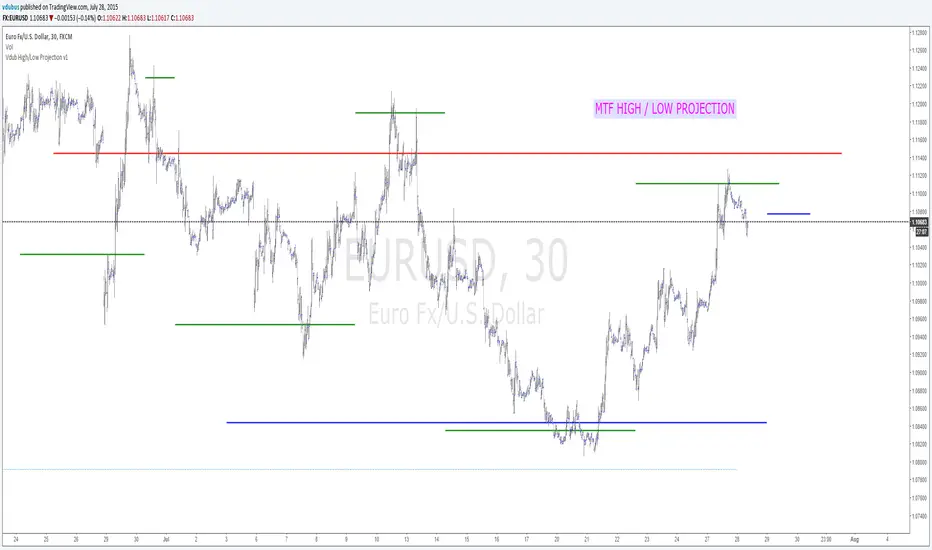
Vdub High/Low Projection v1Vdub High/Low Projection v1
Modified London Underground /
3 x MTF High/Low / projected targets Hourly, Daily, Weekly