PDH & PDL Indicator: Previous Day's High/Low with AlertsThe PDH & PDL Indicator plots the Previous Day's High (PDH) and Previous Day's Low (PDL) directly on the chart, providing a clear visual reference for key price levels. These levels are often used by traders to identify potential breakout or breakdown zones and to gauge market strength or weakness.
Features:
PDH (Green Line) : Represents the high of the previous trading day.
PDL (Red Line): Represents the low of the previous trading day.
Alerts:
Get notified when the price crosses above PDH or below PDL.
Custom alert messages to keep you informed in real-time.
Use Cases:
Identify key breakout and breakdown points for potential trade entries or exits.
Confirm the strength of a trend by monitoring price action relative to PDH and PDL.
Useful for intraday, swing, and positional traders who rely on historical price levels for strategy development.
"low" için komut dosyalarını ara

Session Highs and Lows IndicatorThis indicator marks the high and low levels for key trading sessions, allowing traders to identify significant price zones across different markets. The default session times are defined in UTC and will automatically adjust to your local timezone:
- **London Session (07:00-09:00 UTC)**: Tracks intraday liquidity zones for potential highs/lows.
- **New York Session (12:00-14:00 UTC)**: Highlights volatility during market overlaps with Europe.
- **Asia Session (23:00-01:00 UTC)**: Confirms trend continuation and retracement opportunities.
- **New York Close Session (19:00-21:00 UTC)**: Focuses on reversals and breakout tests during global transitions.
The script dynamically updates session highs and lows with clear labels and dashed horizontal lines for better visualization. **Time ranges can be adjusted to suit your trading preferences.** This makes the indicator flexible and effective for liquidity hunting, trend trading, and breakout strategies.

Dynamic Time Period CandlesThis indicator gives the dynamic history of the current price over various time frames as a series of candles on the right of the display, with optional lines on the chart, so that you can assess the current trend more easily.
In the library I found lots of indicators that looked at the previous xx time period candle, but they then immediately switched to the new xx time candle when it started to be formed. This indicator looks back at the rolling previous time period. With this indicator, you can clearly see how price has been behaving over time.
IMPORTANT SETUP INFO:
Initially, you must go into the settings and select the timeframe (in minutes) that your chart is displaying. If you don't do this then the indicator will look back the wrong number of candles and give you totally wrong results.
You can then setup how high you want the candle labels to be on the chart.
Then you can select settings for each candle that you want displayed. Anywhere between 1 and 5 different timeframes can be displayed on the chart at once.
I initially published an indicator called 'Dynamic 4-Hour Candle (Accurate Highs and Lows)', but this new indicator is so different that it needs to be forked and published as a separate indicator. The reasons for this are below:
The original indicator only looked at the previous 4 hour time period. This indicator allows the user to select any time period that they choose.
The original indicator only looked at one time period. This indicator allows to select between one and five time periods on the chart at once.
The original indicator did not put lines on the chart to show the lookback period and the highs and lows of that time period. This indicator does both those things.
The name of the original indicator in no way now describes what this new indicator is capable of, and would be very misleading to anyone who came across it. This new indicator has a name that much more accurately reflects what its' purpose and functionality is.

High & Low Of Custom Session - Breakout True Open [cognyto]This indicator is based on the High & Low Of Custom Session - OpeningRange Breakout (Expo) created by Zeiierman.
It adds new functionality and enhances existing settings, targeting ES, NQ, and YM:
Manages session defaults to 12:00 to 13:00
New true opening fully customizable (default 13:00)
Manages timeframe visualization (default 15m and below)
Manages session draw length until the end of the current session (default NY)
Manages previous sessions, allowing the to be hidden
Improves timezone selection (default NY)
Following the strategy called Paradox detailed by DayTradingRauf, it works with indices like ES, NQ, and YM.
The rules consider three possible profiles:
First
AM session as consolidation (08:00-12:00)
Lunch hour range as consolidation (less than 100 points)
PM session breaking either side of the session range
Second
AM session trending lower (08:00-12:00)
Lunch hour range as consolidation (less than 100 points)
PM session trending higher
Third
AM session trending higher (08:00-12:00)
Lunch hour range as consolidation (less than 100 points)
PM session trending lower
After the session ends, the opening price at 13:00 is automatically drawn as it is a key point for the entry strategy.
The strategy can be monitored using a 5-minute or 15-minute timeframe as follows:
- Wait for a liquidity hunt (either the high or low of the lunch session range or AM is taken).
- If liquidity is taken, switch to the 1-minute timeframe and wait for a CISD (change in the state of delivery), where the price closes below an OB, or consider a breaker block or iFVG to enter the trade.
- Bullish entries should happen below the opening price at 13:00, and bearish entries should happen above.
- Consider a 1:2 reward ratio. However, runners can target the opposite side of the range that was not yet taken.
This indicator is for informational purposes only and you should not rely on any information it provides as legal, tax, investment, financial or other advice. Nothing provided by this indicator constitutes a solicitation, recommendation, endorsement or offer by cognyto or any third party service provider to buy or sell any securities or other financial instruments in this or any other jurisdiction in which such solicitation or offer would be unlawful under the securities laws of such jurisdiction.

Open interest buildup & Session Open high-lowThis indicator is to be used on srcipts in Futures Segment.
1. It visually displays in tabular format the change in open interest and the change in price compared to the previous day.
2. It also displays the scenario where open price of session is near high price of session or low price of session, indicating a emergence of strong sellers or strong buyers from start of session respectively.
3. A positive change in open interest and a positive change in price is denoted by a long buildup and open price near low price is an additional confirmation for a probable long scenario in the script.
4. A positive change in open interest and a negative change in price is denoted by a short buildup and open price near high price is and additional confirmation for a probable short scenario in the script.
Key features of the indicator include:
Override Symbol Input: Traders can override the default symbol and input their preferred symbol for analysis.
Open Interest Data: The indicator retrieves open interest data for the selected symbol and time frame, facilitating analysis based on changes in open interest.
Dashboard: The indicator features a customizable dashboard that displays key information such as build-up conditions, OI change, and price change.
Build-Up Conditions: The indicator identifies long build-up and short build-up scenarios based on user-defined thresholds for OI change and price change percentages.
Customization Options: Traders have the flexibility to customize various aspects of the indicator, including colors for long build-up, short build-up, positive OI change, negative OI change, positive price change, and negative price change.
Label Plots: Buy and sell labels are plotted on the chart to highlight potential trading opportunities. Traders can customize the colors and text colors of these labels based on their preferences.
Overall, the indicator offers traders a comprehensive tool for analyzing price movements and open interest changes, helping them make informed trading decisions in the futures segment.

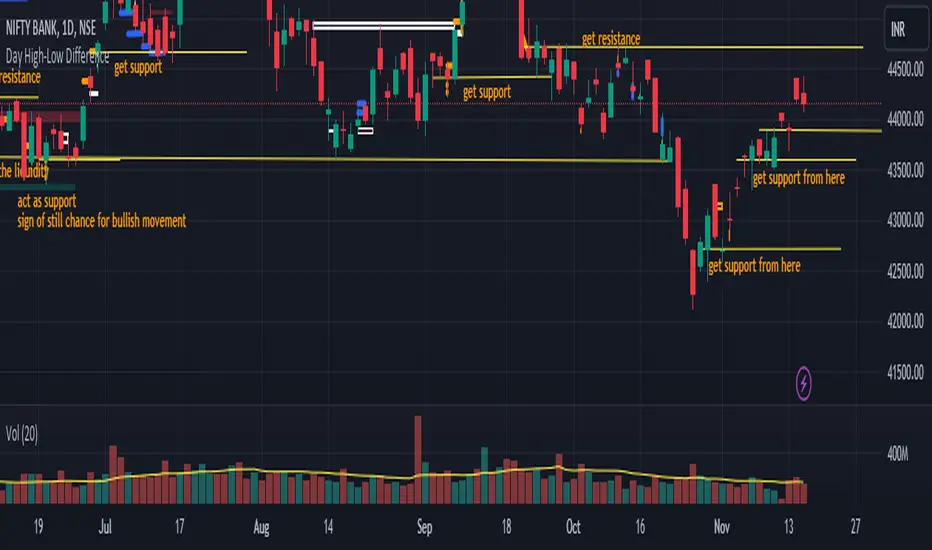
Day High-Low Difference ( The one trader )The "Day High-Low Difference" candle tool is an indicator that calculates and visually represents the difference between the highest price (day high) and the lowest price (day low) within each candle on a given chart. This tool is useful for traders and analysts to quickly assess the volatility or range of price movement within individual candles.
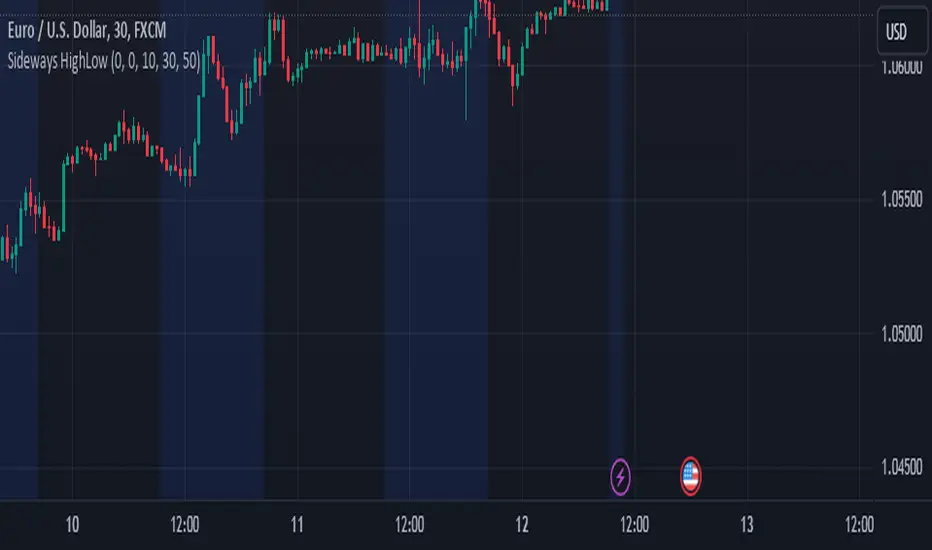
Sideways Market Detector with High/Low NJRCalculate the range as the difference between the high and low prices.
The maxRange input to specify the maximum allowable range that defines a sideways market.
The background color is set to blue during sideways market conditions, and it's transparent to some extent (transp=90). When the market is not sideways, the background color is not changed.
The indicator marks the start and end of the session with red triangles.
When the price range (high - low) is within the specified threshold, the indicator will indicate a sideways market with a blue background.
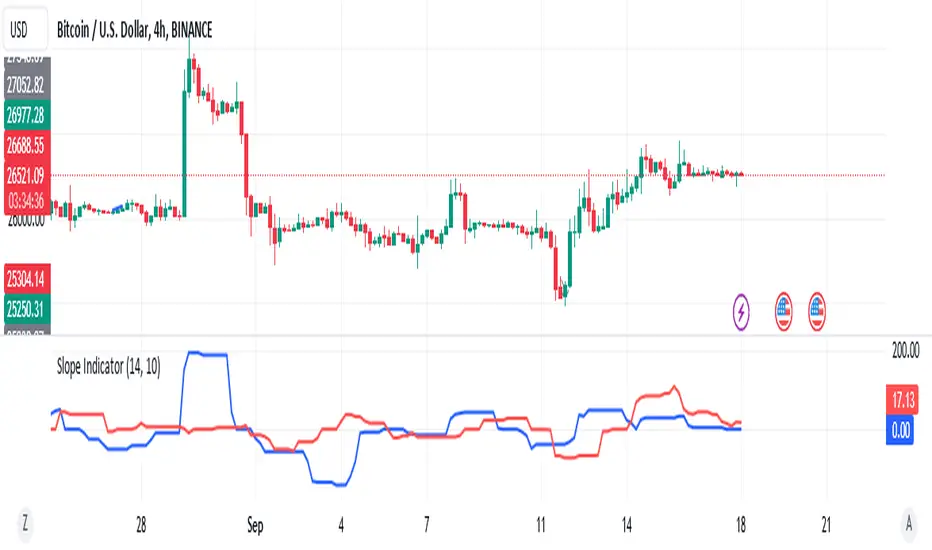
Slope Indicator of Highest Highs and Lowest Lows
In this example, the indicator calculates the slope between the highest high value of the current period and the highest high value candles bars ago. The result is plotted on the chart as a line.
And this example calculates the slope between the lowest low value of the current period and the lowest low value candles bars ago. It then plots the slope on the chart using a red line.
Feel free to adjust the input parameters and modify the code to fit your specific requirements. If you have any more questions or need further assistance, feel free to ask!
OBV Daily High Low Box Realtime (On Balance Volume)Overview
This indicator plots horizontal lines at the daily high and low levels of the On Balance Volume (OBV).
The numerical lines for each day are updated in real-time as the OBV high and low values change.
Please note that there are limitations on how far back in history the indicator can go due to Pine Script's object drawing limitations.

YDH/YDL to Current Day H/L - Zones- Draw boxes on the intersections between yesterday's high/low and the day's after high/low
This will help you to visualize areas at extreme points where algo hasn't yet pushed price to recover them

Key Levels (Open, Premarket, & Yesterday)OVERVIEW
This indicator automatically identifies and draws recent high-probability support and resistance levels (recent key levels). Specifically, yesterdays highs / lows, premarket highs / lows, as well as yesterdays end of day Volume Weighted Average Price and trader specified Moving Average.
This is most useful on charts with intraday time frames (1 minute, 5 minute etc.) commonly used for day trading. This is not ideal for larger time frames (greater than 1 hour) commonly used for swing trading or identifying larger trends.
INPUTS
You can configure:
Line size, style, and colors
Label colors
Which key levels you want to see
Moving Average Parameters
Market Hours and Time Zone
DEV NOTES
This script illustrates:
A method for iterative management of more complex data objects (not just discrete values) with loops and arrays.

BTC Log High/LowThis indicator aims to display the price index of Bitcoin based on its logarithmic high and low values. Indicator calculates the logarithmic high and low values of Bitcoin using specific mathematical formulas and then applies a price index formula to obtain a value for each bar on the chart. The resulting value is plotted on the chart as a line, representing the Bitcoin price index.
The indicator also includes several horizontal lines at specific levels, which can be adjusted by the user. The lines are used to indicate important price levels and act as support and resistance levels. Additionally, the indicator includes two moving averages, a 100-period exponential moving average (EMA) and a 200-period EMA, which can be used to identify trends.

Statistics: High & Low timings of custom session; 1yr historyGet statistics of the Session High and Session Low timings for any custom session; based on around 1yr of data.
//Purpose:
-To get data on the 'time of day' tendencies of an asset.
-Narrow in on a custom defined session and get statistics on that session.
//Notes:
-Input times are always in New York time (but changing the timezone after setting WILL adust both table stats and background highlight correctly.
-For particularly long sessions, make sure text size is set to 'tiny' (very long vertical table), or adjust table to display horizontally.
-You'll notice most assets show higher readings around NY equities open (9:30am NY time). Other assets will have 'hot-spots' at other times too.
-Timings represent the beginning of a 15m candle. i.e. reading for 15:45 represents a high occurring between 15:45 and 1600.
-Premium users should get 20k bars => around 1year's worth of data on a 15minute chart. Days of history is displayed in the top left corner of the table.
//Limitations
-only designed and working on 15minute timeframe (to gather a full year of meaningful/comparable % stats, need 15minute 'buckets' of time.
-sessions cannot cross through midnight, or start at midnight (00:15 is ok). 00:15 >> 23:45 is the max session length. On BTC, same applies but 01:00 instead of midnight (all in NY time).
-if your session crosses through 'dead time' (e.g. 17:00-18:00 S&P NY time); table will correctly omit these non-existent candles, but it will add on the missing hour before the start time.
//Cautionary note:
-Since markets are not uncommonly in a trending state when your defined session starts or ends, the high/low timings % readings for start and end of session may be misleadingly high. Try to look for unusually high readings that are not at the start/end of your session.
Wheat (ZW1!) 15min chart; Table displayed vertically:
Nasdaq (NQ1!) 15m chart; Table displayed horizontally and with smaller text to view a very long custom session:

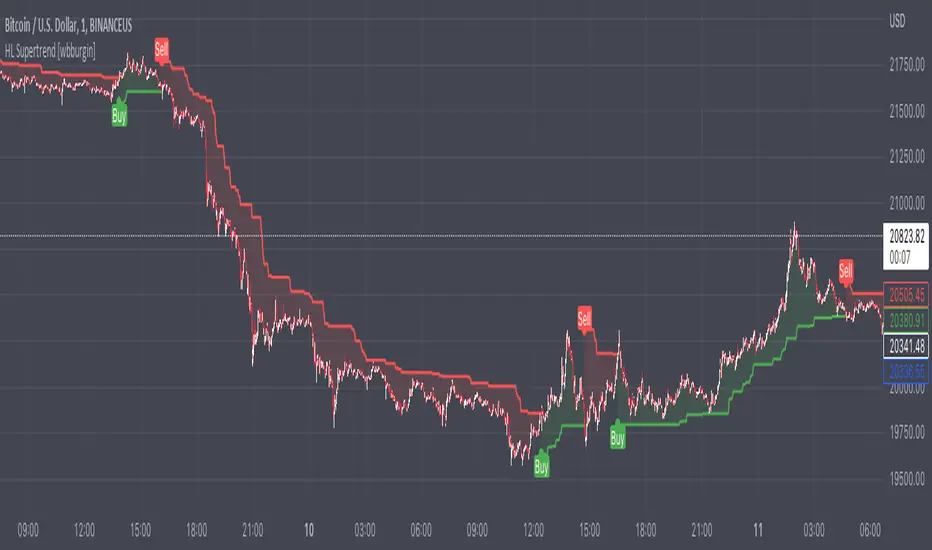
High/Low SupertrendThe High/Low supertrend uses an ATR produced from the highest and lowest points within the ATR lookback range, instead of from current highs and lows. This makes it less susceptible to false breakout attempts.
In the settings, you can choose whether you want the supertrend to calculate from the highest highs and lowest lows within the period, or the maxima of the opens and closes.
USAGE: I recommend using this supertrend as the arming mechanism to the buy or sell, instead of the trigger itself. This is because in ranging markets the supertrend will flip on the current high or current low.
Consecutive Unswept Lower Highs/ Higher Lows CounterCounts consecutive Lower Highs and Higher Lows; number resets to zero when previous pivot high or low gets swept
-To help give an idea of when a retracement / run-on-stops may be overdue. i.e. the higher the counter number grows, the longer we've gone without a proper retracement.
//inputs//
~pivot lookback/lookforward: increase this for more significant pivot highs and lows.
~number of pivot high 'counter' labels (pairs) to show in history.
~formatting options.

Simple Zigzag UDT█ OVERVIEW
This indicator displays zigzag based on high and low, which is using user-defined types (UDT) or objects .
█ CREDITS
LonesomeTheBlue
█ FEATURES
1. Label can be resized.
2. Label can be display either short (Eg : HH, LL, H, L, etc) and long (Eg : Higher Low, etc)
3. Color can be customized either contrast color of chart background, trend color or customized color.
█ EXAMPLES / USAGES

New Highs-New-Lows on US Stock Market - Main Chart Edition#### ENGLISH ####
This script visualizes divergences between the price and new highs and new lows in the US stock market. The indicator should be used exclusively on the US stock indices (timeframe >= D).
This is the indicator for the main chart. It should be used together with the subchart indicator of the same name. In order to get the same results between the main and subchart editions, the indicator settings must be manually adjusted equally in both charts.
The approach:
Let's take a bull market as an example. A bull market is characterized by rising highs and rising lows. We can therefore assume that with the rising prices, the number of stocks that form new highs also rises or at least remains constant. This confirms the upward trend and thus expresses that it is supported by the broad stock market. If the market forms new highs and the number of stocks forming new highs decreases at the same moment, these new index highs are no longer supported by the broad stock market but exclusively by a few highly capitalized stocks. This creates a bearish divergence between the index and the NHNL indicator. This means that the uptrend tends to be overheated and a correction becomes more likely. Stops should be drawn closer.
The approach applies conversely, of course, to downtrends as well.
The indicator itself:
The number of new highs and lows (NHNL) are determined using the data sources included in Tradingview, such as "INDEX:HIGN" for NYSE highs. This data is provided on a daily basis. For higher time units (week, month) the daily numbers are shown summed up and not only the Friday value like most other NHNL indicators.
The signal strength is determined on the basis of two factors. The stronger the signal, the clearer (less transparent) the line/arrow. The two factors are on the one hand the strength of the divergence in and of itself, and on the other hand the strength of the overriding trend. The trend strength is determined using a 50 EMA on the NHNL indicator.
To avoid displaying every small divergence and to reduce false signals, the threshold for the signal strength can be set in the indicator settings.
#### GERMAN #####
Dieses script visualisiert Divergenzen zwischen dem Preis und neuer Hochs sowie neuer Tiefs im US Aktienmarkt. Der Indikator sollte ausschließlich auf den US Aktienindizes verwendet werden (Timeframe >= D).
Dies ist der Indikator für den Hauptchart. Er sollte zusammen mit dem gleichnamigen Subchart Indikator verwendet werden. Um gleiche Ergebnisse zwischen Haupt- und Subchart Edition zu erhalten, müssen die Indikatoreistellung manuell in beiden Charts gleichermaßen eigestellt werden.
Der Ansatz:
Nehmen wir uns als Beispiel einen Bullenmarkt. Ein Bullenmarkt zeichnet sich durch steigende Hochs und steigende Tiefs aus. Man kann also annehmen, dass mit den steigenden Preisen auch die Anzahl der Aktien die neuen Hochs ausbilden steigt oder zumindest konstant bleibt. Dies bestätigt den Aufwärtstrend und drückt somit aus, dass dieser vom breiten Aktienmarkt mitgetragen wird. Wenn der Markt neue Hochs bildet und die Anzahl der Aktien, die neue Hochs bilden im selben Moment sinkt, so werden diese neuen Indexhochs vom breiten Aktienmarkt nicht mehr getragen sonder ausschließlich von wenigen hochkapitalisierten Aktien. Es entsteht eine bärische Divergenz zwischen Index und dem NHNL Indikator. Das bedeutet, dass der Aufwärtstrend tendenziell überhitzt ist und ein Korrektur wahrscheinlicher wird. Die Stops sollten näher herangezogen werden.
Der Ansatz gilt umgekehrt natürlich auch bei Abwärtstrends.
Der Indikator an sich:
Die Anzahl der neuen Hochs und Tiefs (NHNL) werden anhand der in Tradingview enthaltenen Datenquellen wie z.B. "INDEX:HIGN" für die NYSE Hochs ermittelt. Diese Daten werden auf Tagesbasis bereitgestellt. Für höher Zeiteinheiten (Woche, Monat) werden die Tageszahlen aufsummiert dargestellt und nicht wie bei den meisten anderen NHNL Indikatoren nur der Freitagswert.
Die Signalstärke wird Anhand zweier Faktoren ermittelt. Je stärker das Signal um so deutlicher (weniger transparent) die Linie/der Pfeil. Die zwei Faktoren sind zum einen die stärke der Divergenz an und für sich, sowie zum anderen die Stärke des übergeordneten Trends. Die Trendstärke wird anhand eines 50er-EMA auf den NHNL-Indikator ermittelt.
Um nicht jede kleine Divergenz anzuzeigen und um Fehlsignale zu reduzieren, kann die Schwelle für die Signalstärke in den Indikatoreinstellungen festgelegt werden.
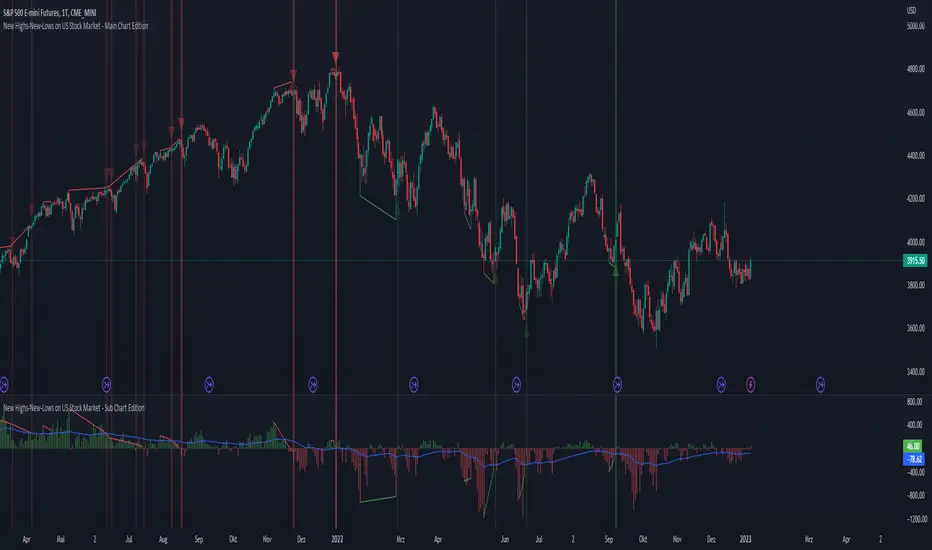
New Highs-New-Lows on US Stock Market - Sub Chart Edition#### ENGLISH ####
This script visualizes divergences between the price and new highs and new lows in the US stock market. The indicator should be used exclusively on the US stock indices (timeframe >= D).
This is the indicator for the sub chart. It should be used together with the main chart indicator of the same name. In order to get the same results between the main and subchart editions, the indicator settings must be manually adjusted equally in both charts.
The approach:
Let's take a bull market as an example. A bull market is characterized by rising highs and rising lows. We can therefore assume that with the rising prices, the number of stocks that form new highs also rises or at least remains constant. This confirms the upward trend and thus expresses that it is supported by the broad stock market. If the market forms new highs and the number of stocks forming new highs decreases at the same moment, these new index highs are no longer supported by the broad stock market but exclusively by a few highly capitalized stocks. This creates a bearish divergence between the index and the NHNL indicator. This means that the uptrend tends to be overheated and a correction becomes more likely. Stops should be drawn closer.
The approach applies conversely, of course, to downtrends as well.
The indicator itself:
The number of new highs and lows (NHNL) are determined using the data sources included in Tradingview, such as "INDEX:HIGN" for NYSE highs. This data is provided on a daily basis. For higher time units (week, month) the daily numbers are shown summed up and not only the Friday value like most other NHNL indicators.
The signal strength is determined on the basis of two factors. The stronger the signal, the clearer (less transparent) the line/arrow. The two factors are on the one hand the strength of the divergence in and of itself, and on the other hand the strength of the overriding trend. The trend strength is determined using a 50 EMA on the NHNL indicator.
To avoid displaying every small divergence and to reduce false signals, the threshold for the signal strength can be set in the indicator settings.
#### GERMAN #####
Dieses script visualisiert Divergenzen zwischen dem Preis und neuer Hochs sowie neuer Tiefs im US Aktienmarkt. Der Indikator sollte ausschließlich auf den US Aktienindizes verwendet werden (Timeframe >= D).
Dies ist der Indikator für den Subchart. Er sollte zusammen mit dem gleichnamigen Hauptchart Indikator verwendet werden. Um gleiche Ergebnisse zwischen Haupt- und Subchart Edition zu erhalten, müssen die Indikatoreistellung manuell in beiden Charts gleichermaßen eigestellt werden.
Der Ansatz:
Nehmen wir uns als Beispiel einen Bullenmarkt. Ein Bullenmarkt zeichnet sich durch steigende Hochs und steigende Tiefs aus. Man kann also annehmen, dass mit den steigenden Preisen auch die Anzahl der Aktien die neuen Hochs ausbilden steigt oder zumindest konstant bleibt. Dies bestätigt den Aufwärtstrend und drückt somit aus, dass dieser vom breiten Aktienmarkt mitgetragen wird. Wenn der Markt neue Hochs bildet und die Anzahl der Aktien, die neue Hochs bilden im selben Moment sinkt, so werden diese neuen Indexhochs vom breiten Aktienmarkt nicht mehr getragen sonder ausschließlich von wenigen hochkapitalisierten Aktien. Es entsteht eine bärische Divergenz zwischen Index und dem NHNL Indikator. Das bedeutet, dass der Aufwärtstrend tendenziell überhitzt ist und ein Korrektur wahrscheinlicher wird. Die Stops sollten näher herangezogen werden.
Der Ansatz gilt umgekehrt natürlich auch bei Abwärtstrends.
Der Indikator an sich:
Die Anzahl der neuen Hochs und Tiefs (NHNL) werden anhand der in Tradingview enthaltenen Datenquellen wie z.B. "INDEX:HIGN" für die NYSE Hochs ermittelt. Diese Daten werden auf Tagesbasis bereitgestellt. Für höher Zeiteinheiten (Woche, Monat) werden die Tageszahlen aufsummiert dargestellt und nicht wie bei den meisten anderen NHNL Indikatoren nur der Freitagswert.
Die Signalstärke wird Anhand zweier Faktoren ermittelt. Je stärker das Signal um so deutlicher (weniger transparent) die Linie/der Pfeil. Die zwei Faktoren sind zum einen die stärke der Divergenz an und für sich, sowie zum anderen die Stärke des übergeordneten Trends. Die Trendstärke wird anhand eines 50er-EMA auf den NHNL-Indikator ermittelt.
Um nicht jede kleine Divergenz anzuzeigen und um Fehlsignale zu reduzieren, kann die Schwelle für die Signalstärke in den Indikatoreinstellungen festgelegt werden.

High Low Color VolumeCompanion to High Low Color Bars, for strategies that don't use open and close levels. Color is determined using change in midpoints between high and low ( hl2 ), with degrees of shading based on threshold levels in the settings. The default threshold is 1.2 standard deviations of the change in hl2.
I use this to get a less noisy visual of volume-driven momentum.

Multi Timeframe Support & ResistanceAbout This Indicator
This indicator plots support (pivot low) and resistance (pivot high) using the chart timeframe and second editable timeframe.
How it can be useful
Having higher timeframe support and resistance plotted on a lower timeframe chart helps keep you grounded in the current range the price is in. This can be useful when wanting to avoid taking longs at resistance and shorts at support.
How to use
Adjusting the look back and look ahead will impact how frequently the support and resistance lines move. When Price breaks above resistance or below support, the lines will not move until a new pivot high and pivot low are detected.
Disclaimer: Not Financial Advice

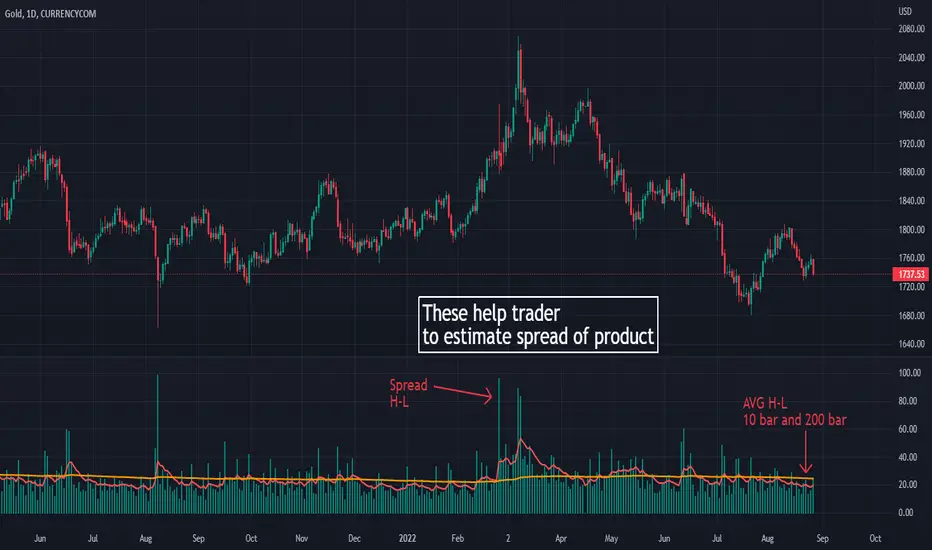
High low volatile
its purpose to make this script is learning how many spread on each product.
its help trader and me to estimate spread of High and low for make a better trade
Money management :
Its also useful to help trader to manage number of lot to take a risk on that trade
How it work?
I use High and low to calculate the different between on them
and I add an EMA 10 and EMA 200 to estimate spread of each product in many bar
On second picture , I use it on GOLD 1H timeframe . You can see that Gold in hour trade on my country time (thailand) It has more spread on 19.00-23.00 pm (in US time is 7.00-11.00)
It help trader to set time when to trade and when to leave
thank you
DKNS_Daily Weekly Monthly High Low Open CloseDKNS_Daily Weekly Monthly High Low Open Close, it will give daily weekly monthly high low close open

'last red low / last green high' exitThis is a good alternative to pivot points and ma lines to find long and short exit points (stop loss prices) for a trade.
When you hear traders say "set the stop loss to the recent swing", this indicator seems to do a reasonable job of finding those.
This script marks
the low of the most recent red candle
the high of the most recent green candle
in order to help identify a reasonable stop loss exit point for long and short trades.
You can also specify a distance threshold to the stop loss point.
How to use it.
Decide how far from the current price the exit should be (default 1.5%)
Use your chosen trading strategy to identify a long or short entry position
Add a long/short drawing to the close of the trade candle
Set the stop loos of your drawing to the exit line of this indicator
Set the take profit of your drawing using the desired risk to reward ratio
Note: A good rule is that if this indicator does not show a valid exit line, do not enter the trade.
Note: If the change of a new "last Green High" or the "last Red Low" is below 0.5%, the indicator will keep the previous values
