MTF High LowThis is a Multi-Time Frame High Low Indicator that plots the highest and lowest price levels of the chart timeframe and a user selected higher timeframe.
The length can be optimized by the user from settings (default value is 6 candles) and table position can also be adjusted.
The calculation does not takes into account the last candle price data to form a view using the current close price as described below:
If Close > mid value of High + Low, view is Bullish
If Close < mid value of High + Low, view is Bearish
The above is also calculated for the higher timeframe and view for both timeframe is updated in the chart.
The color coding is dynamic based upon the current close price levels and comparisons with High, Low and Mid values.
The mid values level plot is hidden by default and can be enabled and saved as default if the user likes so.
"low" için komut dosyalarını ara

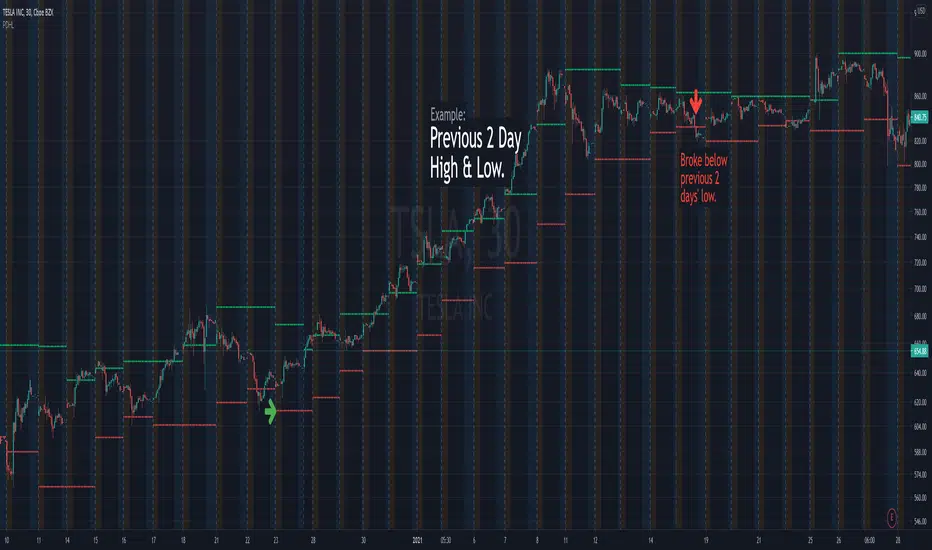
Previous Days High & LowRenders the high and low values from previous days.
Useful alert conditions are provided: "Less than low" and "Greater than high".
Configuration:
The number of days is configurable with a default of 1.
The source of the high and low values.
Use the close value instead of high and low values. Default is false.
The example above uses 2 days to demonstrate an exit strategy.
Sessions High & Low LevelsAutomatically plots high & low levels for multiple sessions. Clear session structure for intraday traders using price action, liquidity concepts, or session-based strategies.
Automatically plots the High & Low, for sessions such as London, New York, and Asia, with full customization for any custom session or timezone. These levels extend forward and adapt in real time, giving you a clear view of session-based structure and liquidity behavior.
Perfect for traders using ICT concepts, session narratives, or intraday market structure. Session ranges often act as key liquidity pools, breakout zones, and directional guides, this tool makes them easy to see at a glance.
Features:
Auto-plots High & Low for NY, London, and Asia sessions (customizable)
Fully customizable session times, colors, labels, and visibility options
Works across any assets

highs&lowsone of my first strategy: highs&lows
This strategy takes the highest high and the lowest low of a specified timeframe and specified bar count.
It will then takes the average between these two extremes to create a center line.
This creates a range of high middle and low.
Then the strategy takes the current market movement
which is the direct average(no specified timeframe and specified bar count) of the current high and low.
Using this "current market movement" within the range of high middle and low it determins when to buy and then sell the asset.
*********note***************
-this strategy is (bullish)
-works good with most futures assets that have volatility/ decent movement
(might add more details if I forget any)
(work in progress)

Day Week Month High & LowThis is a small little script that helps visually mark the high and lows of the DAY, WEEK or MONTH (of your choosing). It's best when paired with my High and Low Fibonacci Pivot Points indicator to help emphasize the high and lows of the day, week or month.
Rets High/Low (2.0 Special Uncensored Edition)This script can be used as a visual aid in seeing the last highs and lows of price in a specific time period. It automatically updates the plots if new highs or lows are made within the given lookback period.
This is a fairly basic version currently, with new added features coming in future updates such as range between high/low and half and whole number detection.

Daily HIGH/LOW strategyThis is a DAILY High/LOW strategy combined with a moving average and volume for more accuracy.
The rules are simple :
For long if we had a cross of the high with the previous high and close of the candle is above moving average and chaikin money flow volume is positive we have a long entry.
We exit when we cross down the moving average with the close of the candle.
For short if we had a crossdown of the low with the previous low and close of the candle is below moving average and chaikin money flow volume is negative we have a short entry.
We exit when we cross above the moving average with the close of the candle.
This strategy has no risk management inside so use it with caution.
If you have any questions, let me know

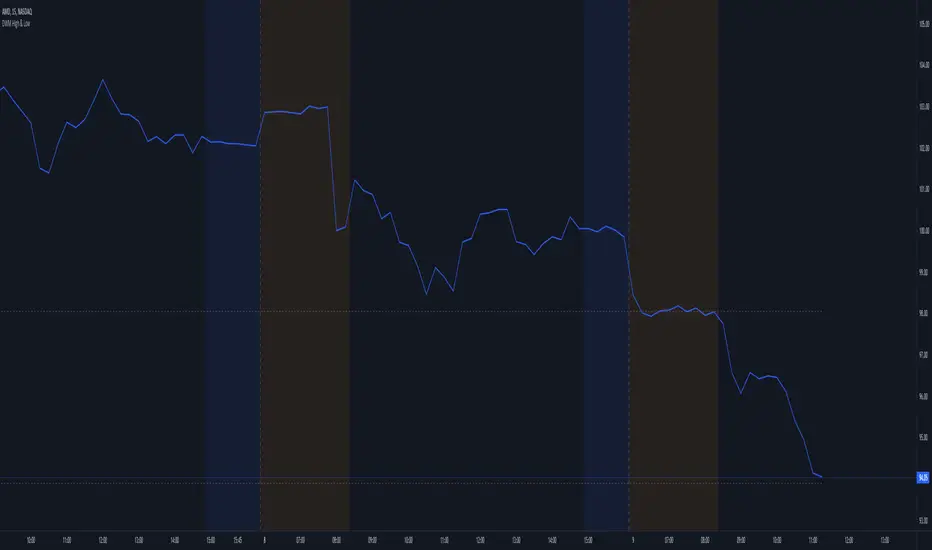
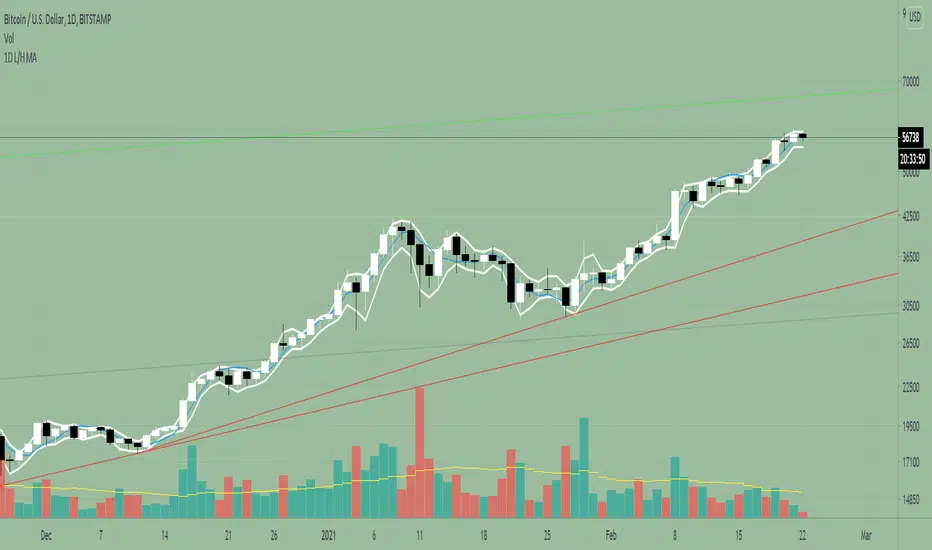
1D Low/High MA + Least Square Mean (3 indicators in 1)This indicator is a combination of 3 public indicators being:
* a standard Simple Moving Average with the source as the candle low & length of 2
* a standard Simple Moving Average with the source as the candle high & length of 2
* the Least Square Mean with a source of high + low /2 and length of 9
This combo was inspired by Tyler Coates who crafted EMASAR.
He regularly uses the a SMA with source of Low / High and length of 2 for defining trading daily ranges as well as the Least Square Mean for calculations in the his trading which he teaches via youtube.
I hope this indicator will reduce time spent on setting up charts.
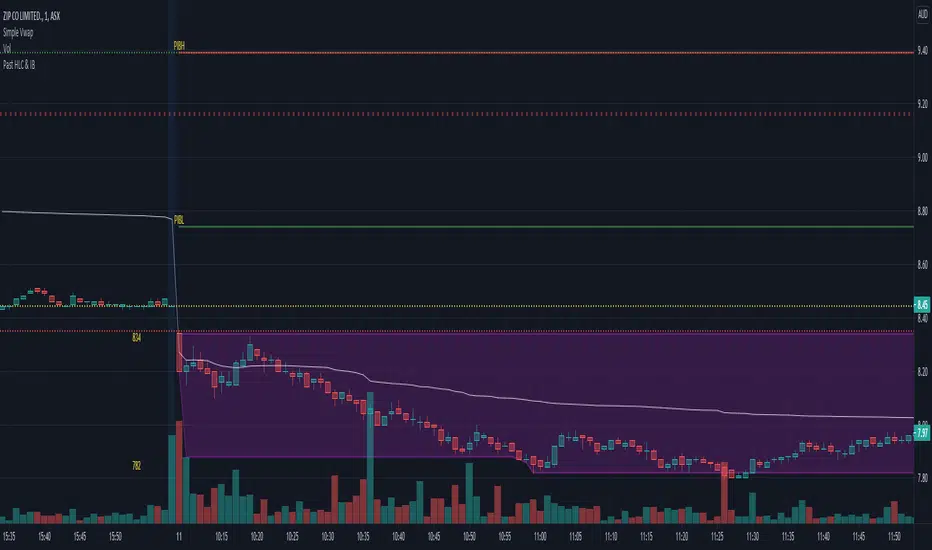
Initial Balance (IB) and Previous Day / Week High, Low & ClosePlots Historical key levels for volume profile idea.
Plots the following:
- Previous Day High
- Previous Day Low
- Previous Day Close
- Previous Day IB High
- Previous Day IB Low
- Current Days IB High
- Current Days IB Low
IB is based on first hour of trading.
Made specifically for ASX stocks, have not tested it on other exchanges or assets.
52 Week High/Low52 Week High / Low Indicator
A simple, unobtrusive indicator that can be used on any timeframe to display the 52 week high/low values.
Features
Works on any timeframe.
Unobtrusive: Simple horizontal lines showing only the current 52 week values.
Allows the user to select whether to calculate the 52-week values from candle close values or the respective highs/lows.
For full overview and code commentary - Visit the backtest-rookies website.

High Low ChannelBasic high and low channels, allows for two high and two low channels of specified lengths.
Use for channel breakout trades, basic idea is to go long when the longer high channel is broken and close when shorter low channel is broken, vice versa for shorts
Feel free to leave me a tip if you like this script: 1MprT7YEEWaM6bUcpD7eeHM3Ht8n3R5jP1

Futures Open/High/Low TablesAdds (up to) 3 tables to a chart, displaying Open/High/Low data for today (RTH and extended hours), yesterday, and the current week / month -- to help with intraday analysis of a futures ticker.
The tables only appear on intraday charts (5min, 30min, etc). On a Daily/Weekly/etc chart they are not calculated or shown.
In addition to Open/High/Low, the "Current" table in the top-right shows a live measurement of # of points from the open, the RTH open, and the highs/lows.
Lastly, the 9:30am ET open and the 4pm RTH close are by default marked with a shaded background (on intraday charts) for easy visual reference, and also to help with adjusting the session time to accommodate time zone issues if they occur.
Tested on ES in Eastern Time Zone, but should work on any futures instrument and any time zone by adjusting the Session Time setting.

52 Week High/Low Tracking TableThis Indicator helps the User to Quickly view Current Closing Price Compared to the Mentioned Period High and Low.
"Bars Back" indicate the period you need to look back. In case of Daily charts 260 Bars Back usually indicate 52 Weeks/1 year. This is set a default. But you can change it as well.
The Indicator will show the data for below:-
1) High - Highest Close price for the Mentioned Period
2) % from High - The Percentage difference between the Current Close Price Vs Highest Close price for the Mentioned Period. (-) indicate that the current close price is lesser then then High Price.
3) Low - Lowest Close price for the Mentioned Period
4) % from Low - The Percentage difference between the Current Close Price Vs Highest Close price for the Mentioned Period. (-) indicate that the current close price is lesser then then High Price.
You can add this indicator to Quickly Scan multiple stocks to see were they stand.

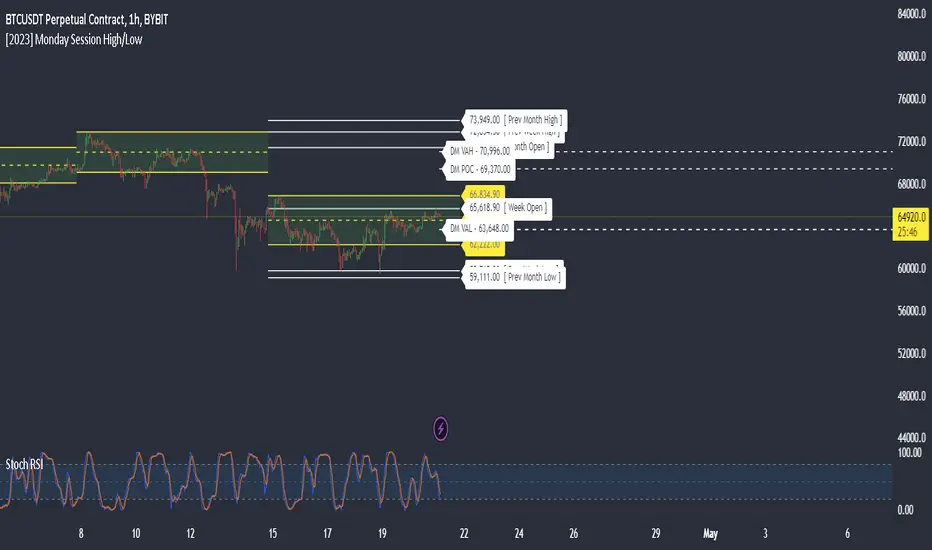
Monday Session High/LowThis script tracks and draw the High and the Low for Monday session across the whole week period.
Many crypto traders use the high and low extremes for Monday session as an confluence on how the price action during the week reacts against it.
Session High and Low IndicatorThis script is meant for stocks that have a pre-market session. It is meant to be used on the 1 min time frame. This script will draw a green line at the high of pre-market, and a red line at the low of pre-market and extend these lines across the regular session day
This makes it easy to see if price action during regular market has broken above pre-market high or broken below pre-market low.
The high/low skips any quick spikes in price action (similar to what happens at 8:30 am every day).

Net New Highs/Lows (With visible code)Basically the same script than Carusolnsights but without hidding the lines of code...
"This indicator displays the net number of stocks on the Nasdaq Composite making 52-week highs or lows. For instance, if there are 60 new 52-week highs and 20 new 52-week lows, the net number will display 40 net new 52 week highs. This indicator is particularty useful in gauging what the breadth is of the Nasdaq.
Three days of net 52-week highs show a healthy market which is conducive to increasing exposure. This condition is highlighted with a green background.
Three days of net 52-week lows show an unhealthy market which is conducive to reducing exposure. This condition is high|lighted with a red background."

[TTI] All-time-high (ATH), (ATL), 52 week high and low Dots––––History & Credit
I wanted to show our community the idea that stocks that make All Time High are likely to continue making ATHs for some time. It goes contrary to the idea "buy cheap sell high". Actually, in the real market leaders the stocks that make 100+% return are just getting started on returns to few THOUSAND percent. I have used code from QuantNovad scrip in this one too. So thanks to him as well, since it speeded writing it from scratch!
–––––What it does
The script paints dots and shows stats.
The dots are 4 types:
🟢 = Every time a new ATH is achieved, a green dot paints above the bar
🟣 = Every time a new 52week High is achieved, a purple dot paints above the bar
🟡 = Every time a new ATL is achieved, a yellow dot paints below the bar
🟠 = Every time a new 52week Low is achieved, a orange dot paints below the bar
Stats =
Show in a box in the bottom right corner of the screen. How many times has this stock achieved:
👉 ATHs
👉 52WK High
👉 ATLs
👉 52WK LOW
–––––How to use it
This is really an illustrative script to get the idea of the methodology "buy high sell higher', that we teach as momentum traders.
Some notable examples to check are:
HOOD
MSFT
TSLA
AAPL
See the stock dynamics and understand that bottom fishing doesn't result in stocks making massive moves.

High Low Open Mid Ranges & Levels (Multi-Timeframe)This indicator automatically plots the chosen timeframe's high, low, mid point and open. These levels on higher timeframes act as support and resistance levels on lower timeframes, helping find entries, stoploss and profit targets.
Most common timeframes to choose are Daily, 1W, 1M, and 3M. Other timeframes that are good include, 2D, 2W and 2M.
For example, you can see in the snapshot below, we are on the 4hr TF showing those levels from the 2W. This historical 2W zone (open and mid) was (and currently still is) resistance. You can see it also provided a good entry to go short.
This is also useful for intraday scalping. Below, we are on the 15min TF with levels set on the 2D timeframe. You can see how the Open and Mid levels acted as resistance, providing good entries on range trades, with take profit set at the previous 2D low.
There is also a table which tells you all the main TFs high, low, open, and mid levels. They are the most important ones to look out for.
This indicator should not be used in isolation; it is best to pair it up with other TA such as orderblocks, S/D zones, S&R or overlay indicators.

Fib High Low PointsThis is a simple indicator which plot high and lows based on Fibonacci sequence.
Best part of this indicator is it don't rewrite itself once it got plotted on the chart, which make it unique from other High low indicators.

Highs Lows and OpensThis script is an update to a lovely script by BURSATRENDBANDCHART
There original script gave Daily, Weekly and Monthly Highs but I loved the format
I required
Previous Days Highs and Lows
Previous Week High and Low
Previous Day Open
Previous Week Open
Hope this can be of use

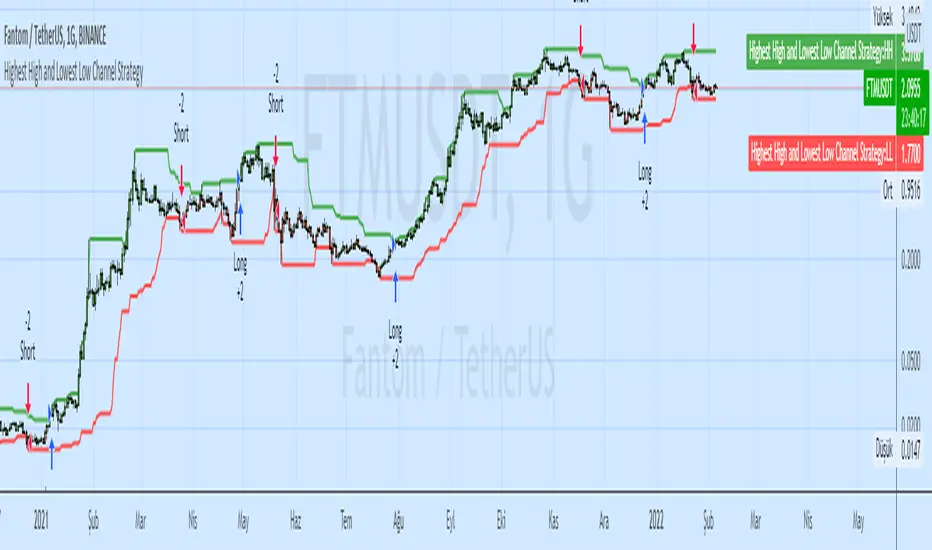
Highest High and Lowest Low Channel StrategyHighest / Highest High Highest (Data) - HHV (Data, Period)
Lowest / Lowest Low Lowest (Data) LLV (Data, Period)
These functions calculate the highest / lowest value of a selected data.
Highest High and Lowest Low options are mostly used.
The Highest function calculates the highest value of the selected data in the past.
The Lowest function calculates the lowest value of the selected data in the past.
Extension of High, Low and InbetweenThis script plots an extension my other script High, Low, Inbetween.
It sometimes makes it difficult to view the candles effectively so I've added this separately to my other script
It calculates the range between high/low and midpoint.
It then plots these lines as extensions from the high and low.
This is done twice.

High, Low and MidpointThis indicator plots the daily high and low from the previous day. (BLACK)
It then calculates the midpoint of the high and low and plots this. (RED)
This indicator can be used to identify daily ranges and to identify possible support and resistance levels.
