BTC Log High/Low ChartThis indicator calculates the logarithmic values of the high and low prices of BTC based on a mathematical formula and plots them on the chart. The code uses the current time and width of the chart to calculate the logarithmic values of the high and low prices. It defines functions to convert a timestamp to the number of days since January 1st, 2009.
You can use it with BTC Log High/Low:
"low" için komut dosyalarını ara

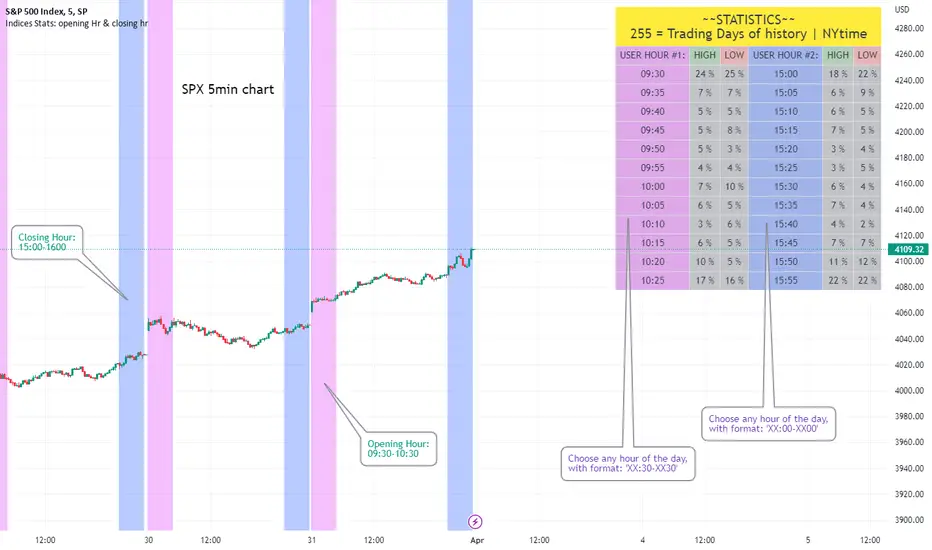
Opening Hour/Closing Hour Indices Statistics: high/low times; 5mVery specific indicator designed for 5min timeframe, to show the statistical timings of the highs and lows of Opening hour (9:30-10am) and Closing hour (3pm-4pm) NY time
~~Shown here on SPX 5min chart. Works all variants of the US indices. SPX and SPY typically show more days of history (non-extended session =>> more bars).
//Purpose:
-To get statistics on the timings of the high and low of the opening hour and the high & low of the closing hour.
//Design & Limitations:
- Designed for the 5minute chart ONLY . Need a sweet spot of 'bucket' size for the statistics: to allow meaningful comparison between times.
-Will also display on 1min chart but NOT the statistics panel, only the realtime data (today's opening hour/ closing hour timings).
-Can be slow to load depending on server load at the time. This is becasue of the multiple usage of looping array functions. Please be patient when loading or changing settings.
//User inputs:
-Standard formatting options: highlight color, table text color. Toggle on/off independently
-Decimal % percision (default = 0, i.e. 23%. If set to 1 => 22.8%)
-Show statistics: Show Opening hour statistics, Show Closing hour statistics
//Notes:
-Days of history shown at top of table; this is the size of the dataset. i.e. 254 here (254 trading days) =>> 254 opening hour highs, 254 closing hour lows etc.
--to illustrate with the above: 18% of those 254 closing hour highs occured on the 15:00 5min candle (i.e. between 15:00 and 15:05).
-SPY or SPX offer the largest history/dataset (circa 254 trading days).
-Note that the final timing in each hour is 10:25am and 15:55pm respectively: this is because the 10:25am 5min candle essentially ends at 10:30am =>> we properly captures the opening hour this way
-Pro+ users will get less data history than Premium users (half as much, due to 10k vs 20k bars history limit).
Typical Sweeps: Pivot high/low boxes. Grade sweeps, Handles/PipsTool to show typical pip-grade/ handle-grade sweep distance above pivot highs and pivot lows
-In consolidation/ranging periods (i.e. most of the time); Highs/Lows may by swept by fairly consistent distances in typical stop raids.
-Idea is from ICT teaching on typical Pip-grade sweeps in FX (10,20,30pips). Designed to work on FX, Indices, Commodities, Bitcoin.
-Above chart shows S&P; sweeping below and then above by 5 handles.
///inputs///
~choose sweep distance handles ($) or pips: will auto-calculate depending on the asset: FX= pips; Indices/stocks/commodities = handles ($)
--(2,5,10,20,30,50,100, 500, 1000)
~choose pivot lookback: larger number for more significant swing highs/lows
~choose number of historical boxes to display
~toggle on/off Pivot high boxes and Pivot low boxes independently
~extend boxes fully to the right (default is not extend)
~toggle on/off text
~text & box formatting options
Bitcoin, hourly chart; Pivot lookback = 15; $100 sweep boxes:
Eur/Usd; 15m chart; Pivot lookback = 30; 10pip sweep boxes; Boxes extended fully to the right:

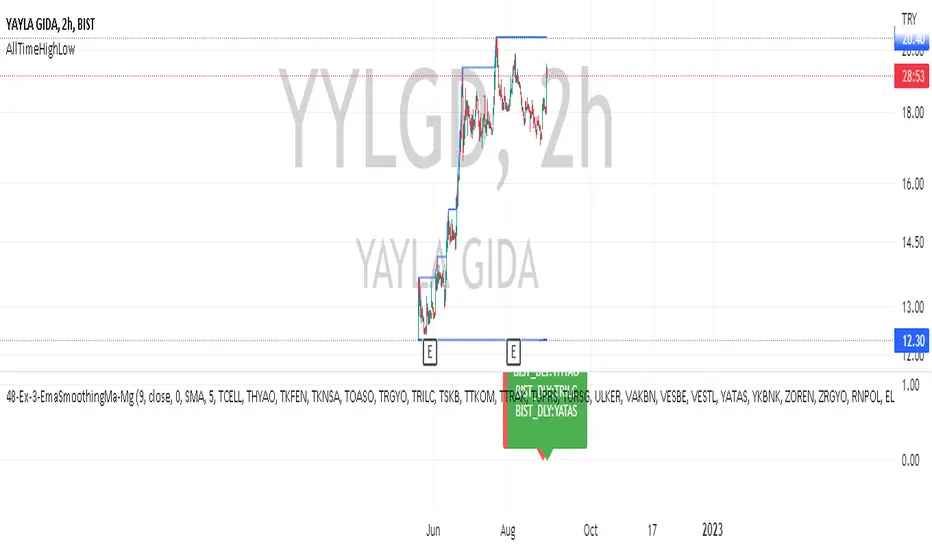
AllTimeHighLowLibrary "AllTimeHighLow"
Provides functions calculating the all-time high/low of values.
hi(val)
Calculates the all-time high of a series.
Parameters:
val : Series to use (`high` is used if no argument is supplied).
Returns: The all-time high for the series.
lo(val)
Calculates the all-time low of a series.
Parameters:
val : Series to use (`low` is used if no argument is supplied).
Returns: The all-time low for the series.
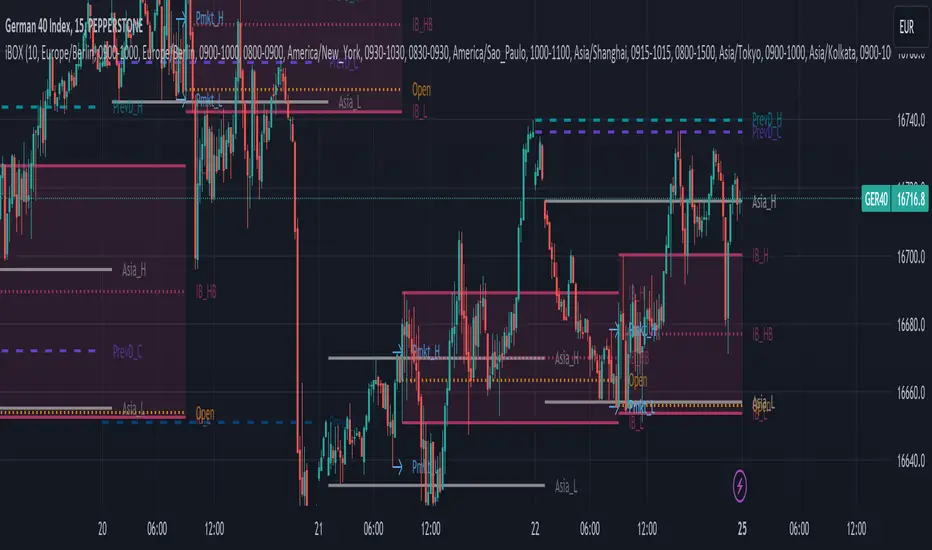
iBox, Initial Balance | IB High, Low, Midpoint | OpeningThis Indicator will print basically 4 lines.
You have to understand the importance of the "Initial Balance" the first trading hour of Cash session is very important in trading stocks and indizes.
So you will get 4 lines:
Opening
Initial Balance High
Initial Balance Low
Initial Balance Midpoint/Halfback
Most indicators for Range Box, Opening Trade, Opening Range, Initial Balance, iBOX and "Ultimate Lines" will only use the timezone of the exchange or your own timezone. I'm living in europe and we have this daylight saving time change in Summer/Winter - which will cause problems with most of the existing indicators or at least will push you to change the times regularly.
Another important point: I really like to switch the indizes when trading on my mobile. So what will happen when you set up opening range for DAX at 09:00 and then switch to S&P500? All indicators I tried failed here - they will just draw a wrong line for SPX, NDX, DJI, FTSE, ASX etc. I fixed that and hard coded stock exchanges and ticker symbols into 3 main groups Initial Balance EU/US/Asia
For example we take DAX - XETRA DAX is opening at 09:00 MEZ (Europe/Berlin)
The Initial Balance is set during the H1 Candle from 09:00 - 09:59
Please be aware, that some cash indizes only deliver data to TradingView after the "opening auction" - so for Xetra DAX you have to book live data and often you will only see data at 09:02/09:03 after the opening auction.
So you will get different opening lines compared from cash to future or your CFD provider. Future and CFD should fit for 99%
The Opening Line will be drawn at exactly 09:00
IB High on the highest price during the H1 candle
IB Low on the lowest price during the H1 candle
IB Halfback is simple: (IB High + IB Low) / 2
The lines will be drawn from cash start until next day and will end 2 minutes before the next cash session will start again. Please make your own experience! Activate the indicator for a CFD or Future switch to M15 and watch the wicks around the 4 lines. Even in the night or the next morning before the next Initial Balance will be set.
For me the lines are valid for around 24 hours and often longer. That's why it's good to have the old lines on the chart too.
To-do:
Yesterday high / low / close / halfback (also for last week and month)
Labels for the lines - sometimes only the colors will confuse you - a simple label should be a benefit (IB_h, IB_l, IB_1/2, 1D_o)
Range Lines for Asia Range and Premarket Range - additionaly a parameter to disable premarket lines when premarket is trading in asia range.
Add Alert condition to get alerts after IB is set
If you have and thoughts, ideas or improvements, please send me an message or leave an comment!
Like i said, the stock exchanges and ticker symbols are hard coded and can be extended for all relevant assets.
Have fun and i really hope this indicator will help improving your trading experience!
Pre Market \ Opening Range High LowGreen vertical lines are showing pre market open and then the opening range as the first hour of market NYSE market open
Pre market high and low are blue lines | intraday opening range high low are in white
Trades are taken in the current direction above | below range breaks with the direction of price action using the moving averages
Price breaking through moving averages and a range is the optimal trade to enter - exit at next range for target - stop loss below the lower | higher moving average depending on short or long
A break above or below the intraday high or low and pre market high or low can give massive profits trailing your stop loss as price runs
Using MA 5 and 12 to filter out entries and exits above or below the ranges short or long is also another strategy to implement
BEST TIME FRAME TO USE IS 5 MINUTE

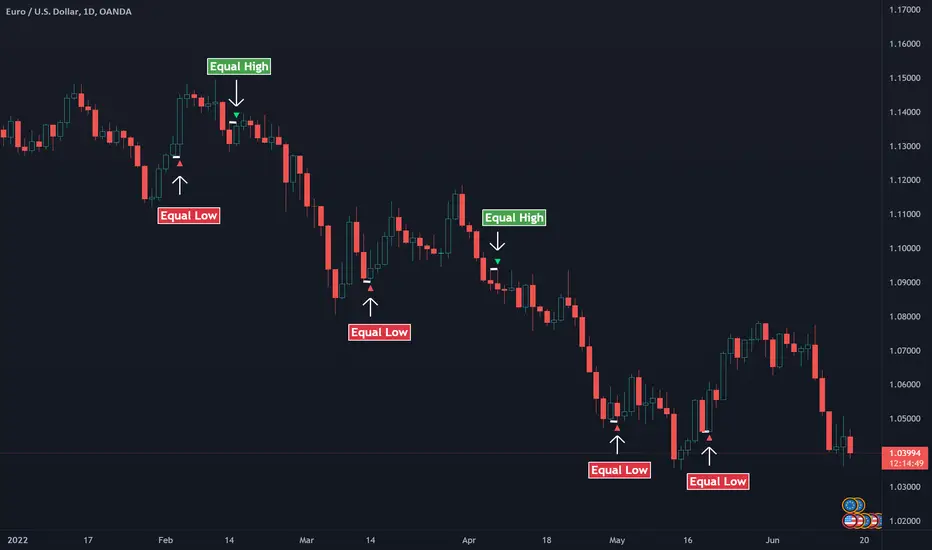
Equal Highs and Equal LowsA simple indicator that detects if two candles lows or highs are equal. The pattern simply indicates the possibility of a reversal. However, many traders also use the Equal highs/lows within a broader context of market analysis to provide insights for trend traders, especially to detect pullbacks.
Equal Highs/Lows are a pattern that can indicate a shift in a trend direction or to find pullbacks within an established trend. The idea behind the equal highs and lows is that the first candle shows a strong move in the current direction, and the second candle pauses the previous candlestick price action. It's a clear sign that the momentum is slowing down. This insight is valuable for traders and can detect a potential change in the trend direction.
Usage
Use the pattern to find reversals.
Use the pattern to find pullbacks.
Disclaimer: No financial advice, only for educational/entertainment purposes.
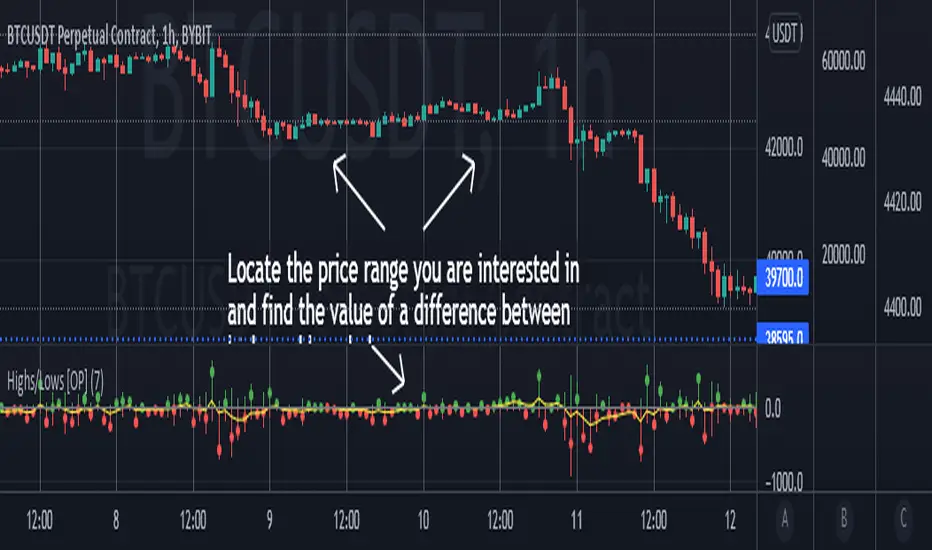
Highs/Lows difference [OrganicPunch]Highs/Lows difference indicator
To visually evaluate the difference between highs and lows of a price range.
This handsome indicator shows:
difference between highs of 2 candles by displaying it in green histogram
difference between lows of 2 candles by displaying it in red histogram
difference between both highs and lows by displaying a circle at the level of the difference
To read the numerical value, point at the circle of the relevant bar you are interested in, and see the scale.
Indicator is useful in creating strategies where you want to filter out consolidations/ranges (or to locate them), e.g. "Open trade when H/L difference is larger than 200", or "Look for candles with H/L difference lesser than 50".
The exact value of needed H/L difference can be found using this indicator.
HTF Liquidity Levels█ OVERVIEW
The indicator introduces a new representation of the previous days, weeks, and months highs & lows ( DWM HL ) with a focus on untapped levels.
█ CONCEPTS
Untapped Levels
It is popularly known that the liquidity is located behind swing points or beyond higher time frames highs/lows (in a sense, an intraday swing point is a day high/low). These key areas are said "liquid" because of the accumulation of resting orders, mainly in the form of stop-loss orders. And this more significantly on higher time frames which have more time for stacking orders. As the result, the indicator aims to keep track of untapped levels that have their liquidity states intact.
Liquidity Pools
Once a liquidity level identified, or better, a cluster of liquidity levels work as magnets for the market. The price is more likely to make its way towards heavier pockets of liquidity, by proximity (the closest liquidity pool), and by difficulty (path with less obstacles). This phenomenon is referred as liquidity run, raid, purge, grab, hunt, sweep, you name it. Consequently, the indicator can help you frame a directional bias during your trading session.
█ NOTES
Drawings
Once a level is tapped, it is highlighted. At the end of each day, all tapped levels are cleared.

HLC True Strength Indicator (with Vix)HLC True Strength Indicator Volume Weighted with Vix Line by SpreadEagle71
This indicator is a True Strength Indicator with Close, High and Low used together, along with the TSI of the Vix.
The white line is the close. The red line is the lows and the blue is the highs. These are also volume-weighted.
How to Interpret:
1. zero line crosses. If SPY/SPX500 crosses the zero line, then its bullish. If the purple Vix line crosses up, watch out because this is bearish.
2. white/blue/red lines cross purple (Vix). If they cross upwards, this is bullish. If downward, this is bearish. Basically, SPX, ES1!, SPY or even DIA can be used. The security and the Vix should travel in opposite directions and cross the zero-line at the same time. But this is not always the case.
3. Black area infills. These are used between the close and the highs (blue) and the lows(red). Close should not be between these in order to have momentum.
4. Close (white line) leads. Close is the last price so it tends to show where the others (highs and lows) are going. If the close is sagging below a high where the blue lines are on top, this could mean that there is a reversal coming. Same holds true for a white line above a "valley" formed by the blue and red lines; it could mean a reversal to the upside soon.
5. The Black Infill areas as a squeeze or contraction/expansion area. The thinner the black infill areas, the more of a momentum "squeeze" could be present. Wide black infill areas mean increased volatility and what may come next is a reversion to the mean for volatility. See TTM Squeeze Indicator or the Squeeze Momentum Indicator (kudos LazyBear).
Lastly, just remember indicators indicate; they are not magic. :)
SpreadEagle71

Intraday High/LowLibrary "IntradayHighLow"
Provides functions calculating the intraday high/low of values.
IntradayHigh(val) Calculates the intraday high of a series.
Parameters:
val : Series to use ('high' is used if no argument is supplied).
Returns: The intraday high for the series.
IntradayLow(val) Calculates the intraday low of a series.
Parameters:
val : Series to use ('low' is used if no argument is supplied).
Returns: The intraday low for the series.

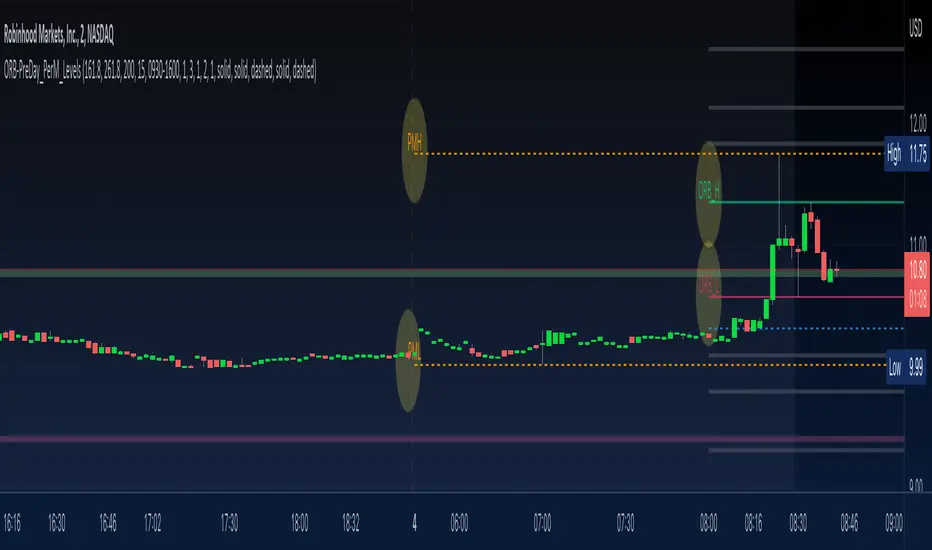
ORB-PreDay_PerM_LevelsThis script provides following levels:
1. ORB Level - You can adjust the timeframe of Opening Range (plots from 9am to 4pm)
2. ORB Fib Extension - 1.618 and 2.618 Fibonacci Extension of ORB High and Low (plots from 9am to 4pm)
3. Previous Day High/Low/Close - You can adjust color/thickness of the lines (plots from two days ago so that you can clearly see the levels)
4. Previous Two Days High/Low (plots from two days ago so that you can clearly see the levels)
5. Pre-Market High/Low (plots from 6:30am to 11am)
All in one indicator gives much better clarity of where current instrument is trading in relation to ORB, Previous Day Levels and Previous Two Days Levels along with Pre Market Levels.
You could combine these levels with your favorite EMA or EMA Cloud to create a trading system.
You could combine these levels with MA Cloud and ATR vs DTR script to gauge the move.
Look at the TWTR Chart today and see how these levels are respected.
High Low Index SPY Top 40Modification from original code for "High Low Index" by © LonesomeTheBlue
- Made modification specifically for Top 40 AMEX:SPY holdings
- Added Market sentiment histogram (Total count green vs red), and SMA line for it
- Added arrows for peaks and dips on High Low Index and Market Sentiment MA
Idea behind this indicator is that SPY should follow the overall sentiment of its top holdings. I believe this bring great value to SPY traders.
Enjoy~!

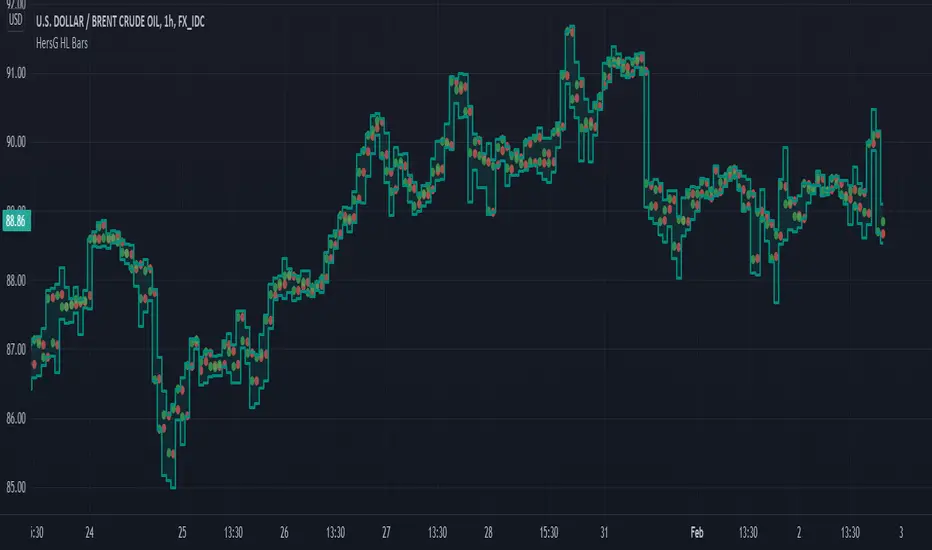
HersG High Low Bar Charts Layout
Hello friends,
The following indicator will create a new form of chart layout in High & Low as candle-like full bars instead of Open and Close. There are no wicks, only full bars highlighting High and Low of the select time frame. Two dots inside a bar will represent Open (Red dot) and Close (Green dot).
How can it help you as a trader?
High and Low candle-like bars will clear the noise from charts in identifying support & resistance, higher-highs and lower-lows will be clearly visible thus helping you make trades.
First add the indicator and then hover the mouse pointer over the ticker in the charts and click on the “eye-shaped” symbol to hide the candlesticks chart pattern.
The type of chart layout is standard charts. Data are not re-calculated or manipulated.
Regards!
count pivot high/lowthis script count pivot higher high and pivot lower low ...its useful understanding swing of market bull pressure and bear pressure ..
when price make swing high it count +1 ..this script can help in price action manual trading understading high and low also newbie pinescript coder to learn counter ..i learn these thing from al brook price action trading books .
to make this script i took pivot high and low inbuild script from Tradingview ...to code this idea one of good friend @fikira helped me ..
in v2 version i hope will able to count intraday piovt high and low ..

Swing Failure Pattern Inquisitor SFP Inquisitor
v0.2a
coded by Bogdan Vaida
Code for Swing High, Swing Low and Swing Failure Pattern.
Note that we're still in the alpha version, bugs may appear.
Note that the number you set in your Swing History variable
will also be the minimum delay you see until the apples appear.
This is because we're checking the forward "history" too.
The SFP will only check for these conditions:
- high above Swing History high and close below it
- low below Swing History high and close above it
In some cases you may see an apple before the SFP that "doesn't fit"
with the SFP conditions. That's because that apple was drawn later and
the SFP actually appeared because of the previous apple .
20 candles later.
Legend:
🍏 - swing high
🍎 - swing low
🧺 - candle where the last swing was driven from
🍌 - swing failure pattern
🍎🍌 - hungry scenario: swing low but also a SFP compared to the last swing

High_Low level plots for yesterday, pre market , regular, and AHthis study will plot yesterdays, high and low price, pre market's high and low price, regular day's high and low price and post markets high and low price.

TSI Strength Meter vs USD with divergenceThis indicator consists of two lines. One is a gray line (USD) and the asset indicator is green or red.
The basis of this indicator is the true strength indicator (TSI) with parameters 5,15. Both line sets are based on a TSI (5,15).
The lookback period is for new highs / new lows. Default value is 200 periods.
GREEN/RED LINE
The first that is green and red is whatever you choose to display ( BTC in this case).
The green and red lines indicate going up or going down.
GRAY LINE
The gray line is the US Dollar . So everything is relative to that by default.
ZERO LINE CROSSES
These are momentum shifts. If you see a crossover of both around the zero line, its a good indication there is a change in momentum and a reversal of trend.
NEW HIGHS NEW LOWS
There are 4 new colors added to this indicator. For the asset you are viewing, a lime color means new highs within the lookback period. A new low is indicated by a yellow line color.
The new lows for the USD are white for new lows within the lookback period and blue line for the new highs.
DIVERGENCE
You can also spot divergences easily. For example, if a lime color is seen on the indicator line, that means "new high" but if it occurs below the last "new high" it means the asset is going up to new highs but the indicator is showing us that the readings are below the previous new highs, indicating a negative divergence.
The same goes for the yellow colored lines. higher yellows mean positive divergence.
And with the US Dollar , blue lines dropping means a negative divergence in the US Dollar , while white lines moving up means a positive dollar divergence.
INTERPRETATION
Examples:
If you see a green and sometimes red line of the asset indicator and a gray line that drops below the zero line; it may mean the asset is rising and the trend is up.
If you see a green and red line below the zero line and with a gray line above the zero line , it indicates there is a negative trend. If you suddenly see blue lines on the USD, this means its hitting new lows. If these blue lines then start to slowly move downwards; then we have a positive divergence. If that were to be followed by the green line crossing the zero line, its a pretty good be that the trend is changing and its a very good buying oportunity.

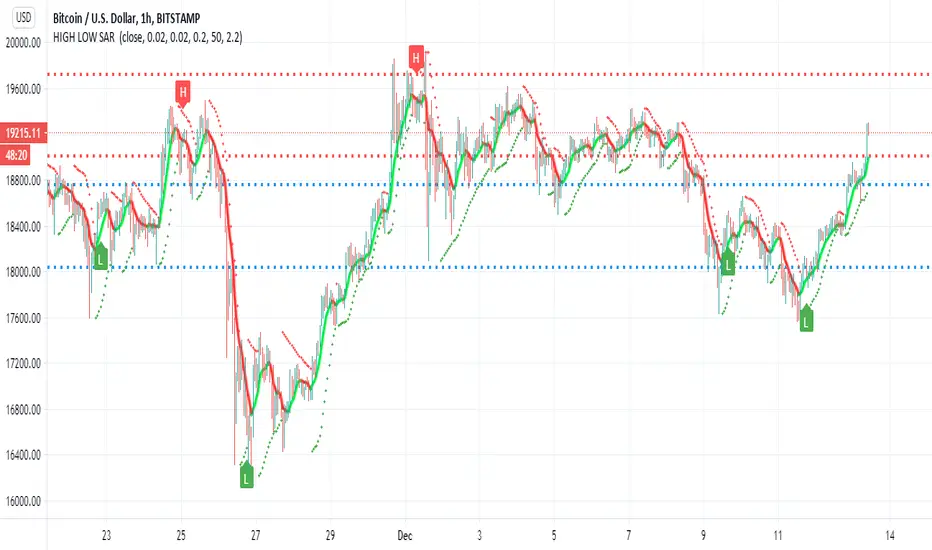
HIGH LOW SAR This script i try to detect high and low using SAR
the red and blue lines represent present and past support and resistance level
the trend line in lime and red is Hull
sar signals of high and low are done by cross of SAR and bollinger channel upper and lower and condition that it either below or above the resistance and support levels
there are alerts but i think as a bot it not so good , better to use this one as idea for possible high and low where the targets are shown by resistance and support level
this is just idea how to make the SAR to show us high and low , maybe with more refinement it would be better
High Low Yesterday & Last week & Last monthJapanese below. 日本語の説明は下記
This indicator shows high/low price of previous day(yesterday), last week and last month.
Yesterday’s high/low are shown on 4 hour or lower timeframe charts.
Last week’s high/low are shown on Daily or lower timeframe charts.
Last month’s high/low are shown on Weekly or lower timeframe charts.
Each price can be enabled/disabled to show at selection parameters.
——————————————————————————————
前日の高値・安値、先週の高値・安値、先月の高値・安値を表示するインジケーターです。
前日の高値・安値: 4時間足以下のタイムフレームで表示
先週の高値・安値: 日足以下のタイムフレームで表示
先月の高値・安値: 週足以下のタイムフレームで表示
それぞれの価格はインジケーターの設定画面で表示・非表示設定可能です。

High/low crypto strategy with MACD/PSAR/ATR/EWaveToday I am glad to bring you another great creation of mine, this time suited for crypto markets.
MARKET
Its a high and low strategy, designed for crypto markets( btcusd , btcusdt and so on), and suited for for higher time charts : like 1hour, 4hours, 1 day and so on.
Preferably to use 1h time charts.
COMPONENTS
Higher high and lower low between different candle points
MACD with simple moving average
PSAR for uptrend and downtrend
Trenddirection made of a modified moving average and ATR
And lastly elliot wave oscillator to have an even better precision for entries and exits.
ENTRY DESCRIPTION
For entries we have : when the first condition is meet(we have a succession on higher high or lower lows), then we check the macd histogram level, then we pair that with psar for the direction of the trend, then we check the trend direction based on atr levels with MA applied on it and lastly to confirm the direction we check the level of elliot wave oscillator. If they are all on the same page we have a short or a long entry.
STATS
Its a low win percentage , we usually have between 10-20% win rate, but at the same time we use a 1:30 risk reward ratio .
By this we achieve an avg profit factor between 1.5- 2.5 between different currencies.
RISK MANAGEMENT
In this example, the stop loss is 0.5% of the price fluctuation ( 10.000 -> 9950 our sl), and tp is 15% (10.000 - > 11500).
In this example also we use a 100.000 capital account, risking 5% on each trade, but since its underleveraged, we only use 5000 of that ammount on every trade. With leveraged it can be achieved better profits and of course at the same time we will encounter bigger losses.
The comission applied is 5$ and a slippage of 5 points aswell added.
For any questions or suggestions regarding the script , please let me know.

Swing Highs/Lows & Candle Patterns [LuxAlgo]This script labels swing highs and swing lows as well as the candle pattern that occurred at that precise point. The script can detect the following 6 candle patterns: hammer, inverse hammer, bullish engulfing, hanging man, shooting star, and bearish engulfing.
This indicator by its very nature backpaints by default, meaning that the displayed components are offset in the past.
🔶 USAGE
It can be interesting to see if a top or bottom is associated with a specific candle pattern, this allows us to study the potential of such a pattern to indicate a reversal. You can hover on a label with a specific pattern to see more details about it.
The notations HH, HL, LH, and LL you can see on the labels are defined as follows:
HH : Higher high
HL : Higher low
LH : Lower high
LL : Lower low
🔶 SETTING
Length: Sensitivity of the swing high/low detection, with lower values returning the maximum/minimum of shorter-term price variations.

Smart Indicator 28 - Swing Pivots (Higher Highs and Lower Lows)A simple way to find Higher Highs and Lower Lows (HH and LL) whit automatic Fibonacci Lines in the most common levels.
In this indicator the Higher Highs only happens when a high value are rising from each other in the last "Length of Real Pivots" highs and the next same number of highs are falling in every single bar.
The Lower Lows are inverted, LL only appears if a low is falling in every single bar in the last number of length and the lows price of the "n" bars next are rising.
You can use this Indicator in any kind of market.
