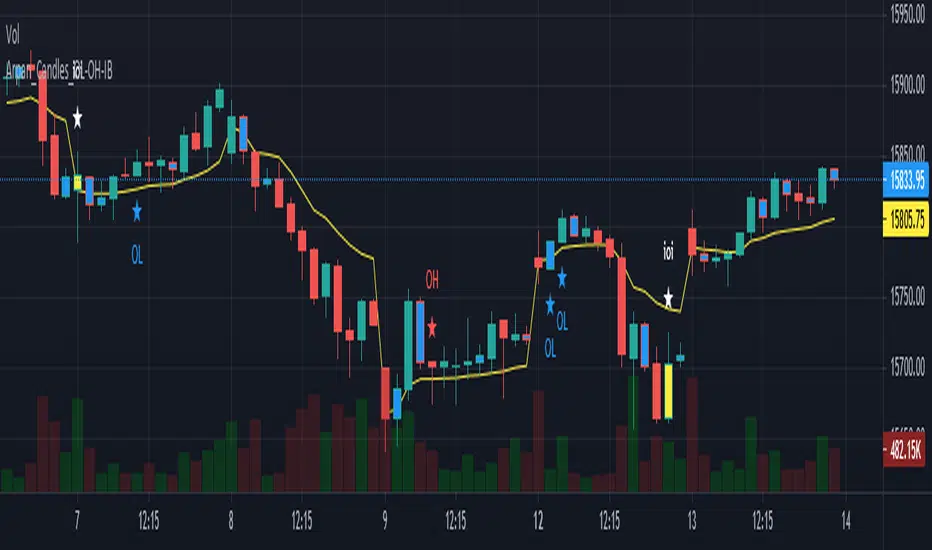
Arpan_Candles_OL-OH-IBThis script simply shows OL (Open=Low) , OH (Open=High) and IB (Inside Bar) . I personally use OL and OH to take quick scalping trades with very low risk.
OL candle indicates that candle's Open and Low prices are same and a Long trade can be taken with a stoploss below candle low.
OH candle indicates that candle's Open and High prices are same and a SHORT trade can be taken with a stoploss above candle high.
Candles with navy blue colour indicates an Inside Bar . An inside bar is a common pattern where the high and low of one candle occur inside the high and low of the prior candle. Inside bar shows a contraction in volatility and are often a continuation pattern. Previous candle (prior candle to inside bar) is known as "Mother candle" and trades can be taken on breakout from "Mother candle" , in the direction of breakout and keeping a stoploss below/above "Mother candle".
This script can be used in any time frame. Smaller time frames generate more signals compared to higher time frames.
"inside bar" için komut dosyalarını ara
Price In Motion – Inside Candle Breakout SystemPrice In Motion – Inside Candle Breakout System
Created for traders who want clean, structured inside-bar breakouts without clutter or unnecessary signals.
📌 What This Indicator Does
This tool identifies inside candles and plots simple breakout zones around them.
A breakout arrow only appears when price closes outside the zone, giving a clear, rules-based trigger.
You can choose between two inside-bar detection modes:
🔄 Two Inside-Candle Modes (Toggle)
1️⃣ Standard Mode (default)
Inside candle = current body is contained within the prior candle’s high–low range.
Wicks can be outside — only the body matters.
A clean way to spot compression and continuation setups.
2️⃣ Candle-to-Candle Mode (optional)
Inside candle = current body is fully within the prior candle’s body.
Produces tighter signals and more refined breakout zones.
🧱 Merged Inside Candle Zones
Back-to-back inside candles are automatically merged into one zone:
Zone High = highest high of the cluster
Zone Low = lowest low of the cluster
This keeps the chart clean and maintains a single breakout level until price closes outside of it.
📉📈 Breakout Signals
A breakout arrow prints only when price closes outside the zone:
Green arrow = close above the zone
Red arrow = close below the zone
Arrows can be toggled on/off at any time.
🎯 Why This Helps
Unlike typical inside-bar indicators that only mark the candle, this tool:
Shows clean compression zones
Merges clusters of inside candles
Confirms breakout only on candle close
Removes duplicate or noisy signals
Never repaints
It’s built for traders who value structure, clarity, and repeatable setups.
🛠 Best Used For
Breakout continuation
Pullback structure
Compression analysis
Scalping or intraday execution
Futures, stocks, crypto — any timeframe
Breakout Sideway Range [5ema]This indicator can find the breakout of sideway range. The range create by the bars inside the highest bar.
Compared to my previous script name Breaking Bar , this one is different in important point:
The Highest bar can be found at higher timeframe.
No have opening candles of each session.
-----
How to calculate?
Find the bar have full body or full bar is highest on number left bars.
The sideway range are bars inside highest bar.
Find the bar breakout highest bar are reversal candle patterns.
The highest bar can set up on higher timeframe.
-----
How to set up?
Change the input value of left bar to find the highest bar.
Change the input value of right bar to find the inside bar of highest.
Select the time frame to find the highest bar. Set "chart" if want to follow chart.
Select the way find highest bar, by price high and low or open and close.
-----
How to use?
Choose the signal buy or sell or all.
Change the color or range if want.
Hidden, display, change color background of signal bar.
Make the alert when signal appear.
Refer the signal appear on chart:
- Signal Sell:
- Signal Buy:
-----
This indicator is for reference only, you need your own method and strategy.
If you have any questions, please let me know in the comments.
WIB & 3WTCThis indicator plots the Weekly inside bar and 3 Weekly tight close.
i : Weekly inside bar
- : Weekly tight close
1. Weekly inside bar (WIB)
Which shows the price contraction where the current bar's range is lower than the previous bar's range
Conditions:
Current bar's low is higher than previous low and high less than the previous bar
Range of the current bar should be at least 30% less than the previous bar (Can be modified in the input settings)
Distance between Current bar's low and 50 D Simple Moving average should be at least less than 5% (Can be modified in the input settings)
sometimes low or high of current bar could be few points fluctuated from the previous so tolerance percentage has been set to 1 (Can be modified in the input settings)
Candle range should not be more than 10%. More the compression in the candle better it is for taking a position
Position:
Long could be initiate when the high of the current bar is broken
2. 3 Weeks Tight Close (3 WTC)
where the last three weeks close are within 1.5% range
Conditions:
Last three weeks close is with in 1.5% range (Can be modified in the input settings)
Position:
Long could be initiated current market price
Note: Below conditions apply for both the patterns
Close should be higher than Moving Average(40)
Volume should be less than Volume moving average(10)
Tip
Candle range is visible in the tooltip by hovering over the plots of WIB and WTC characters
Play with Indicator settings for the study purpose

Popgun Bar PatternI created this script to research the trading effectiveness of the Popgun Bar Pattern.
The Popgun Bar Pattern is found when 3 candlesticks in order form the following pattern:
0. Any bar that is then followed by:
1. An inside bar. This is a bar that is completely engulfed by the bar before it. It will have a lower high and a higher low than the previous bar.
2. An outside bar immediately after. This is a bar that completely engulfs the prior inside bar. It will have a higher high and a lower low than the previous bar.
Simply put, the Popgun Bar Pattern is an inside bar followed by an outside bar.
I would highly recommend incorporating this signal as a "trigger" for existing technical analysis. Used in isolation it may not have a high probability of success.
To make it more effective as a trigger to a trading signal I incorporated into my code an Entry, Stop, and a Target dot.
The Entry dot is offset from the low of a bearish Popgun Bar Pattern or the high of a bullish Popgun Bar Pattern by a factor of ATR. The default ATR percentage is 33% but can be adjusted.
The Stop dot is based on the recent highest high (bearish) or lowest low (bullish) of a set range (default is 9 bars) plus/minus the ATR percentage buffer.
The Target dot is automatically calculated from the entry based on a configurable reward factor (default is 3) from the entry to stop distance. This projects a potential 3:1 reward/risk trade by default.
There is an additional alert condition which can be configured at the end of the script.

VWAP MA HLOC securities Jayy update fix This version replaces previous versions that stopped functioning as a result of a TradingView script update.
This script complies with the current script syntax.
for intraday securities default is 9:30 am to 4 pm Eastern Other session choices are provided in the format dialogue box.
script plots VWAP, yesterday's high, low, open and close (HLOC), the day befores HLOC - if desired, today's open and todays high and low.
Also signals inside bars (high is less than or equal to the previous
bar's high and the low is greater than or equal to
the previous low) the : true inside bars have a maroon triangle below the bar as well as a ">" above the bar.
If subsequent bars are inside the last bar before the last true inside bar they also are marked with an ">"
Also plots the 20 ema for different time periods (as per Al Brooks), If you trade the 5 min then you will
likely be interested in the 20 ema for 15 mins and 60 mins
the following is a list of the higher timeframe 20 emas
1 minute 5, 15, 60 period 20 ema
5 minute 15, 60 period 20 ema
15 minute 60, 120 , 240 period 20 ema
60 minute 120, 240 period 20 ema
120 minute 240, D period 20 ema
240 minute D period 20 ema
Jayy
VWAP forex Yesterday Hi/Low switchThis script plots VWAP, yesterday's high, low, open and close (HLOC), the day before's HLOC -
Also plots higher timeframe 20 emas including:
1 minute 5, 15, 60 period 20 ema
5 minute 15, 60 period 20 ema
15 minute 60, 120 , 240 period 20 ema
60 minute 120, 240 period 20 ema
120 minute 240, D period 20 ema
240 minute D period 20 ema
Also signals inside bars (high is less than or equal to the previous
bar's high and the low is greater than or equal to the previous low) the : true inside bars have a maroon triangle below the bar as well as a ">" above the bar.
If subsequent bars are inside the last bar before the last true inside bar they also are marked with an ">"
If you have suggestions let me know.
Jayy

VWAP MA HLOC JAyy
For intraday 9:30 to 4 pm Eastern plots VWAP, yesterday's high, low, open and close (HLOC), the day before HLOC - if desired, today's open and today's high and low.
Also signals inside bars (high is less than or equal to the previous bar's high and the low is greater than or equal to
the previous low) the : true inside bars have a maroon triangle below the bar as well as a ">" above the bar.
If subsequent bars are inside the last bar before the last true inside bar they also are marked with an ">"
Also plots the 20 ema for different periods, If you trade the 5 min then you will likely be interested in the 20 ema for 15 mins and 60 mins

Double Inside Body Candles with Box & Alert + 5-Bar LinesThis indicator identifies Double Inside Body Candle patterns, where:
Candle 1 is completely inside Candle 2,
Candle 2 is completely inside Candle 3 (the parent candle),
Candle 3 has a real body (not a doji or negligible body size).
Once the pattern is detected:
A label appears below the current candle.
A highlight box is drawn around Candle 3 (the parent candle) body range.
Horizontal lines are drawn from the top and bottom of Candle 3’s body and extend forward for exactly 5 bars to visualize potential breakout levels.
The script also detects and highlights breakouts:
🔼 Bullish breakout: if price closes above Candle 3's body high.
🔽 Bearish breakout: if price closes below Candle 3's body low.
Alerts are available for:
Double Inside Body pattern detection
Bullish breakout
Bearish breakout
Traders can use this script to identify consolidation periods (double inside bars), then monitor for breakout opportunities in either direction, using the 5-bar lines as short-term breakout levels.

Gann Swing PointsIndicator Logic
This is a GANN-style swing indicator that classifies bars based on their high/low structure relative to the previous bar.
I strongly encourage you to replay bars on Tradingview using this indicator to get a sense of how it creates pivot (or swing) points
Bar Classification:
Up-Bar (direction: 'up'): Higher High and Higher Low (HH/HL)
Down-Bar (direction: 'down'): Lower High and Lower Low (LH/LL)
Outside-Bar (generates 2 directions):
Green: 'down' then 'up'
Red: 'up' then 'down'
Inside-Bar: No direction generated (HL/LH)
Swing Line Logic
The swing line continues in the current direction until n opposite directions are detected.
n is the "n-direction" parameter (commonly set to 2, so 2 consecutive opposite direction is needed to turn the swing)
When n opposing directions occur, the swing turns, creating a pivot point
Inside bar is ignored, so e.g up-bar -> inside-bar -> up-bar generates "up", "up" direction
A top pivot is formed when the swing turns down
A bottom pivot is formed when it turns up
Note: This swing logic is inherently lagging — it only confirms tops/bottoms after the fact
This swing structure gives the system a clear and noise-resistant way to identify pivot points (swing-points)

Holy-Cow IndicatorHoly-Cow Indicator
Advanced Multi-Pattern Candlestick Analyzer (HC, NV, RN)
Description
Overview
This indicator is designed to detect key candlestick patterns based on foundational principles of price action analysis, now presented with a modernized approach for easier recognition and enhanced utility. Drawing inspiration from the work of candlestick charting pioneer Steve Nison (Japanese Candlestick Charting Techniques) and advanced price action strategies popularized by Linda Raschke (Street Smarts), this tool identifies and highlights unique combinations such as the Holy-Cow (HC), Nova (NV), and Red-Nova (RN) patterns.
These patterns simplify the complexities of price action into actionable setups, making them suitable for all types of traders.
Features
Inside Bars (IB):
Marks consolidation zones where the current candle’s range is inside the previous candle’s range. Useful for spotting breakout opportunities.
Outside Bars (OB):
Identifies candles where the current range exceeds the previous candle’s range.
Indicates potential reversals or trap setups.
Holy-Cow Pattern (HC):
Inspired by: Trap + Consolidation Setup
An Outside Bar followed by an Inside Bar.
Highlights volatility followed by tight consolidation, often preceding a breakout.
Nova Pattern (NV):
Inspired by: Breakout Trap + Expansion
An Inside Bar followed by an Outside Bar.
Signals breakout traps and subsequent volatility, useful for reversals or momentum moves.
Red-Nova Pattern (RN):
Inspired by: Volatility Trap + Major Breakout Zone
A combination of Holy-Cow (HC) and Nova (NV) patterns.
Represents a highly compressed market state, often leading to significant, high-intensity moves.
Bollinger Bands Integration:
Provides context on volatility and potential overbought/oversold levels.
Customizable Visibility:
Toggle specific patterns (IB, OB, HC, NV, RN) to suit your trading strategy.
How to Use
Pattern Detection:
Enable the patterns you want to focus on through the settings panel (e.g., HC for breakout setups, RN for high-intensity moves).
Observe highlighted zones and labels for actionable trade setups.
Trading Strategies:
Breakout Trades:
Look for HC, NV, or RN patterns near support/resistance and trade in the breakout direction.
Reversal Trades:
Use NV or RN patterns forming near key levels to catch reversals.
Stop-Loss:
Place below/above the low/high of the identified pattern.
Take Profit:
Use support/resistance levels, Fibonacci extensions, or a predefined risk-reward ratio (e.g., 2:1).
Recommended Timeframes:
1–15 minutes: Scalping or intraday trading.
1-hour: Intraday and swing trading.
Daily/Weekly: Ideal for significant trend analysis and major market moves.
Acknowledgments
This indicator is based on well-established trading principles and enhanced with unique combinations for modern trading. The foundational ideas behind these patterns are drawn from:
Steve Nison: Who introduced candlestick charting to Western traders in his seminal work, Japanese Candlestick Charting Techniques, and popularized concepts such as Inside and Outside Bars.
Linda Raschke: Who furthered the application of price action patterns in her book Street Smarts, showcasing multi-bar setups and momentum strategies.
While the patterns Holy-Cow (HC), Nova (NV), and Red-Nova (RN) are unique to this indicator, they build upon these foundational principles to offer traders actionable insights.
Disclaimer
This indicator is an independent creation inspired by publicly available price action principles. It is not affiliated with any proprietary tool or service. Back testing and proper risk management are strongly advised before live trading.

Inside Candle and mother candle range with alert++>>This script allows you the inside bar candle and the cnadle is shown in white.
The range of the mother candle is identified and tracked until it breaks.
Once the first range is over ridden then the next similar pattern will be occured and the tracking will be done for the mother candle latest occurrence.
It also has the alert mechanism where you can go and the alert for the indicator in Alerts.
5 min is the most preferrable time frame and while saving the alert Note to save the time frame of the chart. For which ever time frame is saved the Alert will be triggered for the same .
And when th inside bar is triggered it throws an alert condition. this alert condition has to be configured in your alerts and will be buzzing on the screen.
Oct 20
Release Notes: updated with Mother candle top and bottom lines of previous occurrences and tracks the current latest Inside bar mother candle
Release Notes: this script allows you the inside bar cnadle and the cnadle is shown in white. highlighter is configurable and line colors as well.

4C Inside/Outside BarThis indicator colors the candle body based on whether it closed as an Inside Bar (IB) or an Outside Bar (OB).
Inside and outside bars can be powerful triggers to enter or exit trades from, when price breaks above or below the candle.
The coloring of only the body and not the border of the candle makes it possible to still know whether the candle was bullish/bearish.
This indicator has the unique ability to add/hide labels for each IB and OB.
Small labels are printed on the chart directly below the candle. (See below)
It also has the unique ability to paint the chart background when an IB forms directly after an OB.
This is a special combination of the two, and can also be a powerful signal.
This feature can be turned on/off. (See below)
Thanks to Craig Stine, as some parts of this indicator were adapted from Custom Candle color Inside/Outside candles, Highwave, Star Patt. by Craig_Stine
The Strat - Levels [rdjxyz]◆ OVERVIEW
The Strat - Levels dynamically displays key levels used in The Strat trading methodology, developed by Rob Smith. The level colors are dynamically determined by their Strat classification (1, 2 up, failed 2 up, 2 down, failed 2 down, 3)—making it easy to recognize higher timeframe Strat candle classifications from any lower timeframe.
◆ DETAILS
If you're unfamiliar with The Strat, there are 3 universal scenarios regarding candle behavior:
SCENARIO ONE
The 1 Bar - Inside Bar: A candle that doesn't take out the highs or the lows of the previous candle; aka consolidation.
SCENARIO TWO
The 2 Bar - Directional Bar: A candle that takes out one side of the previous candle; aka trending (or at least attempting to trend).
These can be broken down even further as follows:
2 Up: A candle that takes out the high of the previous candle and closes bullish
Failed 2 Up: A candle that takes out the high of the previous candle and closes bearish
2 Down: A candle that takes out the low of the previous candle and closes bearish
Failed 2 Down: A candle that takes out the low of the previous candle and closes bullish
SCENARIO THREE
The 3 Bar - Outside Bar: A candle that takes out both sides of the previous candle; aka broadening formation.
◇ HOW THE DYNAMIC LEVEL COLORING WORKS
PREVIOUS LEVELS
Previous Day High/Low
Previous Week High/Low
Previous Month High/Low
Previous Quarter High/Low
Previous Year High/Low
Each period's levels are compared to their previous period's levels and colored according to the 3 universal scenarios, which are fixed based on historical data. (No repainting)
CURRENT LEVELS
Current Day Open
Current Week Open
Current Month Open
Current Quarter Open
Current Year Open
Each current period's levels (high, low, and current price) are compared to the previous period's levels and current period's open on every tick—changing colors in real-time as their Strat classification changes. (Will repaint as price action evolves)
E.g. When a new day opens inside of the previous day's range (high/low) the Day Open line will be gray (default for inside bars). When the current day trades above the previous day's range, the Day Open line will become aqua (default for 2 up). If price trades back below the current day's open, the Day Open line will become fuchsia (default for failed 2 up). And if price trades below the previous day's range, the Day Open line will become dark purple (default for 3s).
◆ SETTINGS
Current Day Open
Previous Day High/Low
Current Week Open
Previous Week High/Low
Current Month Open
Previous Month High/Low
Current Quarter Open
Previous Quarter High/Low
Current Year Open
Previous Year High/Low
Strat Colors
Each Current Level Open has 4 inputs:
Show/Hide Checkbox
Line Style
Line Width
Label Offset (Integer)
Each Previous Level High/Low has 5 inputs:
Show/Hide High Checkbox
Show/Hide Low Checkbox
Line Style
Line Width
Label Offset (Integer)
And each Strat scenario can be custom colored:
1-Bar Color - Default Gray
2-Up Color - Default Aqua
Failed 2-Up Color - Default Fuchsia
2-Down Color - Default White
Failed 2-Down Color - Default Teal
3-Bar Color - Default Dark Purple
◆ USAGE
There are 3 ways to look at these levels:
Potential continuation (e.g. Previous Day's 2-Up High being broken by Current Day's Price)
Potential reversal (e.g. Previous Day's 2-Down High being broken by Current Day's Price)
Potential exhaustion risk (e.g. Previous Month's Low is broken by Current Day's Price but trades back up into the Previous Month's range)
It's best to use this indicator with a separate indicator that color codes your chart's candles according to their Strat Scenario (1, 2, 3) and use top-down analysis to gauge whether to view levels as a sign of continuation, reversal, or exhaustion risk.
◆ WRAP UP
As demonstrated, The Strat - Levels offers Strat Scenario color-coded key levels, making it easy to identify the previous period's Strat Scenario (1, 2-Up, Failed 2-Up, 2-Down, Failed 2-Down, or 3) without needing to manually plot levels or refer to higher timeframes.
◆ DISCLAIMER
This indicator is a tool for visual analysis and is intended to assist traders who follow The Strat methodology. As with any trading methodology, there's no guarantee of profits; trading involves a high degree of risk and you could lose all of your invested capital. Use of this indicator is not indicative of future results and does not constitute and should not be construed as investment advice. All trading decisions and investments made by you are at your own discretion and risk. Under no circumstances shall the author be liable for any direct, indirect, or incidental damages. You should only risk capital you can afford to lose.
Market Structure (Range) & Internal Liquidity
This indicator will simplify the price-action reading of any trader/investor by decluttering his/her charts from un-important & confusing candles to highlight the true momentum candles which are usually formed by institutional buying/selling .
The indicator will be a good tool in the arsenal of the following styles of Trading/Investing
Smart Money / Liquidity Concepts
Price Action Concepts
Demand & Supply Concepts
Support & Resistance Concepts
UNIQUE FEATURES:
1. Market Structure - Range & Internal Liquidity:
Unlike other liquidity indicators, this indicator only highlights liquidity levels of significant importance. Not every intermediate high & low in a chart are worthy of noticing, hence by enabling the 'Swings' & 'Range (BoS)' feature in the indicator settings, the structure highs and lows (external liquidity) in a chart can be identified.
Any other liquidity levels within a market range (Range between structural High & Low) is known as internal liquidity which price targets to collect enough orders before heading towards the external liquidity levels.
2. Gaps (Fair Value Gaps / Imbalance):
Not every imbalance / gap between candles are important & trade-worthy. This feature of the indicator is different from the other widely available imbalance indicators & only highlights gaps formed by true momentum candles. Gaps between unimportant inside bars are not highlighted, as these bars occur in the absence of momentum.
3. True Price Action:
Looking at the two charts below, we can clearly observe the difference between price action of a confusing normal chart & the simplified price action highlighted by the indicator. This feature declutters the charts by only highlighting the candles a trader / investor should notice in a chart.
This feature when used in confluence with the liquidity levels feature & gap feature of the indicator, helps identify the true demand & supply zones (order blocks) in a chart.
Before
After
4. Zig Zag Lines:
This unique feature which is useful to Identify & Backtest different entry types taught by Smart Money Traders . This feature helps the trader understand the True Fractal Nature of price. This can also be seen as an alternate to the default line chart feature.
Examples of Entry Types taken by Smart Money Traders
ADDITIONAL FEATURES:
(These features are essential addons to trade liquidity. However, these are derived from publicly available indicators from the Tradingview library, but with a different interpretation for a better visualization of charts & or to time better trade entries without cluttering the charts)
a. Inside Bar & Outside Bars:
Identify not just a single Inside Bar as highlighted by other indicators, but to highlight a series of candles which are within a master candle range and are exhibiting unimportant sideways price action.
Outside Bars only relevant to momentum candles are highlighted, ignoring candles that occur within a master candle range. Highs & Lows of such Outside Bars are used by aggressive traders to identify liquidity levels in the charts.
b. Highs & Lows of previous Monthly / Weekly / Daily & Hourly Candles:
This feature draws Highs & Lows of previous Monthly / Weekly / Daily & Hourly Candles on the extreme right hand side of the chart to keep the charts clean.
Additionally for Hourly time frame, the indicator includes a setting to select the hourly candle time frame (60 min / 75 min / 240 min), which are personal and different for each trader.
UNDERLYING CONCEPT:
In the image below we see how a large majority of Traders / Investors incorrectly mark Structure markings, mistaking a raid of internal liquidity as a Break of Structure, thereby taking trades opposite to the broader trend of the markets
However, this indicator has a higher accuracy of identifying the correct price structure by only marking a structure high or low, when a subsequently opposite side liquidity is taken/raided. Further the broader trend of the markets can be easily identified by looking as to which side the Break of Structure has happened. (This is visible in the indicator in the form of 'Range' feature, so if a Range High is broken then it is understood to be in an uptrend & vice versa)
The underlying core functionality of the indicator is best displayed by the image below
USECASE OF THE INDICATOR:
Before taking any Buying/Selling position in the markets, a Trader / Investor must analyze the price action on the following parameters
HTF & LTF Trend Identification (To judge if trade is Pro-Trend or Counter-Trend)
Is Price at a High Probability Area of Interest?
Is Price satisfying the trade entry conditions?
Let us see how this indicator can be used as a complete trading system in itself and addresses each of the above parameters
Disclaimer: Illustrations shown below are just for understanding the features of the indicator & does not guarantee profitability. Every trader must back test their setups to arrive at a setup with an edge (positive expectancy) before they start actively trading the setup.
1. HTF & LTF Trend Identification (Pro-Trend / Counter-Trend) using 'Range (BoS)' feature of the indicator
Let's assume a Day Trader, uses hourly chart (75 min) to frame his Higher Time Frame (HTF) ideas & 15min charts (LTF) for trade entries
Looking at the chart below the Trader concludes that the HTF has most recently broken the structure to the downside and is considered Bearish till price action is below the range high of 48600 levels. It can also be concluded that the price is currently in a Bullish retracement.
The Trader can choose to take both Pro-Trend or Counter-Trend Trades, timing the trade entries using the LTF charts.
Looking at the LTF chart below, it is evident that price on LTF has also broken structure to the downside and is now aligned with the HTF Bearish Trend. The Trader will now look to get into short trades, to take trades both in line with HTF & LTF trend.
2. Let's identify if Price is at a High Probability Area of Interest, using either single or combination of the 'Swings' / 'Gaps' / 'Outside Bars' / 'HL of previous M,W,D, H candles' features of the indicator
Definition of High Probability Level / Area differs from each Traders perspective depending upon which of the Trading Styles (mentioned in the beginning) does one use.
Smart Money Traders
SMC Traders are known to get into trades early and their high R:R trades are taken mostly at a High Probability Area of Interest which are identified by them on HTF, by looking for candles with imbalance (gaps) & or candles which have taken out a previous liquidity and then having creating imbalance (gaps).
Also Turtle Soups is one of the favorite setups for SMC traders, where a trader enters a trade on LTF (typically 1 min/3min & 5min) after grabbing HTF liquidity lying at H/L of outside bar / previous monthly, weekly, daily or hourly candles.
Demand & Supply Traders
Some of the Best Demand & Supply Traders have the patience to wait for trades and take trades at the extreme Demand & Supply Zones within a market Range.
As illustrated below, the extreme hourly supply zone just below the structure high, which has the confluence of imbalance and Bearish HTF confirmation resulted in a good R:R trade.
Price Action Traders & Support & Resistance Traders
From the illustration below we can see how the 15 min Range breakdown confirms the breakdown of the Inverted Cup Pattern for Price Action Traders & Support & Resistance Traders using the same area of breakdown as the new Resistance to enter Short trades
3. Let's identify if Price is satisfying the Trade Entry Conditions using the 'Zig-Zag Lines' feature
Statistics say that majority (> 80%) of Traders blow up their accounts multiple times or completely give up and never achieve profitability.
One of the primary reasons for this is Traders punching trades randomly and without having proper Setup or rules for entering Trades.
Also in order to arrive at rules or execute the different entry models (couple of examples highlighted earlier) taught by different Trainers, a Trader needs to learn to visualize charts in a similar format to what the trainers are teaching.
The Zig-Zag lines feature is a form of line chart that joins the swing high points to the swing low points on the chart to represent the True Price action & a proper fractal nature of the markets, unlike the line chart which is formed by only by joining the closing value of each candle.
From the image below we can see that the Zig-Zag lines feature eliminates the randomness visible in the line chart and is a more smoother chart. Using this feature one can back test the various entry models widely available on the internet or arrive at a user specific model which he/she is comfortable with.
CONCLUSION:
Trading with a deeper understanding of Price Action allows a Trader/Investor to enter or exit trades with ease. Price Action trading allows individuals to keep their charts clean and stay away from the other lagging technical indicators and enter trades much earlier than other technical indicators.
This indicator attempts in simplifying the understanding of price action for every one and identify potential high probability areas / levels where one should enter / exit trades.
This indicator will be an important tool in the arsenal of any Trader / Investor to take better informed trades, however it does not guarantee profitability of a Trader, due to the randomness of the markets & external factors that influence each trader.
GET ACCESS:
Refer Author's instructions below to get access to the indicator

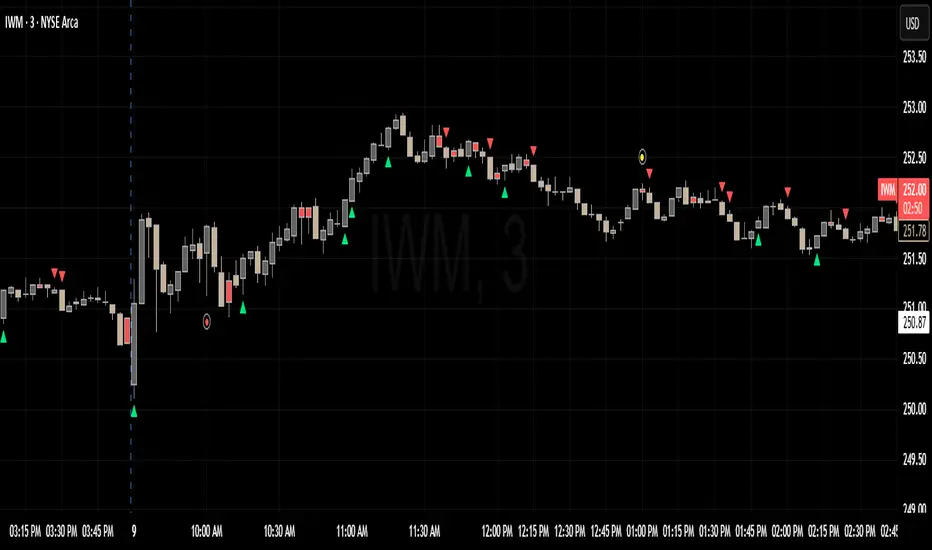
Breakout mode patterns [yohtza]This indicator detects three kinds of price action patterns:
ii - consecutive inside bars ( high and low inside of the previous bar), triangle on a lower timeframe
oo - consecutive outside bars ( high above the high of the previous bar and the low below the low of the previous bar), expanding triangle on a lower timeframe
ioi - inside outside inside, diamond pattern on a lower timeframe
Traders that trade these patterns are entering on breakouts above/below .When they appear in a trending market, they are good setups for both continuation and reversal swing trades. When they appear in ranging market, they are not nearly as powerful since most breakouts fail in this context. To achieve the highest probability, it is best to trade in the direction of the trend on the last bar in the pattern with a stop loss on the other side and going for a reward that is at least twice the risk.

AS - Tightness4% up - stocks up 4% and close is in top 75% of days range
4.5% up - stocks up 4.5% and close is not in top 75% of days range
4% down - stocks down 4%
TB D - Inside Bar with days range of less than 2.5%
IB D - Inside Bar Daily
Rev D - lowest in 5 days and close in top 60% of days range
TB W - Inside Bar with weekly range of less than 6%
IB W - Inside Bar Weekly
3WTC - 3 Week Tight Close
showlast - no. of bars you want to see 4% up move and 4% down move
showlastib - no. of bars you want to see IB in Daily and Weekly
Racktor Analysis Assistant
Racktor Analysis Assistant — Feature Overview
The Racktor Analysis Assistant is a multi-module market-structure toolkit that plots pivots, BoS/ChoCh levels, session breakouts, inside bars, and higher-timeframe BTS/STB trap signals — with complete styling controls and alerting.
Smart Pivot Engine (ZigZag Core)
- Adaptive pivot period switching based on timeframe threshold.
- ZigZag stream tracks pivot types (H/L, HH/HL/LH/LL) with Major & Minor streams.
- Clean visuals: optional ZigZag line & pivot labels with customizable style, width, and color.
Major & Minor Structure Signals
- Detects BoS and ChoCh for both Major and Minor swings.
- Updates External Trend on Major events and Internal Trend on Minor events.
- One-time triggers per level via locking.
- Per-category styling for Major/Minor Bullish & Bearish BoS and ChoCh.
- Alerts with symbol, pivot, timeframe, and time, limited to specific timeframes if desired.
Inside Bar Module
- Toggleable Inside Bar detection.
- Custom colors for bullish and bearish inside bars.
- Optional alerts on detection.
Session Breakout Suite
- Custom session window with shaded box.
- On session close, plots High/Mid/Low breakout lines extendable for N hours.
- Optional previous day & week high/low lines.
- Breakout vs Liquidity Sweep modes (close-based or wick-based confirmation).
- Display styles: Fixed (triangles) or Moving (vertical dotted lines).
- Alerts for “first event” or “every event.”
BTS/STB Trap (Higher-Timeframe ID1/ID2 Logic)
- BTS/STB toggle with selectable check timeframe (default: 4H).
- STB (bullish, Sell→Buy): strict ID1/ID2 relationships, both candles bullish; green circle below HTF ID1 low.
- BTS (bearish, Buy→Sell): strict ID1/ID2 relationships, both candles bearish; red circle above HTF ID1 high.
- Non-repainting; dots appear only at HTF candle close.
- Timeframe-aware rendering (dots show only on selected timeframe).
- Alerts for STB/BTS at HTF close.
Styling & Limits
- Per-feature color/style/width customization.
- Generous limits for boxes, labels, and lines.
- Session tools limited to ≤ 120-minute charts for accuracy.
Anti-Repaint
- HTF signals use lookahead_off and HTF-close gating to avoid repainting.
- BoS/ChoCh and Session logic track prior values and use locks to prevent duplicates.
Quick Start
Set the Timeframe Threshold and pivot periods for lower/higher TFs.
Enable desired Major/Minor BoS/ChoCh lines and customize styles.
Activate Inside Bar Module if required.
Configure Session Breakout window, mode, and alert settings.
Enable BTS/STB detection, keeping 4H default or selecting a custom TF.
Add alerts for chosen signals and let the assistant annotate structure, sessions, and HTF traps.
Best Use with Racktor's Core Trading Strategy
For traders who want structure clarity without clutter, this Analysis-Assistant is built to keep your chart actionable and adaptive.

Key Indicators Dashboard (KID)Key Indicators Dashboard (KID) — Comprehensive Market & Trend Metrics
📌 Overview
The Key Indicators Dashboard (KID) is an advanced multi-metric market analysis tool designed to consolidate essential technical, volatility, and relative performance data into a single on-chart table. Instead of switching between multiple indicators, KID centralizes these key measures, making it easier to assess a stock’s technical health, volatility state, trend status, and relative strength at a glance.
🛠 Key Features
⦿ Average Daily Range (ADR %): Measures average daily price movement over a specified period. It is calculated by averaging the daily price range (high - low) over a set number of days (default 20 days).
⦿ Average True Range (ATR): Measures volatility by calculating the average of a true range over a specific period (default 14). It helps traders gauge the typical extent of price movement, regardless of the direction.
⦿ ATR%: Expresses the Average True Range as a percentage of the price, which allows traders to compare the volatility of stocks with different prices.
⦿ Relative Strength (RS): Compares a stock’s performance to a chosen benchmark index (default NIFTYMIDSML400) over a specific period (default 50 days).
⦿ RS Score (IBD-style): A normalized 1–100 rating inspired by Investor’s Business Daily methodology.
How it works: The RS Score is based on a weighted average of price changes over 3 months (40%), 6 months (20%), 9 months (20%), and 12 months (20%).
The raw value is converted into a percentage return, then normalized over the past 252 trading days so the lowest value maps to 1 and the highest to 100.
This produces a percentile-style score that highlights the strongest stocks in relative terms.
⦿ Relative Volume (RVol): Compares a stock's current volume to its average volume over a specific period (default 50). It is calculated by dividing the current volume by the average historical volume.
⦿ Average ₹ Volume (Turnover): Represents the total monetary value of shares traded for a stock. It's calculated by multiplying a day's closing price by its volume, with the final value converted to crores for clarity. This metric is a key indicator of a stock's liquidity and overall market interest.
⦿ Moving Average Extension: Measures how far a stock's current price has moved from from a selected moving average (EMA or SMA). This deviation is normalized by the stock's volatility (ATR%), with a default threshold of 6 ATR used to indicate that the stock is significantly extended and is marked with a selected shape (default Red Flag).
⦿ 52-Weeks High & Low: Measures a stock's current price in relation to its highest and lowest prices over the past year. It calculates the percentage a stock is below its 52-week high and above its 52-week low.
⦿ Market Capitalization: Market Cap represents the total value of all outstanding.
⦿ Free Float: It is the value of shares readily available for public trading, with the Free Float Percentage showing the proportion of shares available to the public.
⦿ Trend: Uses Supertrend indicator to identify the current trend of a stock's price. A factor (default 3) and an ATR period (default 10) is used to signal whether the trend is up or down.
⦿ Minervini Trend Template (MTT): It is a set of technical criteria designed to identify stocks in strong uptrends.
Price > 50-DMA > 150-DMA > 200-DMA
200-DMA is trending up for at least 1 month
Price is at least 30% above its 52-week low.
Price is within at least 25 percent of its 52-week high
Table highlights when a stock meets all above criteria.
⦿ Sector & Industry: Display stock's sector and industry, provides categorical classification to assist sector-based analysis. The sector is a broad economic classification, while the industry is a more specific group within that sector.
⦿ Moving Averages (MAs): Plot up to four customizable Moving Averages on a chart. You can independently set the type (Simple or Exponential), the source price, and the length for each MA to help visualize a stock's underlying trend.
MA1: Default 10-EMA
MA2: Default 20-EMA
MA3: Default 50-EMA
MA4: Default 200-EMA
⦿ Moving Average (MA) Crossover: It is a trend signal that occurs when a shorter-term moving average crosses a longer-term one. This script identifies these crossover events and plots a marker on the chart to visually signal a potential change in trend direction.
User-configurable MAs (short and long).
A bullish crossover occurs when the short MA crosses above the long MA.
A bearish crossover occurs when the short MA crosses below the long MA.
⦿ Inside Bar (IB): An Inside Bar is a candlestick whose entire price range is contained within the range of the previous bar. This script identifies this pattern, which often signals consolidation, and visually marks bullish and bearish inside bars on the chart with distinct colors and labels.
⦿ Tightness: Identifies periods of low volatility and price consolidation. It compares the price range over a short lookback period (default 3) to the average daily range (ADR). When the lookback range is smaller than the ADR, the indicator plots a marker on the chart to signal consolidation.
⦿ PowerBar (Purple Dot): Identifies candles with a strong price move on high volume. By default, it plots a purple dot when a stock moves up or down by at least 5% and has a minimum volume of 500,000. More dots indicate higher volatility and liquidity.
⦿ Squeezing Range (SQ): Identifies periods of low volatility, which can often precede a significant price move. It checks if the Bollinger Bands have narrowed to a range that is smaller than the Average True Range (ATR) for a set number of consecutive bars (default 3).
(UpperBB - LowerBB) < (ATR × 2)
⦿ Mark 52-Weeks High and Low: Marks and labels a stock's 52-Week High and Low prices directly on the chart. It draws two horizontal lines extending from the candles where the highest and lowest prices occurred over the past year, providing a clear visual reference for long-term price extremes.
⏳PineScreener Filters
The indicator’s alert conditions act as filters for PineScreener.
Price Filter: Minimum and maximum price cutoffs (default ₹25 - ₹10000).
Daily Price Change Filter: Minimum and maximum daily percent change (default -5% and 5%).
🔔 Built-in Alerts
Supports alert creation for:
ADR%, ATR/ATR %, RS, RS Rating, Turnover
Moving Average Crossover (Bullish/Bearish)
Minervini Trend Template
52-Week High/Low
Inside Bars (Bullish/Bearish)
Tightness
Squeezing Range (SQ)
⚙️ Customizable Visualization
Switchable between vertical or horizontal layout.
Works in dark/light mode
User-configurable to toggle any indicator ON or OFF.
User-configurable Moving (EMA/SMA), Period/Lengths and thresholds.
⦿ (Optional) : For horizontal table orientation increase Top Margin to 16% in Chart (Canvas) settings to avoid chart overlapping with table.
⚡ Add this script to your chart and start making smarter trade decisions today! 🚀

GT - Recent High/Low█ OVERVIEW
This indicator will help traders identify the recent high and low of the current trend so we know where we are in the trend. If recent high/low broken it could be that the trend is changing. This indicator is based on price action.
█ HOW IT WORKS
Basically, a trend is when the prices move up and down in a stair-step fashion. In an uptrend, The indicator keeps track of the up and down movement and remember the last high and once the price pull back and broke the recent high it will mark out the new high. When prices pull back in and uptrend it must not broken the recent low. If the pull back move broke the recent low it could means that the trend is changing and we could see prices start going down. Downtrend is the reverse of uptrend.
Whenever the price broke the recent high or low the script will go back from the candle that broken the previous high to find the recent low. As long as the high of previous candle is lower than each other consecutively backward, all of those candle will be counted as part of the up move. The lowest low of these candles will be counted as the recent low. If one of the candles that are part of the up move is an inside bar then the recent low is the low of that inside bar candle (for downtrend it will be the high). Inside bar candle is a candle that it's high and low are both inside the high and low of the candle preceding it (to its left).
█ DISCLAIMERS
The content of this post is NOT investment advice and I am not a financial advisor.
This is for educational purpose only.
Always do you own research. Do not blindly trust a random stranger online.
█ HOW DOES IT HELP YOU
Moving the recent high and low every time a candle break out is a very tedious job. Plus, you cannot set an automatic alert system whenever price broke a recent high or low. This indicator allow you to create an alert whenever a recent high or low is broken.
You can use this indicator as a trailing stop loss strategy. Move the stop loss of your long position to the recent low level whenever price broke recent high or move the stop loss of your short position to the recent high level whenever price broke recent low.
The bullet line is the minor recent high or low before the prices broke the major recent high/low. This line could be the level where prices touch before continue with the trend.
█ TRADING IDEAS
Based on how a candle broke the recent high or low, if it breaks impulsively you can develop your strategy to trade the pullback and hoping on the trend before it continue to move up or down.
█ CURRENT FEATURES
Recent high/low.
Previous high/low.
Inside bar marker.
Alert for when high/low broken. Configurable message format either in JSON or plain text, useful when using with webhook alert.
Bullet line (trend continuation line).
Toggle switch to redraw in realtime. CAUTION: this will cause repainting and alert will fire multiple time during a real-time bar.
█ NOTES
- I am very new to pine script. So there could be a way to handle the alert in realtime to not fire multiple time, Once I found a way I will update the indicator. However, redrawing in realtime will definitely cause repainting of high/low or bullet line, as far as I know this cannot be fixed because it is how pine script compiler works.
- If you like the indicators and it helps you please be sure to leave a like.
█ CREDITS
This indicator is made by me but the idea is inspired by Guerrilla Trading course. Which is why this indicator is closed-source. Guerrilla doesn't support the use of indicators and they believe in mastering reading candle sticks using price action on a naked chart. However, I'm a visual learner, I do my due diligent in backtesting and learning how to read the chart. I think that a little help with indicator to smooth my learning curve or make it easier to identify important level is very useful.
!IMPORTANT!: If you are a member of Guerrilla please do not advertise this indicator on their forum as they do not support the idea of using indicators.
While using the indicator if you found any bugs or the lines draw incorrectly please report it directly to me by leaving a comment or message me directly. Do not report the bugs of this indicator to Guerrilla Trading as this has nothing to do with them and they are not the maintainer.
If you are not a member of Guerrilla but you are considering joining Guerrilla Trading. You can support me out by using my affiliate link in my Signature . Thank you very much!
█ CONTRIBUTE
If you are a developer and a member of Guerrilla and you would like to contribute to this indicator please message me.

Strat AssistantStrat Assistant
This script will help you follow the strat. While other collections of scripts exist to do similar functionality, the idea of this (work in progress) is to be a one stop shop for all things strat that will evolve over time. Fairly new to the strat and pine script. The script is for informational purposes only. Please do you due diligence.
Features:
=Candle numbering: will number candles underneath based on the prior candle. 1 for an inside bar 2 for a directional bar (up or down) and 3 for an outside bar.
=Candle coloring: will highlight candles. Yellow for an inside candle, magenta for an outside candle, red for a 2 down candle, green for a 2 up candle. It will not modify the outside border of the candle so you can still see green if the open was lower than the close or red if the close was below open.
=Candle shape: will place an arrow up if the 2 candle is a directional UP and arrows down if the 2 candle is a directional DOWN. It will display red if it's bearish and green if it's bullish.
=Strat combos: will provide a text description of all currently applicable strat combinations if they are active at the top right of the chart. It will display red if it's bearish and green if it's bullish.
=Actionable signals: will provide text description of actionable signals if they are active on the bottom right of the chart. Inside bar if the bar is inside the prior bar, the color of this signal will be blue (shows better on white background). Hammer will be 75% of the candle is at the bottom and the open and close are above the 75% of the wick. Hammers will display green for bullish. Shooters are just the opposite of hammers, 75% of the wick is at the top and the open and close are below 75% of the wick. Shooters will display at red for bearish.
=Time Frame Continuity: will provide time frame continuity across 15m, 30m, Hour, Day, Week, Quarter, Year with green arrows up if the close is above the open for the given time frame, or red arrows down if the close is below the open for the given time frame. This will also look to determine if the time frame is applicable based on what time frame the user selects as well as ensures history exists for the given time frame.
Backlog / Work in progress:
=Opacity for time frame continuity
=Line indicators (or maybe just a label) for highs and lows of previous periods (hour, day, week, quarter)
=Alert conditions
=User input for various indicators
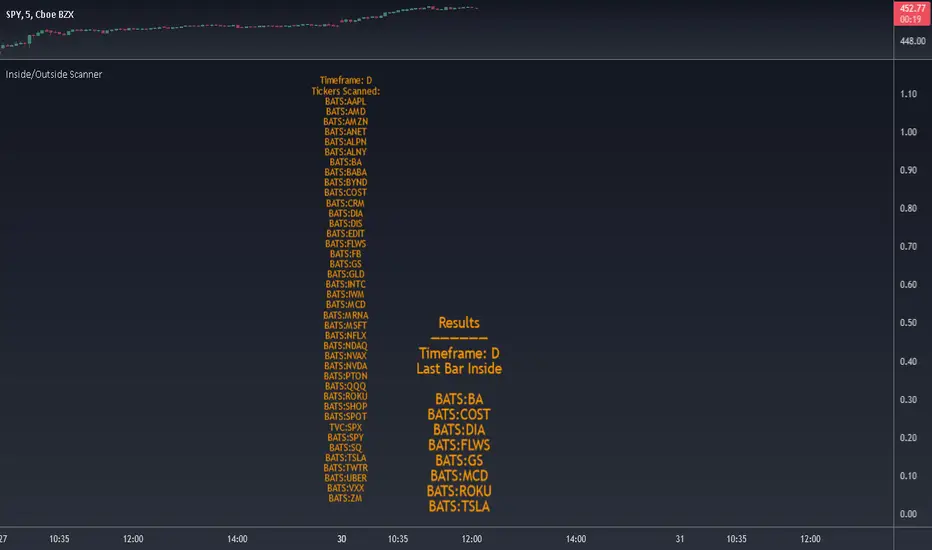
Inside/Outside Scanner40 tickers max. Can change the tickers in the settings.
Choose to scan for Inside or Outside bars for current bar or previous bar.
Also scans for 2 inside consecutive bars and 3 inside bars starting from the current candle.
Change timeframe in the settings. Default is set to 1D.
Please DM me to get access.
TrendPredator PROThe TrendPredator PRO
Stacey Burke, a seasoned trader and mentor, developed his trading system over the years, drawing insights from influential figures such as George Douglas Taylor, Tony Crabel, Steve Mauro, and Robert Schabacker. His popular system integrates select concepts from these experts into a consistent framework. While powerful, it remains highly discretionary, requiring significant real-time analysis, which can be challenging for novice traders.
The TrendPredator indicators support this approach by automating the essential analysis required to trade the system effectively and incorporating mechanical bias and a multi-timeframe concept. They provide value to traders by significantly reducing the time needed for session preparation, offering all relevant chart analysis and signals for live trading in real-time.
The PRO version offers an advanced pattern identification logic that highlights developing context as well as setups related to the constellation of the signals provided. It provides real-time interpretation of the multi-timeframe analysis table, following an extensive underlying logic with more than 150 different setup variations specifically developed for the system and indicator. These setups are constantly back- and forward-tested and updated according to the results. This version is tailored to traders primarily trading this system and following the related setups in detail.
The former TrendPredator ES version does not provide that option. It is significantly leaner and is designed for traders who want to use the multi-timeframe logic as additional confluence for their trading style. It is very well suited to support many other trading styles, including SMC and ICT.
The Multi-timeframe Master Pattern
Inspired by Taylor’s 3-day cycle and Steve Mauro’s work with “Beat the Market Maker,” Burke’s system views markets as cyclical, driven by the manipulative patterns of market makers. These patterns often trap traders at the extremes of moves above or below significant levels with peak formations, then reverse to utilize their liquidity, initiating the next phase. Breakouts away from these traps often lead to range expansions, as described by Tony Crabel and Robert Schabacker. After multiple consecutive breakouts, especially after the psychological number three, overextension might develop. A break in structure may then lead to reversals or pullbacks. The TrendPredator Indicator and the related multi-timeframe trading system are designed to track these cycles on the daily timeframe and provide signals and trade setups to navigate them.
Bias Logic and Multi-Timeframe Concept
The indicator covers the basic signals of Stacey Burke's system:
- First Red Day (FRD): Bearish break in structure, signalling weak longs in the market.
- First Green Day (FGD): Bullish break in structure signalling weak shorts in the markt.
- Three Days of Longs (3DL): Overextension signalling potential weak longs in the market.
- Three Days of Shorts (3DS): Overextension signalling potential weak shorts in the market.
- Inside Day (ID): Contraction, signalling potential impulsive reversal or range expansion move.
It enhances the original system by introducing:
Structured Bias Logic:
Tracks bias by following how price trades concerning the last previous candle high or low that was hit. For example if the high was hit, we are bullish above and bearish below.
- Bullish state: Breakout (BO), Fakeout Low (FOL)
- Bearish state: Breakdown (BD), Fakeout High (FOH)
Multi-Timeframe Perspective:
- Tracks all signals across H4, H8, D, W, and M timeframes, to look for alignment and follow trends and momentum in a mechanical way.
Developing Context:
- Identifies specific predefined context states based on the monthly, weekly and daily bias.
Developing Setups:
- Identifies specific predefined setups based on context and H8 bias as well as SB signals.
The indicator monitors the bias and signals of the system across all relevant timeframes and automates the related graphical chart analysis as well as context and setup zone identification. In addition to the master pattern, the system helps to identify the higher timeframe situation and follow the moves driven by other timeframe traders to then identify favourable context and setup situations for the trader.
Example: Full Bullish Cycle on the Daily Timeframe with Multi-Timeframe Signals
- The Trap/Peak Formation
The market breaks down from a previous day’s and maybe week’s low—potentially after multiple breakdowns—but fails to move lower and pulls back up to form a peak formation low and closes as a first green day.
MTF Signals: Bullish daily and weekly fakeout low; three consecutive breakdown days (1W Curr FOL, 1D Curr FOL, BO 3S).
Context: Reversal (REV)
Setup: Fakeout low continuation low of day (FOL Cont LOD)
- Pullback and Consolidation
The next day pulls further up after first green day signal, potentially consolidates inside the previous day’s range.
MTF Signals: Fakeout low and first green day closing as an inside day (1D Curr IS, Prev FOL, First G).
Context: Reversal continuation (REV Cont)
Setup: Previous fakeout low continuation low handing fruit (Prev FOL Cont LHF)
- Range Expansion/Trend
The following day breaks up through the previous day’s high, launching a range expansion away from the trap.
MTF Signals: Bullish daily breakout of an inside day (1D Curr BO, Prev IS).
Context: Uptrend healthy (UT)
Setup: Breakout continuation low hanging fruit (BO Cont LHF)
- Overextension
After multiple consecutive breakouts, the market reaches a state of overextension, signalling a possible reversal or pullback.
MTF Signals: Three days of breakout longs (1D Curr BO, Prev BO, BO 3L).
Context: Uptrend extended (UT)
- Reversal
After a breakout of previous days high that fails, price pulls away from the high showing a rollover of momentum across all timeframes and a potential short setup.
MTF Signals: Three days of breakout longs, daily fakeout high (1D 3L, FOH)
Context: Reversal countertrend (REV)
Setup: Fakeout high continuation high of day (FOH Cont HOD)
Note: This is only one possible illustrative scenario; there are many variations and combinations.
Example Chart: Full Bullish Cycle with Correlated Signals
Multi-Timeframe Signals examples:
Context and Setups examples:
Note: The signals shown along the move are manually added illustrations. The indicator shows these in realtime in the table at top and bottom right. This is only one possible scenario; there are many variations and combinations.
Due to the fractal nature of markets, this cycle can be observed across all timeframes. The strongest setups occur when there is multi-timeframe alignment. For example, a peak formation and potential reversal on the daily timeframe have higher probability and follow-through when they align with bearish signals on higher timeframes (e.g., weekly/monthly BD/FOH) and confirmation on lower timeframes (H4/H8 FOH/BD). With this perspective, the system enables the trader to follow the trend and momentum while identifying rollover points in a highly differentiated and precise way.
Using the Indicator for Trading
The automated analysis provided by the indicator can be used for thesis generation in preparation for a session as well as for live trading, leveraging the real-time updates as well as the context and setup indicated or alerted. It is recommended to customize the settings deeply, such as hiding the lower timeframes for thesis generation or the specific alert time window and settings to the specific trading schedule and playbook of the trader.
1. Context Assessment:
Evaluate alignment of higher timeframes (e.g., Month/Week, Week/Day). More alignment → Stronger setups.
- The context table offers an interpretation of the higher timeframe automatically. See below for further details.
2. Setup Identification:
Follow the bias of daily and H8 timeframes. A setup mostly requires alignment of these.
Setup Types:
- Trend Trade: Trade in alignment with the previous day’s trend.
Example: Price above the previous day’s high → Focus on long setups (dBO, H8 FOL) until overextension or reversal signs appear (H8 BO 3L, First R).
- Reversal Trade: Identify reversal setups when lower timeframes show rollovers after higher timeframe weakness.
Example: Price below the previous day’s high → Look for reversal signals at the current high of day (H8 FOH, BO 3L, First R).
- The setup table shows potential setups for the specific price zone in the table automatically. See below for further details.
3. Entry Confirmation:
Confirm entries based on H8 and H4 alignment, candle closes and lower timeframe fakeouts.
- H8 and H4 should always align for a final confirmation, meaning the breach lines should be both in the back of a potential trade setup.
- M15/ 5 candle close can be seen as acceptance beyond a level or within the setup zone.
- M15/5 FOH/ FOL signals lower timeframe traps potentially indicating further confirmation.
Example Chart Reversal Trade:
Context: REV (yellow), Reversal counter trend, Month in FOL with bearish First R, Week in BO but bearishly overextended with BO 3L, Day in Fakeout high reversing bearishly.
Setup: FOH Cont HOD (red), Day in Fakeout high after BO 3L overextension, confirmed by H8 FOH high of day, First R as further confluence. Two star quality and countertrend.
Entry: H4 BD, M15 close below followed by M15 FOH.
Detailed Features and Options
1. Context and Setup table
The Context and Setup Table is the core feature of the TrendPredator PRO indicator. It delivers real-time interpretation of the multi-timeframe analysis based on an extensive underlying logic table with over 150 variations, specifically developed for this system and indicator. This logic is continuously updated and optimized to ensure accuracy and performance.
1.1. Developing Context
States for developing higher timeframe context are determined based on signals from the monthly, weekly, and daily timeframes.
- Green and Red indicate alignment and potentially interesting developing setups.
- Yellow signals a mixed or conflicting bias, suggesting caution when taking trades.
The specific states are:
- UT (yellow): Uptrend extended
- UT (green): Uptrend healthy
- REV (yellow): Reversal day counter trend
- REV (green): Reversal day mixed trend
- REV Cont (green): Reversal continuation mixed trend
- REV Cont (yellow): Reversal continuation counter trend
- REV into UT (green): Reversal day into uptrend
- REV Cont into UT (green): Reversal continuation into uptrend
- UT Pullback (yellow): Counter uptrend breakdown day
- Conflicting (yellow): Conflicting signals
- Consolidating (yellow): Consolidating sideways
- Inside (yellow): Trading inside after an inside week
- DT Pullback (yellow): Counter downtrend breakout day
- REV Cont into DT (red): Reversal continuation into downtrend
- REV into DT (red): Reversal day into downtrend
- REV Cont (yellow): Reversal continuation counter trend
- REV Cont (red): Reversal continuation mixed trend
- REV (red): Reversal day mixed trend
- REV (yellow): Reversal day countertrend
- DT (red): Downtrend healthy
- DT (yellow): Downtrend extended
Example: Uptrend
The Uptrend Context (UT, green) indicates a healthy uptrend with all timeframes aligning bullishly. In this case, the monthly is in a Fakeout Low (FOL) and currently inside the range, while the weekly and daily are both in Breakout (BO) states. This context is favorable for developing long setups in the direction of the trend.
Example: Uptrend pullback
The Uptrend Pullback Context (UT Pullback, yellow) indicates a Breakdown (BD) on the daily timeframe against a higher timeframe uptrend. In this case, the monthly is in a Fakeout Low (FOL) and currently inside its range, the weekly is in Breakout (BO) and also currently inside, while the daily is in Breakdown (BD). This context reflects a conflicting situation—potentially signaling either an early reversal back into the uptrend or, if the breakdown extends, the beginning of a possible trend change.
Example: Reversal into Uptrend
The Reversal into Uptrend Context (REV into UT, green) indicates a lower timeframe reversal aligning with a higher timeframe uptrend. In this case, the monthly is in Breakout (BO), the weekly is in Breakout (BO) and currently inside its range, while the daily is showing a bullish Fakeout Low (FOL) reversal. This context is potentially very favorable for long setups, as it signals a strong continuation of the uptrend supported across multiple timeframes.
Example: Reversal
The Bearish Reversal Context indicates a lower timeframe rollover within an ongoing higher timeframe uptrend. In this case, the monthly remains in Breakout (BO), the weekly has shifted into a Fakeout High (FOH) after three weeks of breakout longs, and the daily is already in Breakdown (BD). This context suggests a potentially favorable developing short setup, as early signs of weakness appear across timeframes.
1.2. Developing Setup
The states for specific setups are based on the context and the signals from the daily timeframe and H8, indicating that price is in the zone of alignment. The setup description refers to the state of the daily timeframe, while the suffix relates to the H8 timeframe. For example, "prev FOH Cont LHF" means that the previous day is in FOH (Fakeout High) relative to yesterday's breakout level, currently trading inside, and we are in an H8 breakdown, indicating a potential LHF (Lower High Formation) short trade if the entry confirms. The suffix HOD means that H8 is in FOH or BO (Breakout).
The specific states are:
- REV HOD (red): Reversal high of day
- REV Cont LHF (red): Reversal continuation low hanging fruit
- BO Cont LHF (green): Breakout continuation low hanging fruit
- BO Cont LOD (green): Breakout continuation low of day
- FOH Cont HOD (red): Fakeout high continuation high of day
- FOH Cont LHF ((red): Fakeout high continuation low hanging fruit
- prev BD Cont HOD (red): Previous breakdown continuation high of day
- prev BD Cont LHF (red): Previous breakdown continuation low hanging fruit
- prev FOH Cont HOD (red): Previous fakeout high continuation high of day
- prev FOH Cont LHF (red): Previous fakeout high continuation low hanging fruit
- prev FOL Cont LOD (green): Previous fakeout low continuation low of day
- prev FOL Cont LHF (green): Previous fakeout low continuation low hanging fruit
- prev BO Cont LOD (green): Previous breakout continuation low of day
- prev BO Cont LHF (green): Previous breakout continuation low hanging fruit
- FOL Cont LHF (green): Fakeout low continuation low hanging fruit
- FOL Cont LOD (green): Fakeout low continuation low of day
- BD Cont LHF (red): BD continuation low hanging fruit
- BD Cont LOD (red): Breakdown continuation low of day
- REV Cont LHF (green): Reversal continuation low hanging fruit
- REV LOD (green): Reversal low of day
- Inside: Trading inside after an inside day
Type: Indicates the situation of the indicated setup concerning:
- Trend: Following higher timeframe trend
- Mixed: Mixed higher timeframe signals
- Counter: Against higher timeframe bias
Quality: Indicates the quality of the indicated setup according to the specified logic table
No star: Very low quality
* One star: Low quality
** Two star: Medium quality
*** Three star: High quality
Example: Breakout Continuation Trend Setup
This setup highlights a healthy uptrend where the month is in a breakout, the week is in a fakeout low, and the day is in a breakout after a first green day. As the H8 breaks out to the upside, a long setup zone is triggered, presenting a breakout continuation low-hanging fruit trade. This is a trend trade in an overextended situation on the H8, with an H8 3L, resulting in an overall quality rating of one star.
Example: Fakeout Low Continuation Trend Setup
This setup shows a reversal into uptrend, with the month in a breakout, the week in a breakout, and the day in a fakeout low after breaking down the previous day and now reversing back up. As H8 breaks out to the upside, a long setup zone is triggered, presenting a previous fakeout low continuation, low-hanging fruit trade. This is a medium-quality trend trade.
Example: Reversal Setup - Mixed Trend
This setup shows a reversal setup in line with the weekly trend, with the month in a fakeout low, the week in a fakeout high, and the day in a fakeout high after breaking out earlier in the day and now reversing back down. As H8 loses the previous breakout level after 3 breakouts (with H8 3L), a short setup zone is triggered, presenting a fakeout high continuation at the high of the day. This is a high-quality trade in a mixed trend situation.
Setup Alerts:
Alerts can be activated for setups freshly triggered on the chart within your trading window.
Detailed filter logic for setup alerts:
- Setup quality: 1-3 star
- Setup type: Counter, Mixed and Trend
- Setup category: e.g. Reversal Bearish, Breakout, Previous Fakeout High
- 1D BO and First signals: 3DS, 3DL, FRD, FGD, ID
Options:
- Alerts on/ off
- Alert time window (from/ to)
- Alert filter customization
Note: To activate alerts from a script in TradingView, some settings need to be adjusted. Open the "Create Alert" dialog and select the option "Any alert() function call" in the "Condition" section. Choose "TrendPredator PRO" to ensure that alerts trigger properly from the code. Alerts can be activated for entire watchlists or individual pairs. Once activated, the alerts run in the background and notify the user whenever a setup is freshly triggered according to the filter settings.
2. Multi-Timeframe Table
Provides a real-time view of system signals, including:
Current Timeframe (Curr): Bias states.
- Breakout (green BO): Bullish after breaking above the previous high.
- Fakeout High (red FOH): Bearish after breaking above the previous high but pulling back down.
- Breakdown (red BD): Bearish after breaking below the previous low.
- Fakeout Low (green FOL): Bullish after breaking below the previous low but pulling back up.
- Inside (IS): Price trading neutral inside the previous range, taking the previous bias (color indicates the previous bias).
Previous Timeframe (Prev): Tracks last candle bias state and transitions dynamically.
- Bias for last candle: BO, FOH, BD, FOL in respective colors.
- Inside bar (yellow IS): Indicated as standalone signal.
Note: Also previous timeframes get constantly updated in real time to track the bias state in relation to the level that was hit. This means a BO can still lose the level and become a FOH, and vice versa, and a BD can still become a FOL, and vice versa. This is critical to see for example if traders that are trapped in that timeframe with a FOH or FOL are released. An inside bar stays fixed, though, since no level was hit in that timeframe.
Breakouts (BO): Breakout count 3 longs and 3 shorts.
- 3 Longs (red 3L): Bearish after three breakouts without hitting a previous low.
- 3 Shorts (green 3S): Bullish after three breakdowns without hitting a previous high.
First Countertrend Close (First): Tracks First Red or Green Day.
- First Green (G): After two consecutive red closes.
- First Red (R): After two consecutive green closes.
Options: Customizable font size and label colors.
3. Historic Highs and Lows
Displays historic highs and lows per timeframe for added context, enabling users to track sequences over time.
Timeframes: H4, H8, D, W, M
Options: Customize for timeframes shown, number of historic candles per timeframe, colors, formats, and labels.
4. Previous High and Low Extensions
Displays extended previous levels (high, low, and close) for each timeframe to assess how price trades relative to these levels.
H4: P4H, P4L, P4C
H8: P8H, P8L, P8C
Daily: PDH, PDL, PDC
Weekly: PWH, PWL, PWC
Monthly: PMH, PML, PMC
Options: Fully customizable for timeframes shown, colors, formats, and labels.
5. Breach Lines
Tracks live market reactions (e.g., breakouts or fakeouts) per timeframe for the last previous high or low that was hit, highlighting these levels originating at the breached candle to indicate bias (color-coded).
Red: Bearish below
Green: Bullish above
H4: 4FOL, 4FOH, 4BO, 4BD
H8: 8FOL, 8FOH, 8BO, 8BD
D: dFOL, dFOH, dBO, dBD
W: wFOL, wFOH, wBO, wBD
M: mFOL, mFOH, mBO, mBD
Options: Fully customizable for timeframes shown, colors, formats, and labels.
Overall Options:
Toggle single feature groups on/off.
Customize H8 open/close time as an offset to UTC to be provider independent.
Colour settings con be adjusted for dark or bright backgrounds.
Higher Timeframe Use Case Examples
Example Use Case: Weekly Template Analysis
The Weekly Template is a core concept in Stacey Burke’s trading style. The analysis is conducted on the daily timeframe, focusing on the higher timeframe bias and identifying overextended conditions within the week—such as multiple breakouts and peak formations signaling potential reversals.
In this example, the candles are colored by the TrendPredator FO indicator, which highlights the state of individual candles. This allows for precise evaluation of both the trend state and the developing weekly template. It is a valuable tool for thesis generation before a trading session and for backtesting purposes.
Example Use Case: High Timeframe 5-Star Setup Analysis (Stacey Burke "ain't coming back" ACB Template)
This analysis identifies high-probability trade opportunities when daily breakout or breakdown closes occur near key monthly levels mid-week, signaling overextensions and potentially large parabolic moves. The key signal to look for is a breakout or breakdown close on a Wednesday. This is useful for thesis generation before a session and also for backtesting.
In this example, the TrendPredator FO indicator colors the candles to highlight individual candle states, particularly those that close in breakout or breakdown. Additionally, an indicator is shown on the chart shading every Wednesday, making it easier to visually identify the signals.
5 Star Alerts:
Alerts can be activated for this potential 5-Star setup constellation. The alert is triggered when there is a breakout or breakdown close on a Wednesday.
Further recommendations:
- Higher timeframe context: TPO or volume profile indicators can be used to gain an even better overview.
- Late session trading: Entries later in the session, such as during the 3rd hour of the NY session, offer better analysis and follow-through on setups.
- Entry confirmation: Momentum indicators like VWAP, Supertrend, or EMA are helpful for increasing precision. Additionally, tracking lower timeframe fakeouts can provide powerful confluence. To track those the TrendPredator Fakeout Highlighter (FO), that has been specifically developed for this can be of great help:
Limitations:
Data availability using TradingView has its limitations. The indicator leverages only the real-time data available for the specific timeframe being used. This means it cannot access data from timeframes lower than the one displayed on the chart. For example, if you are on a daily chart, it cannot use H8 data. Additionally, on very low timeframes, the historical availability of data might be limited, making higher timeframe signals unreliable.
To address this, the indicator automatically hides the affected columns in these specific situations, preventing false signals.
Disclaimer
This indicator is for educational purposes only and does not guarantee profits.
None of the information provided shall be considered financial advice.
The indicator does not provide final buy or sell signals but highlights zones for potential setups.
Users are fully responsible for their trading decisions and outcomes.
