Linear Regression InterceptLinear Regression Intercept (LRI) is a statistical method used to forecast future values based on past data. Financial markets frequently employ it to identify the underlying trend and determine when prices are overextended. Linear regression utilizes the least squares method to create a trendline by minimizing the distance between observed price data and the line. The LRI indicator calculates the intercept of this trendline for each data point, providing insights into price trends and potential trading opportunities.
Calculation and Interpretation of the LRI
The linear regression intercept is calculated using the following formula:
LRI = Y - (b * X)
Where Y represents the dependent variable (price), b is the slope of the regression line, and X is the independent variable (time). To determine the slope b, you can use the formula:
b = Σ / Σ(X - X_mean)^2
Once you have computed the LRI, it can be interpreted as the point at which the regression line intersects the Y-axis (price) when the independent variable (time) is zero. A positive LRI value indicates an upward trend, while a negative value suggests a downward trend. Traders can adjust the parameters of the LRI by modifying the period over which the linear regression is computed, which can impact the indicator’s sensitivity to recent price changes.
How to Use the LRI in Trading
To effectively use the LRI in trading, traders should consider the following:
Understanding the signals generated by the technical indicator: A rising LRI suggests an upward trend, whereas a falling LRI indicates a downward trend. Traders may use this information to help determine the market’s direction and identify reversals.
Combining the technical indicator with other indicators: The LRI can be used in conjunction with other technical indicators, such as moving averages, the Relative Strength Index (RSI), or traditional linear regression lines, to obtain a more comprehensive view of the market. In the case of traditional linear regression lines, the LRI helps traders identify the starting point of the trend, providing additional context to the overall trend direction.
Using the technical indicator for entry and exit signals: When the LRI crosses above or below a specific threshold, traders may consider it a potential entry or exit point. For example, if the LRI crosses above zero, it might signal a possible buying opportunity.
"indicators" için komut dosyalarını ara
Triple EMA + QQE Trend Following Strategy [TradeDots]The "Triple EMA + QQE Trend Following Strategy" harnesses the power of two sophisticated technical indicators, the Triple Exponential Moving Average (TEMA) and the Qualitative Quantitative Estimation (QQE), to generate precise buy and sell signals. This strategy excels in capturing shifts in trends by identifying short-term price momentum and dynamic overbought or oversold conditions.
HOW IT WORKS
This strategy integrates two pivotal indicators:
Triple Exponential Moving Average (TEMA): TEMA enhances traditional moving averages by reducing lag and smoothing the data more effectively. It achieves this by applying the EMA formula three times onto the price, as follows:
tema(src, length) =>
ema1 = ta.ema(src, length)
ema2 = ta.ema(ema1, length)
ema3 = ta.ema(ema2, length)
tema = 3*ema1 - 3*ema2 + ema3
This computation helps to sharpen the sensitivity to price movements.
Qualitative Quantitative Estimation (QQE): The QQE indicator improves upon the standard RSI by incorporating a smoothing mechanism. It starts with the standard RSI, overlays a 5-period EMA on this RSI, and then enhances the result using a double application of a 27-period EMA. A slow trailing line is then derived by multiplying the result with a factor number. This approach establishes a more refined and less jittery trend-following signal, complementing the TEMA to enhance overall market timing during fluctuating conditions.
APPLICATION
Referenced from insights on "Trading Tact," the strategy implementation follows:
First of all, we utilize two TEMA lines: one set at a 20-period and the other at a 40-period. Then following the rules below:
40-period TEMA is rising
20-period TEMA is above 40-period TEMA
Price closes above 20-period TEMA
Today is not Monday
RSI MA crosses the Slow trailing line
This strategy does not employ an active take profit mechanism; instead, it utilizes a trailing stop loss to allow the price to reach the stop loss naturally, thereby maximizing potential profit margins.
DEFAULT SETUP
Commission: 0.01%
Initial Capital: $10,000
Equity per Trade: 80%
Users are advised to adjust and personalize this trading strategy to better match their individual trading preferences and style.
RISK DISCLAIMER
Trading entails substantial risk, and most day traders incur losses. All content, tools, scripts, articles, and education provided by TradeDots serve purely informational and educational purposes. Past performances are not definitive predictors of future results.
Reference:
Trading Tact. What Is the QQE Indicator? Retrieved from: tradingtact.com

Dual RSI Differential - Strategy [presentTrading]█ Introduction and How it is Different
The Dual RSI Differential Strategy introduces a nuanced approach to market analysis and trading decisions by utilizing two Relative Strength Index (RSI) indicators calculated over different time periods. Unlike traditional strategies that employ a single RSI and may signal premature or delayed entries, this method leverages the differential between a shorter and a longer RSI. This approach pinpoints more precise entry and exit points, providing a refined tool for traders to exploit market conditions effectively, particularly in overbought and oversold scenarios.
Most important: it is a good eductional code for swing trading.
For beginners, this Pine Script provides a complete function that includes crucial elements such as holding days and the option to configure take profit/stop loss settings:
- Hold Days: This feature ensures that trades are not exited too hastily, helping traders to ride out short-term market volatility. It's particularly valuable for swing trading where maintaining positions slightly longer can lead to capturing significant trends.
- TPSL Condition (None by default): This setting allows traders to focus solely on the strategy's robust entry and exit signals without being constrained by preset profit or loss limits. This flexibility is crucial for learning to adjust strategy settings based on personal risk tolerance and market observations.
BTCUSD 6h LS Performance
█ Strategy, How It Works: Detailed Explanation
🔶 RSI Calculation:
The RSI is a momentum oscillator that measures the speed and change of price movements. It is calculated using the formula:
RSI = 100 - (100 / (1 + RS))
Where RS (Relative Strength) = Average Gain of up periods / Average Loss of down periods.
🔶 Dual RSI Setup:
This strategy involves two RSI indicators:
RSI_Short (RSI_21): Calculated over a short period (21 days).
RSI_Long (RSI_42): Calculated over a longer period (42 days).
Differential Calculation:
The strategy focuses on the differential between these two RSIs:
RSI Differential = RSI_Long - RSI_Short
This differential helps to identify when the shorter-term sentiment diverges from longer-term trends, signaling potential trading opportunities.
BTCUSD Local picuture
🔶 Signal Triggers:
Entry Signal: A buy (long) signal is triggered when the RSI Differential exceeds -5, suggesting strengthening short-term momentum. Conversely, a sell (short) signal occurs when the RSI Differential falls below +5, indicating weakening short-term momentum.
Exit Signal: Trades are generally exited when the RSI Differential reverses past these thresholds, indicating a potential momentum shift.
█ Trade Direction
This strategy accommodates various trading preferences by allowing selections among long, short, or both directions, thus enabling traders to capitalize on diverse market movements and volatility.
█ Usage
The Dual RSI Differential Strategy is particularly suited for:
Traders who prefer a systematic approach to capture market trends.
Those who seek to minimize risks associated with rapid and unexpected market movements.
Traders who value strategies that can be finely tuned to different market conditions.
█ Default Settings
- Trading Direction: Both — allows capturing of upward and downward market movements.
- Short RSI Period: 21 days — balances sensitivity to market movements.
- Long RSI Period: 42 days — smoothens out longer-term fluctuations to provide a clearer market trend.
- RSI Difference Level: 5 — minimizes false signals by setting a moderate threshold for action.
Use Hold Days: True — introduces a temporal element to trading strategy, holding positions to potentially enhance outcomes.
- Hold Days: 5 — ensures that trades are not exited too hastily, helping to ride out short-term volatility.
- TPSL Condition: None — enables traders to focus solely on the strategy's entry and exit signals without preset profit or loss limits.
- Take Profit Percentage: 15% — aims for significant market moves to lock in profits.
- Stop Loss Percentage: 10% — safeguards against large losses, essential for long-term capital preservation.

Median RSI**Description:**
The "Median RSI with Buy/Sell Signals and Bar Color" indicator on TradingView calculates the median Relative Strength Index (RSI) alongside buy and sell signals and customizable bar colors. RSI is a momentum oscillator that measures the speed and change of price movements. This indicator provides traders with insights into the relative strength of a security by comparing its recent gains to its recent losses.
**How it Works:**
1. **RSI Calculation:** The script computes the RSI using a specified length parameter. This RSI value indicates whether a security is overbought or oversold, helping traders identify potential reversal points.
2. **Median RSI Calculation:** It calculates the highest and lowest RSI values over a certain period and finds the median value. This median RSI acts as a benchmark, guiding traders in assessing the relative strength of a security compared to its recent performance.
3. **Bar Color Customization:** The script allows users to customize the bar color based on the relationship between the RSI and the median RSI. Bars are colored differently to visually represent whether the RSI is above, below, or equal to the median RSI. Additionally, the script highlights bars when they cross the median RSI, providing visual cues for potential shifts in market momentum.
**Benefits:**
- **RSI Insights:** Provides insights into the relative strength of a security by comparing its recent gains to its recent losses.
- **Buy/Sell Signals:** Generates buy and sell signals based on the RSI crossing above or below the median RSI, aiding traders in timing their trades.
- **Customizable Bar Colors:** Allows traders to customize bar colors based on the relationship between the RSI and the median RSI, facilitating quick visual analysis.
- **Visual Representation:** Visualizes the RSI median RSI, and bar color on the price chart for easy interpretation.
**Ideal Usage:**
- **Trend Confirmation:** Traders can use the indicator to confirm the direction of the trend before entering trades.
- **Reversal Signals:** Changes in RSI direction, indicated by crosses above or below the median RSI, can signal potential reversals in market momentum.
- **Combination with Other Indicators:** It can be used in conjunction with other technical indicators to enhance trading strategies, providing additional confirmation signals.
**Warnings:**
- **False Signals:** Like any technical indicator, false signals may occur, especially during periods of low volume or choppy market conditions. Additional analysis and risk management techniques should be used to avoid potential losses.
- **Parameter Sensitivity:** Traders should test different parameter settings and consider market conditions when using the indicator, as adjustments may affect its sensitivity to price movements.
By providing insights into RSI dynamics, and offering customizable bar colors, the "Median RSI with Buy/Sell Signals and Bar Color" indicator equips traders with valuable tools for technical analysis and decision-making in the financial markets.

ATH/TTL & 52WH/L with Candle Coloring by RVImportance:
Identifying Key Price Levels: The indicator helps identify critical price levels such as all-time highs (ATH), all-time lows (ATL), 52-week highs (52WH), and 52-week lows (52WL). These levels often act as significant support or resistance areas.
Candle Color Insights: By coloring candles based on their relationship to these key levels, traders can quickly assess market sentiment and potential reversal points.
Visual Representation: The plotted lines and colored candles provide a visual representation of price dynamics, aiding in trend analysis and decision-making.
How to Use:
Key Level Confirmation: Confirm market trends or reversals by observing how price interacts with ATH, ATL, 52WH, and 52WL levels. Breakouts or bounces from these levels can signal strong buying or selling pressure.
Candle Color Signals: Pay attention to candle colors near key levels. For example, green candles above 52WH may indicate bullish momentum, while red candles below 52WL may suggest bearish pressure.
Confirmation with Other Indicators: Use this indicator in conjunction with other technical indicators or chart patterns to validate trading signals. For instance, combine it with moving averages or RSI to confirm potential entry or exit points.
Risk Management: Set stop-loss orders or take-profit levels based on the proximity of price to key levels. Tighten stops or consider profit-taking near significant levels to manage risk effectively.
Lines Plotted:
ATH Line: Represents the all-time high (ATH) levels.
ATL Line: Represents the all-time low (ATL) levels.
52WH Line: Represents the 52-week high (52WH) levels.
52WL Line: Represents the 52-week low (52WL) levels.
52WH 25% Low Line: Represents 25% below the 52-week high.
52WL 30% High Line: Represents 30% above the 52-week low.
Candle Coloring:
Candles are colored based on their relationship to ATH, ATL, 52WH, and 52WL levels.
Green: Close is above 52WH.
Orange: Close is above 52WH but lower than or equal to open.
Red: Close is below 52WL.
Cyan: Close is below 52WL but higher than or equal to open.
Additional Information:
Levels for coloring candles are dynamically calculated based on percentage differences from 52WH and 52WL.
Historical data is fetched to calculate ATH, ATL, 52WH, and 52WL levels.
The script provides a visual representation of key price levels and candle behavior relative to these levels.
Channels With NVI Strategy [TradeDots]The "Channels With NVI Strategy" is a trading strategy that identifies oversold market instances during a bullish trading market. Specifically, the strategy integrates two principal indicators to deliver profitable opportunities, anticipating potential uptrends.
2 MAIN COMPONENTS
1. Channel Indicators: This strategy gives users the flexibility to choose between Bollinger Band Channels or Keltner Channels. This selection can be made straight from the settings, allowing the traders to adjust the tool according to their preferences and strategies.
2. Negative Volume Indicator (NVI): An indicator that calculates today's price rate of change, but only when today's trading volume is less than the previous day's. This functionality enables users to detect potential shifts in the trading volume with time and price.
ENTRY CONDITION
First, the assets price must drop below the lower band of the channel indicator.
Second, NVI must ascend above the exponential moving average line, signifying a possible flood of 'smart money' (large institutional investors or savvy traders), indicating an imminent price rally.
EXIT CONDITION
Exit conditions can be customized based on individual trading styles and risk tolerance levels. Traders can define their ideal take profit or stop loss percentages.
Moreover, the strategy also employs an NVI-based exit policy. Specifically, if the NVI dips under the exponential moving average – suggestive of a fading trading momentum, the strategy grants an exit call.
RISK DISCLAIMER
Trading entails substantial risk, and most day traders incur losses. All content, tools, scripts, articles, and education provided by TradeDots serve purely informational and educational purposes. Past performances are not definitive predictors of future results.

GM-8 and ADX Strategy with Second EMADescription:
This TradingView script implements a trading strategy based on the Moving Average (GM-8), the Average Directional Index (ADX), and the second Exponential Moving Average (EMA). The strategy utilizes these indicators to identify potential buy and sell signals on the chart.
Indicators:
GM-8 (Moving Average 8): This indicator calculates the average price of the last 8 periods and is used to identify trends.
ADX (Average Directional Index): The ADX measures the strength of a trend and is used to determine whether the market is moving in a particular direction or not.
Second EMA (Exponential Moving Average): This is an additional EMA line with a period of 59, which is used to provide additional confirmation signals for the trend.
Trading Conditions:
Buy Condition: A buy signal is generated when the closing price is above the GM-8 and the second EMA, and the ADX value is above the specified threshold.
Sell Condition: A sell signal is generated when the closing price is below the GM-8 and the second EMA, and the ADX value is above the specified threshold.
Trading Logic:
If a buy condition is met, a long position is opened with a user-defined lot size.
If a sell condition is met, a short position is opened with the same user-defined lot size.
Positions are closed when the opposite conditions are met.
User Parameters:
Users can adjust the periods for the GM-8, the second EMA, and the ADX, as well as the threshold for the ADX and the lot size according to their preferences.
Note:
This script has been developed for use on a $100,000 account with FTMO, therefore the account size is set to $100,000. Please ensure that the strategy parameters and settings meet the requirements of your trading strategy and carefully review the results before committing real capital.
--------------------------------------------------------------------------------------------------------------
Beschreibung:
Dieses TradingView-Skript implementiert eine Handelsstrategie, die auf dem gleitenden Mittelwert (GM-8), dem Average Directional Index (ADX) und der zweiten exponentiellen gleitenden Durchschnittslinie (EMA) basiert. Die Strategie verwendet diese Indikatoren, um potenzielle Kauf- und Verkaufssignale auf dem Chart zu identifizieren.
Indikatoren:
GM-8 (Gleitender Mittelwert 8): Dieser Indikator berechnet den Durchschnittspreis der letzten 8 Perioden und wird verwendet, um Trends zu identifizieren.
ADX (Average Directional Index): Der ADX misst die Stärke eines Trends und wird verwendet, um festzustellen, ob sich der Markt in eine bestimmte Richtung bewegt oder nicht.
Zweite EMA (Exponential Moving Average): Dies ist eine zusätzliche EMA-Linie mit einer Periode von 59, die verwendet wird, um zusätzliche Bestätigungssignale für den Trend zu liefern.
Handelsbedingungen:
Kaufbedingung: Es wird ein Kaufsignal generiert, wenn der Schlusskurs über dem GM-8 und der zweiten EMA liegt und der ADX-Wert über dem angegebenen Schwellenwert liegt.
Verkaufsbedingung: Es wird ein Verkaufssignal generiert, wenn der Schlusskurs unter dem GM-8 und der zweiten EMA liegt und der ADX-Wert über dem angegebenen Schwellenwert liegt.
Handelslogik:
Wenn eine Kaufbedingung erfüllt ist, wird eine Long-Position mit einer benutzerdefinierten Losgröße eröffnet.
Wenn eine Verkaufsbedingung erfüllt ist, wird eine Short-Position mit derselben benutzerdefinierten Losgröße eröffnet.
Positionen werden geschlossen, wenn die Gegenbedingungen erfüllt sind.
Benutzerparameter:
Benutzer können die Perioden für den GM-8, die zweite EMA und den ADX sowie den Schwellenwert für den ADX und die Losgröße nach ihren eigenen Präferenzen anpassen.
Hinweis:
Dieses Skript wurde für die Verwendung auf einem $100.000-Konto bei FTMO entwickelt, daher ist die Kontogröße auf $100.000 festgelegt. Bitte stellen Sie sicher, dass die Strategieparameter und -einstellungen den Anforderungen Ihrer Handelsstrategie entsprechen und dass Sie die Ergebnisse sorgfältig überprüfen, bevor Sie echtes Kapital einsetzen.

1000X Dual T3 Set to Any Time Frame1000X Dual T3 Set to Any Time Frame
The "1000X Dual T3 Set to Any Time Frame" is an enhancement of the well-known T3 indicator, building upon the T3 Average script by HPotter , which was itself based on Tim Wilson's work on smoothing techniques. This version provides two T3 lines, which is useful when adapting one each to the long and short trends on the same chart, with the added flexibility of setting the indicator to a higher time frame than the one you are currently trading. We also make the "b" value adjustable, creating a more sensitivity, adaptable indicator. This indicator is recommended as a trend filter or confirmation indicator in trading strategies.
Key Features
Dual Trend Analysis: The dual T3 offers a view of long and short trends to aid in better optimized market analysis. This avoids the problem with using a single T3 line to filter tradable price action for both long and short sides, which forces one to compromise performance in order to achieve profitability in both directions.
Timeframe Customization: This indicator can be set to a desired timeframe while trading another. For example, the T3 can be set as a trend filter on the daily or weekly time frame to separate bull and bear markets, even as you work with other indicators on a chart set to a lower time frame. Set the time frame in the inputs, using minutes (15, 60, 240, etc.) or using D, W, and M.
Preserved T3 Script: Like the powerful HPotter script on which it builds, this indicator leverages EMA-based T3 smoothing calculations for smooth and responsive trend lines.
B Value adjustability: Given the role of the b value in smoothing and sensitivity, I have found it beneficial to make the b value an adjustable input as well. A higher b value will make the T3 line more responsive to recent price changes, making it closer to the actual price movements but potentially more susceptible to market noise.
Visual Trend Indicators: In addition to filtering markets using the "above or below" approach, this script provides colour coding to delineate trend directions.
Acknowledgments
As stated, this work is a tribute to the foundational contributions of Tim Wilson and the subsequent development by HPotter whose script was the basis of this one. The enhancements in this version aim to provide added value to the trading community.

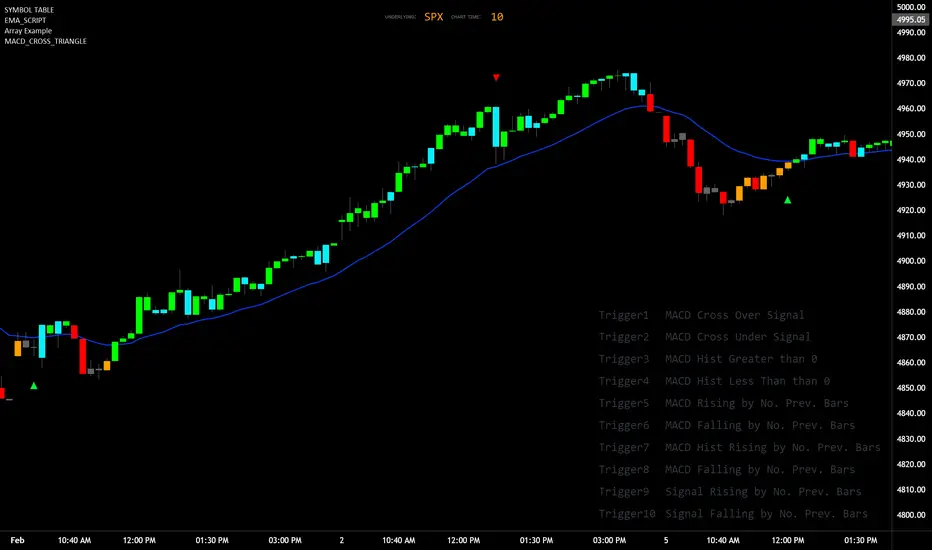
MACD_TRIGGER_CROSS_TRIANGLEMACD Triangle Trigger Indicator by thebearfib
Overview
The MACD Cross Triangle Indicator is a powerful tool for traders who rely on the MACD's signal line crossovers to make informed trading decisions. This indicator enhances the traditional MACD by allowing users to customize triggers for bullish and bearish signals and by displaying these signals directly on the chart with visually distinctive labels.
Features
Customizable Color Scheme: Choose distinct colors for bullish and bearish signals to fit your chart's theme or your personal preference.
Flexible Trigger Conditions: Select from a variety of trigger conditions based on MACD and signal line behaviors over a specified number of bars back.
Visual Signal Indicators: Bullish and bearish signals are marked with upward and downward triangles, making it easy to spot potential entry or exit points.
Detailed Trigger Descriptions: A comprehensive table lists all available triggers and their descriptions, aiding in selection and understanding of each trigger's mechanism.
Configuration Options
Bullish and Bearish Colors: Customize the color of the labels for bullish (upward) and bearish (downward) signals.
Trend Lookback Period: Choose how far back (in bars) the indicator should look to determine the trend, affecting the calculation of certain triggers.
Trigger Selection for Bullish and Bearish Signals: Pick specific triggers for both bullish and bearish conditions from a list of 10 different criteria, ranging from MACD crossovers to historical comparisons of MACD, signal line, and histogram values.
Label Size and Font Settings: Adjust the size of the signal labels on the chart and the font size of the trigger descriptions table to ensure readability and fit with your chart layout.
Trigger Descriptions Table Position and Color: Customize the position and color of the trigger descriptions table to match your chart's aesthetic and layout preferences.
Trigger Mechanisms
Trigger 1 to 10: Each trigger corresponds to a specific condition involving the MACD line, signal line, and histogram. These include crossovers, directional changes compared to previous bars, and comparisons of current values to historical values.
Usage
1. Select Trigger Conditions: Choose the desired triggers for bullish and bearish signals based on your trading strategy.
2. Customize Visuals: Set your preferred colors for the bullish and bearish labels, adjust label and font sizes, and configure the trigger descriptions table.
3. Analyze Signals: Watch for the upward (bullish) and downward (bearish) triangles to identify potential trading opportunities based on MACD crossover signals.
Conclusion
The MACD Cross Triangle Indicator offers a customizable and visually intuitive way to leverage MACD crossover signals for trading. With its flexible settings and clear signal indicators, traders can tailor the indicator to fit their strategy and improve their decision-making process on TradingView.
Bullish Candle Highlighter by MalviyaOverview:
The Bullish Candle Highlighter is a comprehensive and user-friendly TradingView indicator designed to assist traders in identifying individual bullish candles, facilitating the recognition of potential bullish trends and reversal patterns. This tool is meticulously crafted to enhance the precision of your technical analysis, making it an essential addition to your trading arsenal.
Key Features:
Bullish Candle Identification:
The indicator meticulously scans price action, pinpointing individual candles with a bullish bias.
Each identified bullish candle is distinctly marked on the chart for easy recognition.
Minimum Body Size Filter:
To refine the selection of signals, the indicator incorporates a minimum body size filter.
This filter ensures that only candles with a significant body size are considered, reducing noise and enhancing the reliability of bullish signals.
Visual Highlighting:
Bullish candles are visually highlighted with a vibrant green background, ensuring they stand out on your chart.
The visual cues simplify the process of identifying potential entry points during bullish market conditions.
How to Use:
Bullish Candle Identification:
Keep an eye on the chart for instances where the indicator marks a candle with the label "Bullish Candle."
Each marked candle signifies a potential bullish reversal or continuation pattern.
Buy Signal:
Consider entering a long position when the current candle closes above the high of the identified bullish candle.
The indicator's signals can be used to align your trading decisions with emerging bullish trends.
Advanced Tips:
Confirmation with Other Indicators:
Boost the accuracy of your trades by combining Bullish Candle Highlighter signals with other technical indicators or trend analysis tools.
Risk Management:
Implement sound risk management strategies to protect your capital and optimize your trading performance.
Important Note:
The Bullish Candle Highlighter is a valuable tool, but no indicator guarantees profits. Always conduct thorough analysis and consider multiple factors before making trading decisions.
Disclaimer:
This indicator is provided for educational purposes and is not financial advice. Trading involves risk, and past performance is not indicative of future results.
Feel free to tailor the description to match any specific features or nuances of your indicator. Providing detailed information and usage guidance will help users understand and maximize the benefits of your Bullish Candle Highlighter.

Gross and Net LTF Volume + Trailing Percentile Sessions CVOL Hi Traders !
Gross volume, net lower time frame (LTF) volume and trailing session percentile Cumulative session volume:
The code calculates and plots the following volume indicators:
Volume (Gross Volume): The total volume for the current bar.
Net lower time frame volume: The difference between the buy and sell volumes of the lower time frame.
Cumulative daily session volume: The cumulative sum of the volume for the current day.
Percentile Cumulative daily session volume: The percentile of the cumulative daily session volume (calculated on a rolling basis).
The above indicators may be plotted exclusively or exclusively.
Why is Volume important:
Volume is the number of shares or contracts traded (of a financial asset) during a given time period (timeframe). It is a crucial indicator in technical analysis and quantitative trading, as volume helps in identifying
Price Confirmation: Volume confirms price movements by indicating the level of interest and participation in the market. When prices move significantly, accompanied by strong volume, it suggests that the movement is likely to be sustained. Conversely, if prices move without significant volume, it suggests that the movement may be temporary or lacking conviction.
Trend Strength: Volume can help identify the strength and direction of a trend. During an uptrend, increasing volume alongside price increases indicates that the upward momentum is gaining traction. Conversely, decreasing volume during an uptrend suggests that the upward momentum may be weakening.
Reversal Points: Sharp volume spikes in the opposite direction of the prevailing trend can signal a potential reversal point. This is because large volume indicates a significant shift in trader sentiment, suggesting that the trend may be changing direction.
Liquidity: High volume indicates that a security is liquid, meaning that it can be easily bought and sold without significant price impact. Liquidity is important for traders who want to execute large orders without significantly affecting the market price.
For example, suppose we want to identify positive price confirmation and positive trend strength, in this case we may use the CVOL (with trailing percentile).
The above image showcases price expansion conditional on high positive volume (increasing CVOL), The price expansion also exhibits Volume confluences (the colored bars).
Positive Confluence: Increase in positive total volume and an increase in positive lower time frame volume in relative and absolute terms.
Negative Confluence : Increase in negative total volume and an increase in negative lower time frame volume in relative and absolute terms.
Also note how the percentile color does not change, this means that the new volume bars are > than the highest percentile (80%) of volume values from the beginning of the session.

Mike's Crossover BotGreetings! As a newcomer to coding, I've developed a simple trading bot for experimentation purposes. However, it's important to note that this bot has not undergone rigorous testing, so please exercise caution and use it at your own risk.
Bot Overview:
The bot operates by leveraging two technical indicators: Moving Average Convergence Divergence (MACD) with 7-day and 25-day parameters, and the Relative Strength Index (RSI). These indicators help identify potential buying and selling opportunities in the market.
MACD Crossovers:
The MACD is a trend-following momentum indicator that compares short-term and long-term moving averages. In our bot, we look for crossovers between the 7-day and 25-day MACD lines. A crossover occurs when these lines intersect, suggesting a potential change in market direction.
RSI Confirmation:
To refine our signals, we incorporate the Relative Strength Index (RSI). When a MACD crossover happens, the bot checks if the RSI is below 40. If it is, a buy signal is generated, indicating a potential undervalued condition. Conversely, when the RSI is above 60 during a crossover, a sell signal is triggered, suggesting a potentially overvalued condition.
Important Considerations:
New Coder Disclaimer: This bot is designed for educational purposes, especially for those who are new to coding. It serves as a learning tool and is not intended for live trading without proper testing.
Risk Awareness: Trading always involves risks, and the bot's performance has not been thoroughly tested in live market conditions. It's crucial to exercise caution and be aware of the inherent risks associated with financial markets.
Continuous Learning: Coding and algorithmic trading are dynamic fields. As you explore this bot, consider it a starting point for learning and continuously seek to enhance your understanding and skills in coding and trading strategies.
Remember, the success of any trading strategy depends on various factors, and past performance is not indicative of future results. Always conduct thorough testing before considering any automated strategy for live trading.

Goldmine Wealth Builder - DKK/SKKGoldmine Wealth Builder
Version 1.0
Introduction to Long-Term Investment Strategies: DKK, SKK1 and SKK2
In the dynamic realm of long-term investing, the DKK, SKK1, and SKK2 strategies stand as valuable pillars. These strategies, meticulously designed to assist investors in building robust portfolios, combine the power of Super Trend, RSI (Relative Strength Index), Exponential Moving Averages (EMAs), and their crossovers. By providing clear alerts and buy signals on a daily time frame, they equip users with the tools needed to make well-informed investment decisions and navigate the complexities of the financial markets. These strategies offer a versatile and structured approach to both conservative and aggressive investment, catering to the diverse preferences and objectives of investors.
Each part of this strategy provides a unique perspective and approach to the accumulation of assets, making it a versatile and comprehensive method for investors seeking to optimize their portfolio performance. By diligently applying this multi-faceted approach, investors can make informed decisions and effectively capitalize on potential market opportunities.
DKK Strategy for ETFs and Funds:
The DKK system is a strategy designed for accumulating ETFs and Funds as long-term investments in your portfolio. It simplifies the process of identifying trend reversals and opportune moments to invest in listed ETFs and Funds, particularly during bull markets. Here's a detailed explanation of the DKK system:
Objective: The primary aim of the DKK system is to build a long-term investment portfolio by focusing on ETFs and Funds. It facilitates the identification of stocks that are in the process of reversing their trends, allowing investors to benefit from upward price movements in these financial instruments.
Stock Selection Criteria: The DKK system employs specific criteria for selecting ETFs and Funds:
• 200EMA (Exponential Moving Average): The system monitors whether the prices of ETFs and Funds are consistently below the 200-day Exponential Moving Average. This is considered an indicator of weakness, especially on a daily time frame.
• RSI (Relative Strength Index): The system looks for an RSI value of less than 40. An RSI below 40 is often seen as an indication of a weak or oversold condition in a financial instrument.
Alert Signal: Once the DKK system identifies ETFs and Funds meeting these criteria, it provides an alert signal:
• Red Upside Triangle Sign: This signal is automatically generated on the daily chart of ETFs and Funds. It serves as a clear indicator to investors that it's an opportune time to accumulate these financial instruments for long-term investment.
It's important to note that the DKK system is specifically designed for ETFs and Funds, so it should be applied to these types of investments. Additionally, it's recommended to track index ETFs and specific types of funds, such as REITs (Real Estate Investment Trusts) and INVITs (Infrastructure Investment Trusts), in line with the DKK system's approach. This strategy simplifies the process of identifying investment opportunities within this asset class, particularly during periods of market weakness.
SKK1 Strategy for Conservative Stock Investment:
The SKK 1 system is a stock investment strategy tailored for conservative investors seeking long-term portfolio growth with a focus on stability and prudent decision-making. This strategy is meticulously designed to identify pivotal market trends and stock price movements, allowing investors to make informed choices and capitalize on upward market trends while minimizing risk. Here's a comprehensive overview of the SKK 1 system, emphasizing its suitability for conservative investors:
Objective: The primary objective of the SKK 1 system is to accumulate stocks as long-term investments in your portfolio while prioritizing capital preservation. It offers a disciplined approach to pinpointing potential entry points for stocks, particularly during market corrections and trend reversals, thereby enabling you to actively participate in bullish market phases while adopting a conservative risk management stance.
Stock Selection Criteria: The SKK 1 system employs a stringent set of criteria to select stocks for investment:
• Correction Mode: It identifies stocks that have undergone a correction, signifying a decline in stock prices from their recent highs. This conservative approach emphasizes the importance of seeking stocks with a history of stability.
• 200EMA (Exponential Moving Average): The system diligently analyses daily stock price movements, specifically looking for stocks that have fallen to or below the 200-day Exponential Moving Average. This indicator suggests potential overselling and aligns with a conservative strategy of buying low.
Trend Reversal Confirmation: The SKK 1 system doesn't merely pinpoint stocks in correction mode; it takes an extra step to confirm a trend reversal. It employs the following indicators:
• Short-term Downtrends Reversal: This aspect focuses on identifying the reversal of short-term downtrends in stock prices, observed through the transition of the super trend indicator from the red zone to the green zone. This cautious approach ensures that the trend is genuinely shifting.
• Super Trend Zones: These zones are crucial for assessing whether a stock is in a bullish or bearish trend. The system consistently monitors these zones to confirm a potential trend reversal.
Alert & Buy Signals: When the SKK 1 system identifies stocks that have reached a potential bottom and are on the verge of a trend reversal, it issues vital alert signals, aiding conservative investors in prudent decision-making:
• Orange Upside Triangle Sign: This signal serves as a cautious heads-up, indicating that a stock may be poised for a trend reversal. It advises investors to prepare funds for potential investment without taking undue risks.
• Green Upside Triangle Sign: This is the confirmation of a trend reversal, signifying a robust buy signal. Conservative investors can confidently enter the market at this point, accumulating stocks for a long-term investment, secure in the knowledge that the trend is in their favor.
In summary, the SKK 1 system is a systematic and conservative approach to stock investing. It excels in identifying stocks experiencing corrections and ensures that investors act when there's a strong indication of a trend reversal, all while prioritizing capital preservation and risk management. This strategy empowers conservative investors to navigate the intricacies of the stock market with confidence, providing a calculated and stable path toward long-term portfolio growth.
Note: The SKK1 strategy, known for its conservative approach to stock investment, also provides an option to extend its methodology to ETFs and Funds for those investors who wish to accumulate assets more aggressively. By enabling this feature in the settings, you can harness the SKK1 strategy's careful criteria and signal indicators to accumulate aggressive investments in ETFs and Funds.
This flexible approach acknowledges that even within a conservative strategy, there may be opportunities for more assertive investments in assets like ETFs and Funds. By making use of this option, you can strike a balance between a conservative stance in your stock portfolio while exploring an aggressive approach in other asset classes. It offers the versatility to cater to a variety of investment preferences, ensuring that you can adapt your strategy to suit your financial goals and risk tolerance.
SKK 2 Strategy for Aggressive Stock Investment:
The SKK 2 strategy is designed for those who are determined not to miss significant opportunities within a continuous uptrend and seek a way to enter a trend that doesn't present entry signals through the SKK 1 strategy. While it offers a more aggressive entry approach, it is ideal for individuals willing to take calculated risks to potentially reap substantial long-term rewards. This strategy is particularly suitable for accumulating stocks for aggressive long-term investment. Here's a detailed description of the SKK 2 strategy:
Objective: The primary aim of the SKK 2 strategy is to provide an avenue for investors to identify short-term trend reversals and seize the opportunity to enter stocks during an uptrend, thereby capitalizing on a sustained bull run. It acknowledges that there may not always be clear entry signals through the SKK 1 strategy and offers a more aggressive alternative.
Stock Selection Criteria: The SKK 2 strategy utilizes a specific set of criteria for stock selection:
1. 50EMA (Exponential Moving Average): It targets stocks that are trading below the 50-day Exponential Moving Average. This signals a short-term reversal from the top and indicates that the stock is in a downtrend.
2. RSI (Relative Strength Index): The strategy considers stocks with an RSI of less than 40, which is an indicator of weakness in the stock.
Alert Signals: The SKK 2 strategy provides distinct alert signals that facilitate entry during an aggressive reversal:
• Red Downside Triangle Sign: This signal is triggered when the stock is below the 50EMA and has an RSI of less than 40. It serves as a clear warning of a short-term reversal from the top and a downtrend, displayed on the daily chart.
• Purple Upside Triangle Sign: This sign is generated when a reversal occurs through a bullish candle, and the RSI is greater than 40. It signifies the stock has bottomed out from a short-term downtrend and is now reversing. This purple upside triangle serves as an entry signal on the chart, presenting an attractive opportunity to accumulate stocks during a strong bullish phase, offering a chance to seize a potentially favorable long-term investment.
In essence, the SKK 2 strategy caters to aggressive investors who are willing to take calculated risks to enter stocks during a continuous uptrend. It focuses on identifying short-term reversals and provides well-defined signals for entry. While this strategy is more aggressive in nature, it has the potential to yield substantial rewards for those who are comfortable with a higher level of risk and are looking for opportunities to build a strong long-term portfolio.
Introduction to Strategy Signal Information Chart
This chart provides essential information on strategy signals for DKK, SKK1, and SKK2. By quickly identifying "Buy" and "Alert" signals for each strategy, investors can efficiently gauge market conditions and make informed decisions to optimize their investment portfolios.
In Conclusion
These investment strategies, whether conservative like DKK and SKK1 or more aggressive like SKK2, offer a range of options for investors to navigate the complex world of long-term investments. The combination of Super Trend, RSI, and EMAs with their crossovers provides clear signals on a daily time frame, empowering users to make well-informed decisions and potentially capitalize on market opportunities. Whether you're looking for stability or are ready to embrace more risk, these strategies have something to offer for building and growing your investment portfolio.

Leading Economic Indicator (LEI)The Leading Economic Indicator (LEI) is a groundbreaking technical indicator designed to serve as a comprehensive measure of the prevailing direction of economic trends in the United States. This unique index combines two key economic indicators: the Composite Leading Indicator (CLI) from the Organization for Economic Co-operation and Development (OECD) and the Purchasing Managers' Index (PMI) from the Institute for Supply Management (ISM).
The OECD Composite Leading Indicator (CLI) is a globally recognized indicator that assesses the future direction of economic trends by analyzing various leading economic factors. The ISM PMI, on the other hand, provides insights into the business activities of both the manufacturing and services sectors. LEI merges these critical indicators into a single, holistic indicator that empowers traders and investors to grasp the broader economic outlook and the performance of essential economic sectors simultaneously.
By taking into account the CLI and PMI, LEI offers a distinctive perspective, enabling a more accurate assessment of the potential direction of US financial markets.
Usage:
To utilize LEI effectively, it is recommended to apply it on a monthly timeframe (TF Monthly). This extended timeframe is particularly beneficial for investors with a medium to long-term horizon. By focusing on longer-term trends and market stability, LEI becomes an invaluable tool in your investment strategy.
One of the primary applications of LEI is to gauge the risk of market corrections in US financial markets, including the S&P 500, Nasdaq, and Dow Jones indices. Analysts often observe the crossing of the 5-period Simple Moving Average (SMA) with the 10-period SMA. When the 5-period SMA falls below the 10-period SMA, it serves as a potential warning signal for an impending market correction. This feature provides traders with an opportunity to exercise caution and make well-informed investment decisions.
LEI, with its unique blend of the OECD CLI and ISM PMI, provides a reliable tool for assessing the US economic climate, identifying trends, and making informed decisions in the financial markets. It stands as a reference indicator, capturing the essence of economic trends and providing valuable insights to traders and investors.
Sources:
- OECD Composite Leading Indicator (CLI): www.data.oecd.org
- Purchasing Managers' Index: ISM Report on Business (PMI) www.ismworld.org

Sequence Volume BarsThis script in TradingView is designed to identify sequences of bars with increasing volume. It creates two indicators: one for bullish trends (green sequence) and another for bearish trends (red sequence).
Green Sequence: The script considers a green sequence when the current closing price is higher than the previous one, and the volume is increasing. When the green sequence approaches a user-defined length, it highlights it on the chart with a green triangle below the bar.
Red Sequence: Similarly, the script looks for a bearish sequence when the current closing price is lower than the previous one, and the volume is increasing. When the red sequence approaches the specified length, it highlights it with a red triangle above the bar.
Both indicators can also send alerts when their respective sequences reach the specified length minus one. This script can be useful for traders seeking entry points based on specific volume patterns in the market.
P.S. I'm not sure how this can be useful to you, but sometimes a pump and dump can be predicted. Maybe you'll come up with ideas on how to refine this concept.
-----------
Этот скрипт для TradingView предназначен для выявления последовательностей баров с ростом объема. Он создает два индикатора: один для бычьих трендов (зеленая последовательность) и другой для медвежьих трендов (красная последовательность).
Зеленая последовательность: Скрипт считает, что происходит зеленая последовательность, если текущая цена закрытия выше предыдущей, а объем увеличивается. Когда зеленая последовательность по длине приближается к заданной пользователем, он выделяет это на графике зеленым треугольником под баром.
Красная последовательность: Аналогично скрипт ищет медвежью последовательность, когда текущая цена закрытия ниже предыдущей, а объем растет. Когда красная последовательность приближается к указанной длине, он выделяет это красным треугольником над баром.
Оба индикатора могут также отправлять предупреждения, когда соответствующая последовательность достигает заданной длины минус один. Этот скрипт может быть полезен для трейдеров, ищущих входные точки, основанные на определенных шаблонах объема в рынке.
Не знаю как вам может это пригодиться, но иногда предсказывается пам и дамп. Может у Вас появится идея как доработать эту идею
TraderJoe TickMarket sentiment and market breadth are important factors for traders to consider when making trading decisions.
The TICK index , which reflects the buying and selling activity of an entire index, can provide valuable insights into market sentiment and breadth.
1. Assessing Market Sentiment:
- Positive TICK: When the TICK index is consistently positive (indicating more stocks are being bought at or above the asking price), it suggests overall bullish sentiment in the market.
- Negative TICK: Conversely, a consistently negative TICK indicates bearish sentiment, where more stocks are being sold at or below the asking price.
2. Market Breadth:
- Look at the TICK readings for various market indexes, not just one. If all major market indexes are experiencing the same sentiment (e.g., all have aggressive buyers), it's a stronger signal of a broader market trend.
3. Using the TICK for Entry and Exit:
- Positive TICK can be an entry signal for long positions. Traders might consider going long when the TICK index is consistently positive, indicating strong buying pressure in the market.
- Negative TICK can be an entry signal for short positions. When the TICK is consistently negative, it suggests selling pressure, making shorting more attractive.
- Exit positions or take profits when the TICK starts to show signs of reversing from its extreme levels. An excessively positive TICK might indicate overbought conditions, while an overly negative TICK may signal oversold conditions.
4. Combining TICK with Other Indicators:
- It's often beneficial to combine TICK analysis with other technical and fundamental indicators to increase the accuracy of your trading decisions. For example, you could use moving averages, RSI, or support and resistance levels to confirm your entry and exit points.
5. Low Float Stocks and TICK:
- Low float stocks can be more volatile, making TICK analysis even more crucial. In these cases, watch for extreme TICK readings, as they can trigger rapid price movements.
- Be cautious when trading low float stocks, as they can be susceptible to price manipulation due to limited liquidity. Use proper risk management techniques, like setting stop-loss orders.
6. Stay Informed:
- Keep an eye on news and events that might explain sudden shifts in market sentiment. Unexpected news, economic releases, or geopolitical events can quickly change market dynamics.

ATR + Momentum Shifts w/Take ProfitThis script is a technical analysis indicator designed to assist in identifying potential entry points and setting take profit levels in trading. It combines the Average True Range (ATR) indicator, momentum shifts, and customizable take profit levels to provide insights into potential market movements.
Differences from Currently Published Ones:
This script is unique due to its use of a combination of elements:
ATR and Momentum: The script combines the ATR indicator to provide dynamic support and resistance levels with the momentum indicator to identify shifts in the underlying momentum.
Customizable Take Profit Levels: It offers the ability to set take profit levels based on customizable multipliers of the ATR, helping traders manage potential profits.
How to Use:
ATR Bands: The script plots upper and lower ATR bands as potential dynamic support and resistance levels.
Shift Arrows: Arrows are plotted below bars for potential long entry opportunities (green triangle) and above bars for potential short entry opportunities (yellow triangle).
Take Profit Levels: The script also plots take profit levels both above and below the source price based on the ATR multipliers set in the inputs.
Markets and Conditions:
This script can be used across various financial markets, including stocks, forex, commodities, and cryptocurrencies. It's most effective in trending markets where momentum shifts can signal potential reversals or continuation of trends. Traders should consider the following conditions:
Trend Confirmation: Look for momentum shifts in the direction of the prevailing trend for higher probability setups.
Volatility: Higher volatility can amplify ATR movements and subsequently affect the placement of ATR bands and take profit levels.
Risk Management: Always implement proper risk management strategies to protect your capital.
Additional Considerations:
Customization: Traders can adjust input parameters like ATR length, momentum length, and take profit multipliers to match their trading style and market conditions.
Combining with Other Indicators: Consider using this indicator in conjunction with other technical indicators or chart patterns for confirmation.

CC Trend strategy 2- Downtrend ShortTrend Strategy #2
Indicators:
1. EMA(s)
2. Fibonacci retracement with a mutable lookback period
Strategy:
1. Short Only
2. No preset Stop Loss/Take Profit
3. 0.01% commission
4. When in a profit and a closure above the 200ema, the position takes a profit.
5. The position is stopped When a closure over the (0.764) Fibonacci ratio occurs.
* NO IMMEDIATE RE-ENTRIES EVER!*
How to use it and what makes it unique:
This strategy will enter often and stop quickly. The goal with this strategy is to take losses often but catch the big move to the downside when it occurs through the Silvercross/Fibonacci combination. This is a unique strategy because it uses a programmed Fibonacci ratio that can be used within the strategy and on any program. You can manipulate the stats by changing the lookback period of the Fibonacci retracement and looking at different assets/timeframes.
This description tells the indicators combined to create a new strategy, with commissions and take profit/stop loss conditions included, and the process of strategy execution with a description of how to use it. If you have any questions feel free to PM me and boost if you found it helpful. Thank you, pineUSERS!
CHEATCODE1

Quantitative Trend Strategy- Uptrend longTrend Strategy #1
Indicators:
1. SMA
2. Pivot high/low functions derived from SMA
3. Step lines to plot support and resistance based on the pivot points
4. If the close is over the resistance line, green arrows plot above, and vice versa for red arrows below support.
Strategy:
1. Long Only
2. Mutable 2% TP/1.5% SL
3. 0.01% commission
4. When the close is greater than the pivot point of the sma pivot high, and the close is greater than the resistance step line, a long position is opened.
*At times, the 2% take profit may not trigger IF; the conditions for reentry are met at the time of candle closure + no exit conditions have been triggered.
5. If the position is in the green and the support step line crosses over the resistance step line, positions are exited.
How to use it and what makes it unique:
Use this strategy to trade an up-trending market using a simple moving average to determine the trend. This strategy is meant to capture a good risk/reward in a bullish market while staying active in an appropriate fashion. This strategy is unique due to it's inclusion of the step line function with statistics derived from myself.
This description tells the indicators combined to create a new strategy, with commissions and take profit/stop loss conditions included, and the process of strategy execution with a description on how to use it. If you have any questions feel free to PM me and boost if you enjoyed it. Thank you, pineUSERS!

Variety Step RSI w/ Dynamic Zones [Loxx]Variety Step RSI w/ Dynamic Zones is a stepped RSI calculation with Discontinued Signal Lines. This indicator includes 7 types of RSI to choose from. The addition of the Discontinued Signal Lines allows this indicator to better identify momentum shifts in price so traders have better defined long/short signals.
Enhanced Moving Average Calculation with Stepped Moving Average and the Advantages over Regular RSI
Technical analysis plays a crucial role in understanding and predicting market trends. One popular indicator used by traders and analysts is the Relative Strength Index (RSI). However, an enhanced approach called Stepped Moving Average, in combination with the Slow RSI function, offers several advantages over regular RSI calculations.
█ Stepped Moving Average and Moving Averages:
The Stepped Moving Average function serves as a crucial component in the calculation of moving averages. Moving averages smooth out price data over a specific period to identify trends and potential trading signals. By employing the Stepped Moving Average function, traders can enhance the accuracy of moving averages and make more informed decisions.
Stepped Moving Average takes two parameters:
The current RSI value and a size parameter. It computes the next step in the moving average calculation by determining the upper and lower bounds of the moving average range. It accomplishes this by adjusting the values of smax and smin based on the given RSI and size.
Furthermore, Stepped Moving Average introduces the concept of a trend variable. By comparing the previous trend value with the current RSI and the previous upper and lower bounds, it updates the trend accordingly. This feature enables traders to identify potential shifts in market sentiment and make timely adjustments to their trading strategies.
█ Advantages over Regular RSI:
Enhanced Range Boundaries:
The inclusion of size parameters in Stepped Moving Average allows for more precise determination of the upper and lower bounds of the moving average range. This feature provides traders with a clearer understanding of the potential price levels that can influence market behavior. Consequently, it aids in setting more effective entry and exit points for trades.
Improved Trend Identification:
The trend variable in Stepped Moving Average helps traders identify changes in market trends more accurately. By considering the previous trend value and comparing it to the current RSI and previous bounds, Stepped Moving Average captures trend reversals with greater precision. This capability empowers traders to respond swiftly to market shifts and potentially capture more profitable trading opportunities.
Smoother Moving Averages:
Stepped Moving Average's ability to adjust the moving average range bounds based on trend changes and size parameters results in smoother moving averages. Regular RSI calculations may produce jagged or erratic results due to abrupt market movements. Stepped Moving Average mitigates this issue by dynamically adapting the range boundaries, thereby providing traders with more reliable and consistent moving average signals.
Complementary Functionality with Slow RSI:
Stepped Moving Average and Slow RSI function in harmony to provide a comprehensive trading analysis toolkit. While Stepped Moving Average refines the moving average calculation process, Slow RSI offers a more accurate representation of market strength. The combination of these two functions facilitates a deeper understanding of market dynamics and assists traders in making better-informed decisions.
What is a Discontinued Signal Line (DSL)?
Many indicators employ signal lines to more easily identify trends or desired states of the indicator. The concept of a signal line is straightforward: by comparing a value to its smoothed, slightly lagging state, one can determine the current momentum or state.
The Discontinued Signal Line builds on this fundamental idea by extending it: rather than having a single signal line, multiple lines are used based on the indicator's current value.
The "signal" line is calculated as follows:
When a specific level is crossed in the desired direction, the EMA of that value is calculated for the intended signal line.
When that level is crossed in the opposite direction, the previous "signal" line value is "inherited," becoming a sort of level.
This approach combines signal lines and levels, aiming to integrate the advantages of both methods.
In essence, DSL enhances the signal line concept by inheriting the previous signal line's value and converting it into a level.
Extras
-Alerts
-Signals
Related indicators:
Step RSI

CANDLE STICK HEATMAPCANDLE STICK HEATMAP shows the statistics of a candle at a particular time. its very useful to find repeating pattern's at a particular time in a day.
based on the settings you can see regular repeating patterns of a day in an hourly chart. During a particular time in day there is always a down or up signal or candles.
The table boxes are candles in RED and GREEN based on open and close of the chart. The Heat map is very useful in analyzing the daily Hourly candlesticks in a week. The Time of each candlestick is plotted on the table along with default Indicators like RSI, MACD, EMA, VOLUME, ADX.
Additionally this can be used as a screener of candles on all timeframes. Analysis is easy when you want to see what happened exactly at a particular time in the previous hour, day, month etc.,
Hopefully additional updates will be introduced shortly.
Indicators:
1. MACD (close,12,26,9)
2.RSI (close,14)
3.EMA 200
3.Volume MA
Option is provided to show indicator statistics and time.
Color can be changed using settings.
Supports all Time Zones

Multi-Divergence Buy/Sell IndicatorThe "Multi-Divergence Buy/Sell Indicator" is a technical analysis tool that combines multiple divergence signals from different indicators to identify potential buy and sell opportunities in the market. Here's a breakdown of how the indicator works and how to use it:
Input Parameters:
RSI Length: Specifies the length of the RSI (Relative Strength Index) calculation.
MACD Short Length: Specifies the short-term length for the MACD (Moving Average Convergence Divergence) calculation.
MACD Long Length: Specifies the long-term length for the MACD calculation.
MACD Signal Smoothing: Specifies the smoothing length for the MACD signal line calculation.
Stochastic Length: Specifies the length of the Stochastic oscillator calculation.
Stochastic Overbought Level: Defines the overbought level for the Stochastic oscillator.
Stochastic Oversold Level: Defines the oversold level for the Stochastic oscillator.
Calculation of Indicators:
RSI: Calculates the RSI based on the specified RSI Length.
MACD: Calculates the MACD line, signal line, and histogram based on the specified MACD parameters.
Stochastic: Calculates the Stochastic oscillator based on the specified Stochastic parameters.
Divergence Detection:
RSI Divergence: Identifies a bullish divergence when the RSI crosses above its 14-period simple moving average (SMA).
MACD Divergence: Identifies a bullish divergence when the MACD line crosses above the signal line.
Stochastic Divergence: Identifies a bullish divergence when the Stochastic crosses above its 14-period SMA.
Buy and Sell Conditions:
Buy Condition: Triggers a buy signal when all three divergences (RSI, MACD, and Stochastic) occur simultaneously.
Sell Condition: Triggers a sell signal when both RSI and MACD divergences occur, but Stochastic divergence does not occur.
Plotting Buy/Sell Signals:
The indicator plots green "Buy" labels below the price bars when the buy condition is met.
It plots red "Sell" labels above the price bars when the sell condition is met.
Usage:
The indicator can be used on any timeframe and for any trading instrument.
Look for areas where all three divergences (RSI, MACD, and Stochastic) align to generate stronger buy and sell signals.
Consider additional technical analysis and risk management strategies to validate the signals and manage your trades effectively.
Remember, no indicator guarantees profitable trades, so it's essential to use this indicator in conjunction with other tools and perform thorough analysis before making trading decisions.
Feel free to ask any questions

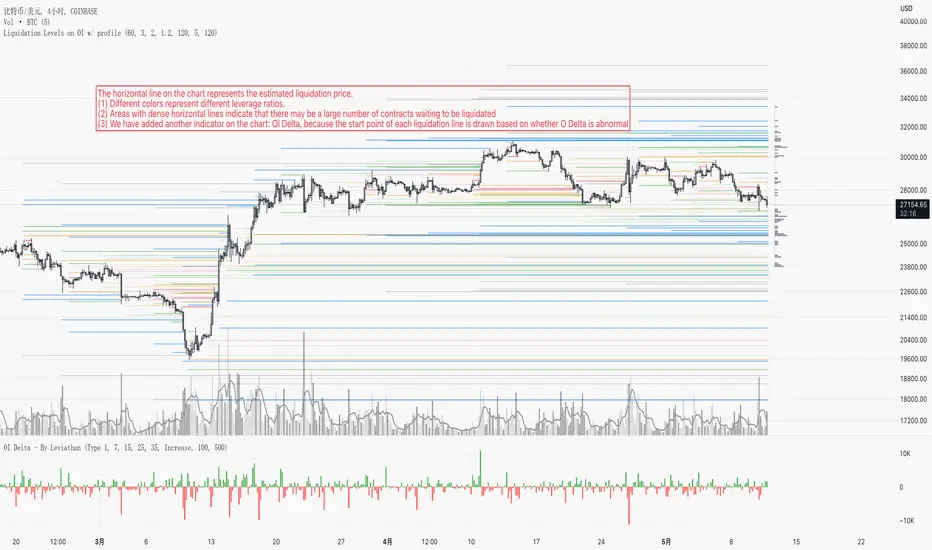
Liquidation Levels on OIThis indicator is used to display estimated contract liquidation prices. When there are dense liquidation areas on the chart, it indicates that there may be a lot of liquidity at that price level. The horizontal lines of different colors on the chart represent different leverage ratios. See below for details.
Let me introduce the principle behind this indicator:
1. When position trading volume increases or decreases significantly higher than usual levels in a specific candlestick chart, it indicates that a large number of contracts were opened during that period. We use the 60-day moving average change as a benchmark line. If the position trading volume changes more than 1.2x, 2x or 3x its MA60 value, it is considered small, medium or large abnormal increase or decrease.
2. This indicator takes an approximate average between high, open, low and close prices of that candlestick as opening price.
3. Since contracts involve liquidity provided by both buyers and sellers with equal amounts of long and short positions corresponding to each contract respectively; since we cannot determine actual settlement prices for contract positions; therefore this indicator estimates settlement prices instead which marks five times (5x), ten times (10x), twenty-five times (25x), fifty times (50x) and one hundred times (100x) long/short settlement prices corresponding to each candlestick chart generating liquidation lines with different colors representing different leverage levels.
4. We can view areas where dense liquidation lines appear as potential liquidation zones which will have high liquidity.
5. We can adjust orders based on predicted liquidation areas because most patterns in these areas will be quickly broken.
6. We provide a density histogram to display the liquidation density of each price range.
Special thanks to the following TradingView community members for providing open-source indicators and contributing to the development of this indicator!
Liquidation - @Mysterysauce
Open Interest Delta - By Leviathan - @LeviathanCapital
Regarding the relationship with the above-mentioned open source indicators:
1. Indicator Liquidation - @Mysterysauce can also draw a liquidation line in the chart, but:
(1) Our indicator generates a liquidation line based on abnormal changes in open interest; their indicator generates a liquidation line based on trading volume.
(2) Our indicator will generate both long and short liquidation lines at the same time; their indicator will only generate a liquidation line in a single direction.
We refer to their method of drawing liquidation lines when drawing our own.
2. Indicator Open Interest Delta - By Leviathan - @LeviathanCapital obtained OI data for Binance USDT perpetual contracts in the code. We refer to their method of obtaining OI data in our code.
============= 中文版本 =============
此指标用于显示估计合约清算价格。当图表上有密集的清算区域时,表示该价格水平可能存在大量流动性。图表上不同颜色的水平线代表不同杠杆比率。详情请参见下面的说明。
让我介绍一下这个指标背后的原理:
1. 当特定蜡烛图对应的合约仓位增加量(OI Delta)显著高于通常水平时,表示在那段时间有大量合约开仓。我们使用OI Delta的60日移动均线作为基准线。如果OI Delta超过其MA60值的1.2倍、2倍或3倍,则认为是小型、中型或大型的异常OI Delta。
2. 该指标将上述蜡烛图高、开、低和收盘价的平均值作为近似的合约开仓价。
3. 由于合约涉及买方和卖方之间相互提供流动性,每个合约对应相等数量的多头和空头头寸。由于我们无法确定合约头寸的实际清算价格,因此该指标估计了清算价格。它标记了与该蜡烛图相对应的多头和空头5倍、10倍、25倍、50倍和100倍的清算价格,生成清算线。不同杠杆水平用不同颜色表示。
4. 我们可以将出现密集清算线的区域视为潜在的清算区域。这些区域将具有高流动性。
5. 我们可以根据预测到的清算区域调整自己的订单,因为根据规律,这些清算区域大部分都会很快被击穿。
6. 我们提供了密度直方图来显示每个价格范围的清算密度
特别感谢以下TradingView社区成员提供开源指标并为该指标的开发做出贡献!
Liquidation - @Mysterysauce
Open Interest Delta - By Leviathan - @LeviathanCapital
与上述开源指标的关系:
1. 指标Liquidation - @Mysterysauce也可以在图中绘制清算线,但是:
(1)我们的指标是基于open interest的异常变化生成的清算线;他们的指标是基于成交量生成的清算线
(2)我们的指标会同时生成多头和空头清算线;他们的指标仅会在单一方向生成清算线
我们的指标在绘制清算线上参考了他们绘制清算线的方式
2. 指标Open Interest Delta - By Leviathan - @LeviathanCapital在代码中获取了Binance USDT永续合约的OI数据。我们在代码中参考他们获取OI数据的方式