Zero Lag Exponential Moving Average ForLoop [InvestorUnknown]Overview
The Zero Lag Exponential Moving Average (ZLEMA) ForLoop indicator is designed for traders seeking a responsive and adaptive tool to identify trend changes. By leveraging a range of lengths and different moving average (MA) types, this indicator helps smooth out price data and provides timely signals for market entry and exit.
User Inputs
Start and End Lengths: Define the range of lengths over which the IIRF values are calculated.
Moving Average Type: Choose from EMA, SMA, WMA, VWMA, or TMA for trend smoothing.
Moving Average Length: Specify the length for the chosen MA type.
Calculation Source: Select the price data used for calculations.
Signal Calculation
Signal Mode (sigmode): Determines the type of signal generated by the indicator. Options are "Fast", "Slow", "Thresholds Crossing", and "Fast Threshold".
1. Slow: is a simple crossing of the midline (0).
2. Fast: positive signal depends if the current MA > MA or MA is above 0.99, negative signals comes if MA < MA or MA is below -0.99.
3. Thresholds Crossing: simple ta.crossover and ta.crossunder of the user defined threshold for Long and Short.
4. Fast Threshold: signal changes if the value of MA changes by more than user defined threshold against the current signal
col1 = MA > 0 ? colup : coldn
var color col2 = na
if MA > MA or MA > 0.99
col2 := colup
if MA < MA or MA < -0.99
col2 := coldn
var color col3 = na
if ta.crossover(MA,longth)
col3 := colup
if ta.crossunder(MA,shortth)
col3 := coldn
var color col4 = na
if (MA > MA + fastth)
col4 := colup
if (MA < MA - fastth)
col4 := coldn
color col = switch sigmode
"Slow" => col1
"Fast" => col2
"Thresholds Crossing" => col3
"Fast Threshold" => col4
Visualization Settings
Bull Color (colup): The color used to indicate bullish signals.
Bear Color (coldn): The color used to indicate bearish signals.
Color Bars (barcol): Option to color the bars based on the signal.
Custom function
// Function to calculate an array of ZLEMA values over a range of lengths
ZLEMAForLoop(a, b, c, s) =>
// Initialize an array to hold ZLEMA trend values
var Array = array.new_float(b - a + 1, 0.0)
// Loop through the range from 'a' to 'b'
for x = 0 to (b - a)
// Calculate the current length
len = a + x
// Calculate the lag based on the length
lag = math.floor((len - 1) / 2)
// Calculate the smoothing factor alpha
alpha = 2 / (len + 1)
// Initialize the ZLEMA variable
zlema = 0.0
// Compute the ZLEMA value
zlema := na(zlema ) ? (s + s - s ) : alpha * (s + s - s ) + (1 - alpha) * nz(zlema )
// Determine the trend based on ZLEMA value
trend = zlema > zlema ? 1 : -1
// Store the trend in the array
array.set(Array, x, trend)
// Calculate the average of the trend values
Avg = array.avg(Array)
// Apply the selected moving average type to the average trend value
float MA = switch maType
"EMA" => ta.ema(Avg, c) // Exponential Moving Average
"SMA" => ta.sma(Avg, c) // Simple Moving Average
"WMA" => ta.wma(Avg, c) // Weighted Moving Average
"VWMA" => ta.vwma(Avg, c) // Volume-Weighted Moving Average
"TMA" => ta.trima(Avg, c) // Triangular Moving Average
=>
runtime.error("No matching MA type found.") // Error handling for unsupported MA type
float(na)
// Return the array of trends, the average trend, and the moving average
Important Considerations
Speed vs. Stability: The ZLEMA ForLoop is designed for fast response times, making it ideal for short-term trading strategies. However, its sensitivity also means it may generate more signals, some of which could be false positives.
Use with Other Indicators: To improve the reliability of the signals, it is recommended to use the ZLEMA ForLoop in conjunction with other technical indicators.
Customization: Tailor the settings to match your trading style and risk tolerance. Adjusting the lengths, MA type, and thresholds can significantly impact the indicator's performance.
Conclusion
The ZLEMA ForLoop indicator offers a flexible tool for traders looking to capture trend changes quickly. By providing multiple modes and customization options, it allows traders to fine-tune their analysis and make informed decisions. For best results, use this indicator alongside other analytical tools to confirm signals and avoid potential false entries.
"indicators" için komut dosyalarını ara

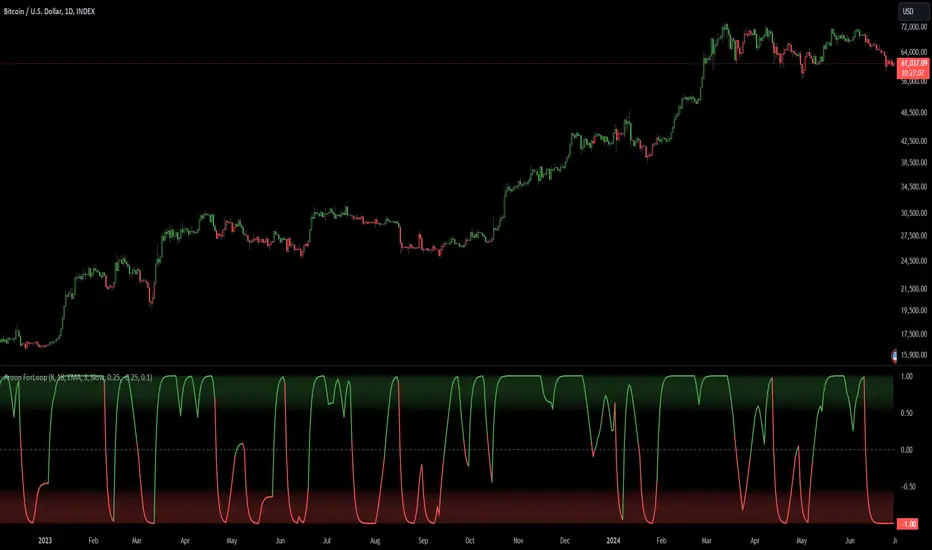
Aroon ForLoop [InvestorUnknown]Overview
The Aroon ForLoop indicator is designed to calculate an array of Aroon values over a range of lengths, providing trend signals based on various moving averages. It offers flexibility with different signal modes and visual customizations.
User Input
Start Length (a) and End Length (b): Defines the range for calculating Aroon values.
MA Type (maType) and MA Length (c): Selects the moving average type (EMA, SMA, WMA, VWMA, TMA) and its length.
Calculation Source (s): Specifies the data source for calculations.
Signal Mode (sigmode): Offers options like Fast, Slow, Thresholds Crossing, and Fast Threshold to generate signals.
Thresholds: Configures long and short thresholds for signal generation.
Visualization Options: Customizes bull and bear colors, and enables/disables bar coloring.
Alert Settings: Chooses whether to wait for bar close for alert confirmation.
Signal Calculation
Signal Mode (sigmode): Determines the type of signal generated by the indicator. Options are "Fast", "Slow", "Thresholds Crossing", and "Fast Threshold".
1. Slow: is a simple crossing of the midline (0).
2. Fast: positive signal depends if the current MA > MA or MA is above 0.99, negative signals comes if MA < MA or MA is below -0.99.
3. Thresholds Crossing: simple ta.crossover and ta.crossunder of the user defined threshold for Long and Short.
4. Fast Threshold: signal changes if the value of Aroon MA changes by more than user defined threshold against the current signal
col1 = MA > 0 ? colup : coldn
var color col2 = na
if MA > MA or MA > 0.99
col2 := colup
if MA < MA or MA < -0.99
col2 := coldn
var color col3 = na
if ta.crossover(MA,longth)
col3 := colup
if ta.crossunder(MA,shortth)
col3 := coldn
var color col4 = na
if (MA > MA + fastth)
col4 := colup
if (MA < MA - fastth)
col4 := coldn
color col = na
if sigmode == "Slow"
col := col1
if sigmode == "Fast"
col := col2
if sigmode == "Thresholds Crossing"
col := col3
if sigmode == "Fast Threshold"
col := col4
else
na
Visualization Settings
Bull Color (colup): The color used to indicate bullish signals.
Bear Color (coldn): The color used to indicate bearish signals.
Color Bars (barcol): Option to color the bars based on the signal.
Custom Function
AroonForLoop: Calculates Aroon values over the specified range, determines the trend, and averages the results using the chosen moving average type.
AroonForLoop(a, b, c) =>
var SignalArray = array.new_float(b - a + 1, 0.0)
for x = 0 to (b - a)
len = a + x
upper = 100 * (ta.highestbars(high, len + 1) + len)/len
lower = 100 * (ta.lowestbars(low, len + 1) + len)/len
trend = upper > lower ? 1 : -1
array.set(SignalArray, x, trend)
Avg = array.avg(SignalArray)
float MA = switch maType
"EMA" => ta.ema(Avg, c)
"SMA" => ta.sma(Avg, c)
"WMA" => ta.wma(Avg, c)
"VWMA" => ta.vwma(Avg, c)
"TMA" => ta.trima(Avg, c)
=>
runtime.error("No matching MA type found.")
float(na)
Important Considerations
Fast Responses: The Aroon ForLoop indicator is designed for quick identification of trend changes, making it ideal for fast-paced trading environments.
Moving Average Types: Supports various MA types (EMA, SMA, WMA, VWMA, TMA) for adaptable smoothing of trend signals.
Combination with Other Indicators: For more reliable signals, use this indicator in conjunction with other technical indicators.
BBTrend w SuperTrend decision - Strategy [presentTrading]This strategy aims to improve upon the performance of Traidngview's newly published "BB Trend" indicator by incorporating the SuperTrend for better trade execution and risk management. Enjoy :)
█Introduction and How it is Different
The "BBTrend w SuperTrend decision - Strategy " is a trading strategy designed to identify market trends using Bollinger Bands and SuperTrend indicators. What sets this strategy apart is its use of two Bollinger Bands with different lengths to capture both short-term and long-term market trends, providing a more comprehensive view of market dynamics. Additionally, the strategy includes customizable take profit (TP) and stop loss (SL) settings, allowing traders to tailor their risk management according to their preferences.
BTCUSD 4h Long Performance
█ Strategy, How It Works: Detailed Explanation
The BBTrend strategy employs two key indicators: Bollinger Bands and SuperTrend.
🔶 Bollinger Bands Calculation:
- Short Bollinger Bands**: Calculated using a shorter period (default 20).
- Long Bollinger Bands**: Calculated using a longer period (default 50).
- Bollinger Bands use the standard deviation of price data to create upper and lower bands around a moving average.
Upper Band = Middle Band + (k * Standard Deviation)
Lower Band = Middle Band - (k * Standard Deviation)
🔶 BBTrend Indicator:
- The BBTrend indicator is derived from the absolute differences between the short and long Bollinger Bands' lower and upper values.
BBTrend = (|Short Lower - Long Lower| - |Short Upper - Long Upper|) / Short Middle * 100
🔶 SuperTrend Indicator:
- The SuperTrend indicator is calculated using the average true range (ATR) and a multiplier. It helps identify the market trend direction by plotting levels above and below the price, which act as dynamic support and resistance levels. * @EliCobra makes the SuperTrend Toolkit. He is GOAT.
SuperTrend Upper = HL2 + (Factor * ATR)
SuperTrend Lower = HL2 - (Factor * ATR)
The strategy determines market trends by checking if the close price is above or below the SuperTrend values:
- Uptrend: Close price is above the SuperTrend lower band.
- Downtrend: Close price is below the SuperTrend upper band.
Short: 10 Long: 20 std 2
Short: 20 Long: 40 std 2
Short: 20 Long: 40 std 4
█ Trade Direction
The strategy allows traders to choose their trading direction:
- Long: Enter long positions only.
- Short: Enter short positions only.
- Both: Enter both long and short positions based on market conditions.
█ Usage
To use the "BBTrend - Strategy " effectively:
1. Configure Inputs: Adjust the Bollinger Bands lengths, standard deviation multiplier, and SuperTrend settings.
2. Set TPSL Conditions: Choose the take profit and stop loss percentages to manage risk.
3. Choose Trade Direction: Decide whether to trade long, short, or both directions.
4. Apply Strategy: Apply the strategy to your chart and monitor the signals for potential trades.
█ Default Settings
The default settings are designed to provide a balance between sensitivity and stability:
- Short BB Length (20): Captures short-term market trends.
- Long BB Length (50): Captures long-term market trends.
- StdDev (2.0): Determines the width of the Bollinger Bands.
- SuperTrend Length (10): Period for calculating the ATR.
- SuperTrend Factor (12): Multiplier for the ATR to adjust the SuperTrend sensitivity.
- Take Profit (30%): Sets the level at which profits are taken.
- Stop Loss (20%): Sets the level at which losses are cut to manage risk.
Effect on Performance
- Short BB Length: A shorter length makes the strategy more responsive to recent price changes but can generate more false signals.
- Long BB Length: A longer length provides smoother trend signals but may be slower to react to price changes.
- StdDev: Higher values create wider bands, reducing the frequency of signals but increasing their reliability.
- SuperTrend Length and Factor: Shorter lengths and higher factors make the SuperTrend more sensitive, providing quicker signals but potentially more noise.
- Take Profit and Stop Loss: Adjusting these levels affects the risk-reward ratio. Higher take profit percentages can increase gains but may result in fewer closed trades, while higher stop loss percentages can decrease the likelihood of being stopped out but increase potential losses.

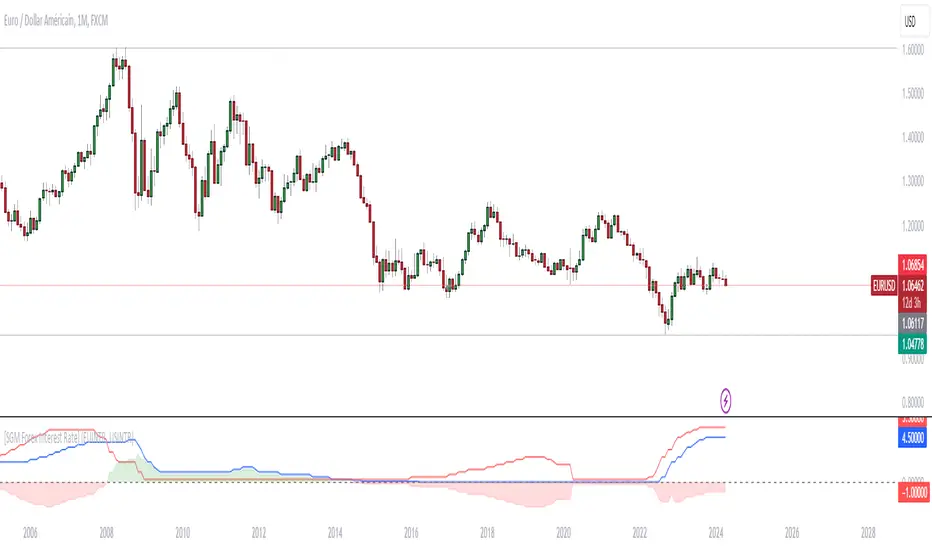
[SGM Forex Interest Rate]
Through an analysis of the interest rates of selected currencies, this indicator calculates the difference between these rates to provide an indication of the relative strength between the two currencies. This relative strength is graphically represented as an area with a specific color for better visualization.
The curves represent the values of the two selected currencies, while the colored area between them highlights the difference in strength. A horizontal line is also drawn at the zero level to help identify turning points or divergence points.
Interest rates play a crucial role in forex trading for several reasons:
Impact on capital flows: Interest rates affect international capital flows. Investors are attracted to currencies offering higher yields, which can lead to currency appreciation with higher interest rates.
Influence on monetary policy decisions: Central banks often adjust interest rates to achieve macroeconomic goals such as price stability, economic growth, and full employment. Announcements of interest rate changes or hints about the future direction of rates can have a significant impact on the foreign exchange market.
Determination of financing costs: Interest rates affect the financing costs of transactions in the foreign exchange market. Traders often borrow low-interest currencies to purchase higher-yielding currencies, which can lead to large movements in the market.
Economic Indicators: Interest rates are also key economic indicators. Changes in interest rates may reflect overall economic conditions and be interpreted as signs of economic growth or contraction.
Risk and volatility factors: Interest rate differences between two countries can create arbitrage opportunities, but also risks. Unexpected changes in interest rates or market expectations may result in increased volatility in the foreign exchange market.
In sum, interest rates are a fundamental part of the global financial landscape and are therefore crucial for forex traders, as they provide indications of economic trends, capital flows and trading opportunities.
COT CFTC Title: Enhanced COT CFTC Analysis Tool
Description:
Introducing the 'Enhanced COT CFTC Analysis Tool', meticulously designed to dissect the CFTC's Commitments of Traders (COT) data. This sophisticated tool aims to equip traders and investors with profound insights into market dynamics, utilizing the positions of Large Speculators, Commercials, and Non-Reportable Positions for a comprehensive market overview.
Key Features:
Large Speculators Analysis: Visualizes the net positions of large speculators, offering insights into speculative market sentiments.
Commercials Insights: Provides a deep dive into the trading activities of commercials, known for their strategic hedging practices.
Non-Reportable Positions Tracking: Displays the activities of smaller speculators, often considered as contrarian indicators.
Additional Plots:
Options Share: Allows selection between the proportion of options in the market.
Net, Short, and Long Positions: Offers options to view net, short, and long positions.
Percentage of Net Short and Long Positions: Displays the percentage of net short and long positions, either as raw data or as an index over a specified time period.
Extreme Value Indicators: Highlights extreme values in the market data, providing critical insights into market peaks and troughs.
This tool features an intuitive display with color-coded lines and charts, simplifying the complex data analysis process. It also includes an innovative 5% detector, highlighting extreme market positions for enhanced market understanding.
Spread Analysis: This feature provides an insightful visualization of the spread between various COT data points, enabling users to gauge the market’s depth and liquidity effectively.
Usage Tips:
Utilize divergence analysis between different groups to identify potential trend reversals.
Keep a close eye on the 5% detector for early indications of market overextensions.
The 'Enhanced COT CFTC Analysis Tool' is a vital addition to your trading arsenal, designed to enrich your trading strategy with precise and actionable market insights. It’s not just an indicator; it’s a comprehensive market analysis suite.
Disclaimer: This indicator is for educational purposes only. Trading decisions should always be approached with caution and based on thorough personal analysis.

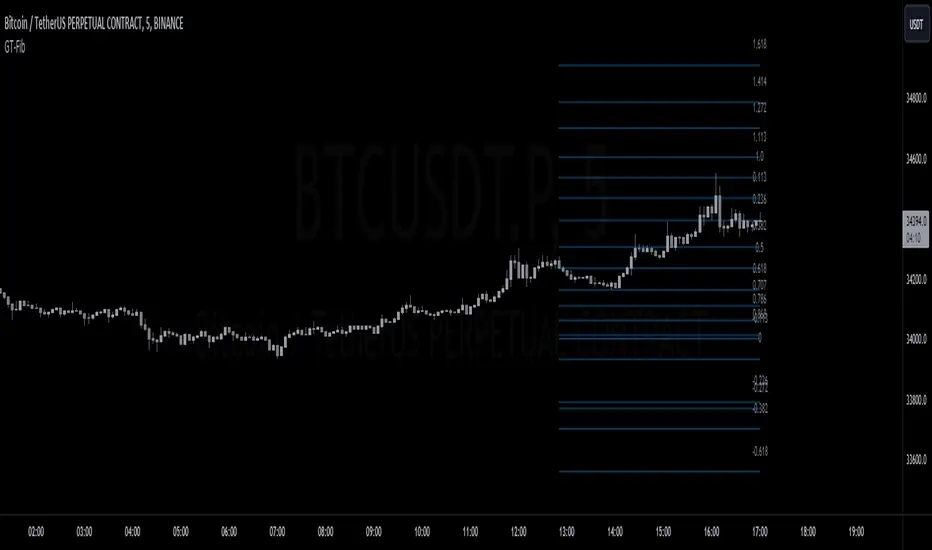
GT-FibThis code is declaring the script as an indicator named "GT-Fib" to be plotted on the main chart. The maximum number of lines it can create is limited to 500.
The indicator calculates Fibo using trend breaks. If the trend is not broken and the old trend continues, Fibo continues. However, sometimes you will witness that it does not draw Fibo. Indicates that there is no trend break yet. If current Fibo levels are behind us, it may be wise to wait for a trend change. For trend breaks, I partially benefited from the Lux team's trend lines with break indicator. For your information...
Settings:
A set of user inputs is defined to allow customization. These include lookback period, coefficient, calculation method, and an option to enable/disable backpainting. These inputs help the trader to adapt the script to different market conditions or trading strategies.
Style:
Colors and visual styles for the indicator are defined here, such as the colors for uptrends and downtrends.
Variables Initialization:
Various variables are initialized here. This section prepares the script for further calculations. Key concepts include the initialization of upper and lower boundaries, pivot highs (ph), pivot lows (pl), and a few other variables to track peaks and troughs for trendlines.
Trendline Peaks and Troughs:
The script identifies pivot highs and lows. Whenever a pivot high/low is found, it updates the trendline_top and trendline_bottom respectively.
Calculation Method:
Based on the user's choice, the script calculates a "cycle" value using one of three methods: ATR, Stdev, or Linreg.
Extended Lines:
These are dashed lines that get drawn when a pivot high or pivot low is identified. These lines can be used to visualize potential support or resistance areas.
plotFibRetracement Function:
This function is designed to draw Fibonacci retracement levels between the identified trendline top and bottom. The Fibonacci levels provide potential support and resistance levels that traders often use to make trading decisions.
Plotting Fibonacci using Trendline Peaks and Troughs:
If both trendline_top and trendline_bottom are not 'na' (not available), the script will draw the Fibonacci retracement using the defined function.
How to Use:
The script identifies and displays potential support and resistance zones using Fibonacci retracement levels based on the trendline peaks and troughs. Here's a suggested way to use it:
Adjust Settings: Depending on the instrument you're trading and the timeframe, you might want to adjust the lookback period, coefficient, and calculation method to fine-tune the script to your needs.
Identify Trends: Observe where the pivot highs and lows are formed. The presence of consecutive pivot highs or pivot lows can indicate a prevailing trend.
Use Fibonacci Levels: The Fibonacci retracement levels can act as potential support and resistance. For instance:
During an uptrend, if prices retract and approach a Fibonacci level, it might act as a support level where price could bounce back.
During a downtrend, Fibonacci levels might act as resistance where price could reverse downwards.
Combine with Other Indicators: For a more comprehensive analysis and to increase the reliability of trading signals, you can use this script in conjunction with other technical indicators.
Remember, like all trading tools and techniques, this script should be used in conjunction with proper risk management. It's also a good idea to test any strategy or tool in a demo environment before applying it to a live account.
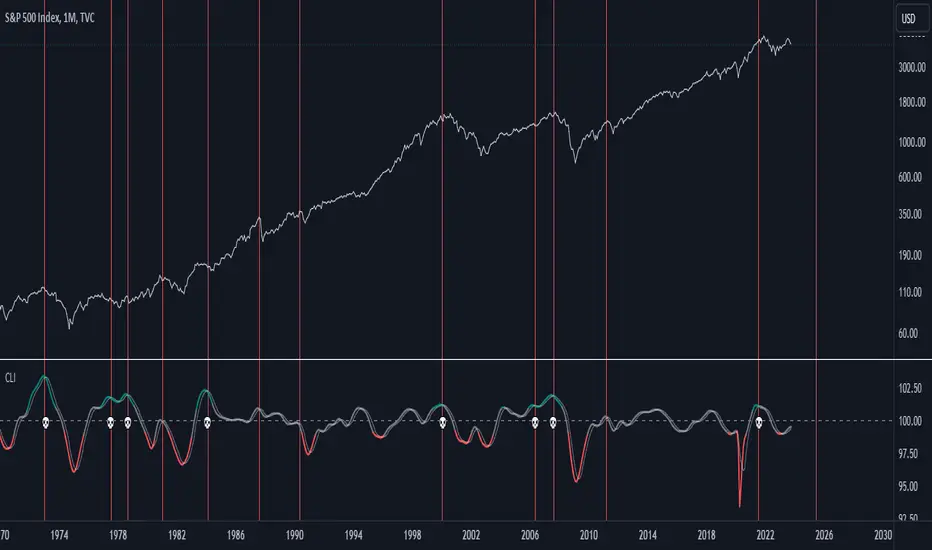
US Composite Leading Indicator (CLI)The US Composite Leading Indicator (CLI), normalized for the United States, closely mirrors the Conference Board "Leading Economic Index" (LEI). It offers unique insights into economic and financial dynamics.
The Composite Leading Indicator (CLI) is an economic tool designed to anticipate economic developments. It is created by aggregating and normalizing a wide range of economic and financial data from various sources.
The normalized data is then aggregated, and a composite indicator is calculated by taking a weighted average of individual indicators.
The CLI is used to provide early insights into the state of the economy and to anticipate future economic trends. It is particularly valuable for predicting economic downturns, including recessions.
The CLI is an essential tool for economists, governments, businesses, and investors seeking to understand economic trends and make informed decisions.
Key Features:
1. Early Warning: Just like its counterpart, the CLI indicator excels at offering early warnings about significant economic events, particularly economic crises. This makes it an indispensable asset for analysts and investors.
2. Recession Indicators: The moving average serves as an early warning system for potential economic recessions. When it crosses the indicator line from the bottom to the top while surpassing a predefined threshold (e.g., 101), it signals a potential crisis.
3. Market Impact: The CLI indicator provides valuable insights into the performance of financial markets, offering cues about indices such as the S&P 500, Nasdaq, Dow Jones, and more.
Why It Matters:
Understanding the US Composite Leading Indicator (CLI) indicator, normalized for the United States, is crucial for anticipating economic shifts and preparing for changes in financial markets. By analyzing a diverse array of economic factors, it provides a holistic view of economic well-being. Whether you're an investor or economist, this indicator can be an invaluable resource for staying informed about market trends and major economic developments.
Source:
www.data.oecd.org
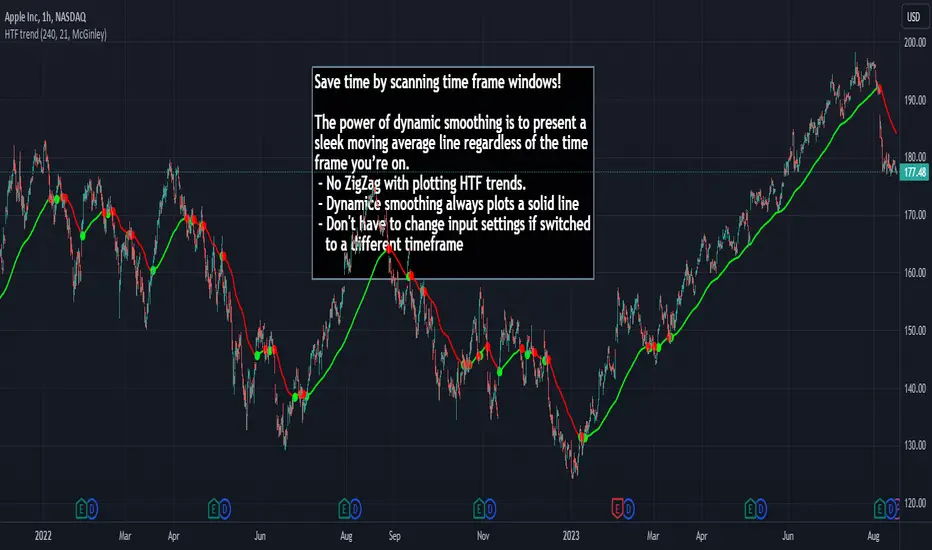
HTF Trend Filter - Dynamic SmoothingSummary of the HTF Trend Filter
The Higher Time Frame (HTF) Trend Filter is a cutting-edge tool crafted for traders who want to scan moving average trend lines time efficiently. At its core, it harnesses the power of dynamic smoothing to present a sleek moving average line regardless of the time frame you’re on. Here's a glimpse of the advantages you unlock with the HTF trend filter:
Dynamic Smoother: Ever been irked by jagged lines on your chart? With the dynamic smoother, those days are gone. The smoother streamlines HTF moving average line on your current lower time frame chart.
Time Efficiency: Time is of the essence in trading. With this tool, you can nimbly toggle between time charts without the hassle of readjusting input parameters, ensuring your screening process remains unhindered.
Features of the Script
Variety of Moving Averages: The script caters to different trading styles by offering a plethora of moving average types, ranging from the classic SMA and EMA to the innovative Hull and McGinley Dynamic MAs.
Dynamic Smoothing: This is the script's pièce de résistance. The dynamic smoothing factor is ingeniously derived by taking the ratio of minutes of the higher time frame to the current time frame. This ensures the moving average remains fluid and consistent across different time frames, eliminating the common pitfalls of jagged moving averages.
Reversal Indicators: It includes a reversal indicator. Green circles pinpoint the start of a potential uptrend, while red ones signify a potential downtrend.
Customizable Alerts: To ensure you never miss a beat, the script is equipped with customizable alert conditions.
Trading Idea
The essence of trading lies in confirming assumptions and validating trends. The HTF Trend Dynamic Smoother positions itself as a potential game-changer in this domain. One could consider using the HTF trend dynamic smoother as a supplementary confirmation tool alongside other primary indicators. For instance, if you're plotting a moving average on a lower time frame, toggling the HTF smoother can offer a broader perspective of the trend from a higher time frame. By ensuring alignment between these perspectives, you could potentially trade with increased confidence, reinforcing your lower time frame strategies with higher time frame confirmations. It's worth noting, however, that while this method can offer additional layers of information and validation, it doesn't replace due diligence. Every trade decision should be the culmination of thorough analysis, and no tool should be solely relied upon for decision-making.
Limitations
While the HTF Trend Filter is an exceptional tool, like all tools, it has its constraints. Lower Time Frame Dependency: For the indicator to function optimally, it's paramount to ensure that the time frame open is always lower (or equal) than the one selected in the input parameters. This limitation is crucial to remember as the dynamic smoother's accuracy hinges on this condition.
In conclusion, the HTF Trend Filter - Dynamic Smoothing is a remarkable blend of innovation and efficiency, tailored for traders who demand fast screening of higher time frame MA trends. Due to it simplistic design it gives a user-friendly experience. However, always remember the golden rule of trading: utilize tools as part of a comprehensive strategy, never in isolation.
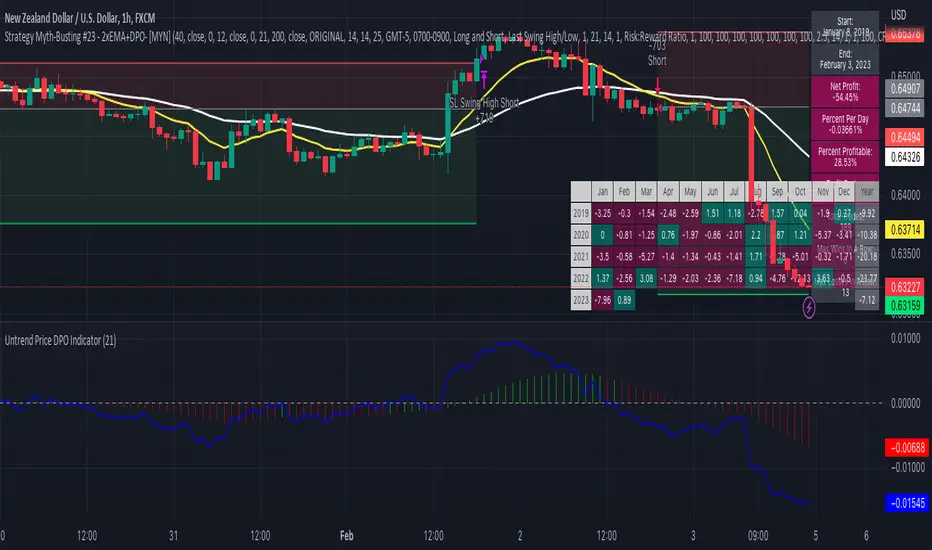
Strategy Myth-Busting #23 - 2xEMA+DPO- [MYN]#23 on the Myth-Busting bench, we are automating the "Best Funded Account Trading Strategy (Pass EVERY Challenge!)" strategy from "Trade with Pat" who claims this strategy will pass every trading challenge out there.
This strategy uses 3 open source indicators. 2 EMA's. The first one (Slow) is set to a length of 40 and a fast EMA which is set to 12. This strategy uses the crossover of the fast( 12) EMA over the Slow EMA ( 40 ) as the primary means to enter a long position. The opposite when the fast EMA crosses under the slow EMA as a means to indicate a short position. This strategy uses the DPO (Detrended Price Oscillaor) from the Uptrend Price DPO indicator in the same way we would traditionally use a stochastic or moving average convergence/divergence indicator like the MACD . Basically, the DPO helps evaluate and estimate the length of the price cycle from peak to peek or through to trough and in this strategy confirms entry of a long / short condition complimenting the EMA crossover/crossunders.
And as always, If you know of or have a strategy you want to see myth-busted or just have an idea for one, please feel free to message me.
This strategy uses a combination of 2 open-source public indicators:
EMA x2 ( 40 and 12)
Untrend Price DPO indicator by jTradeuh
Trading Rules
1 or 4 hour candles
Stop loss at previous highest-high (Short) and lowest-low (Long).
Take Profit 2 - 2.5 the risk
Strategy Template includes open source code from the following:
Performance Summary Dashboard by @VertMT
Time Of Day Window by @ddctv
Monthly Table Performance Dashboard by @QuantNomad
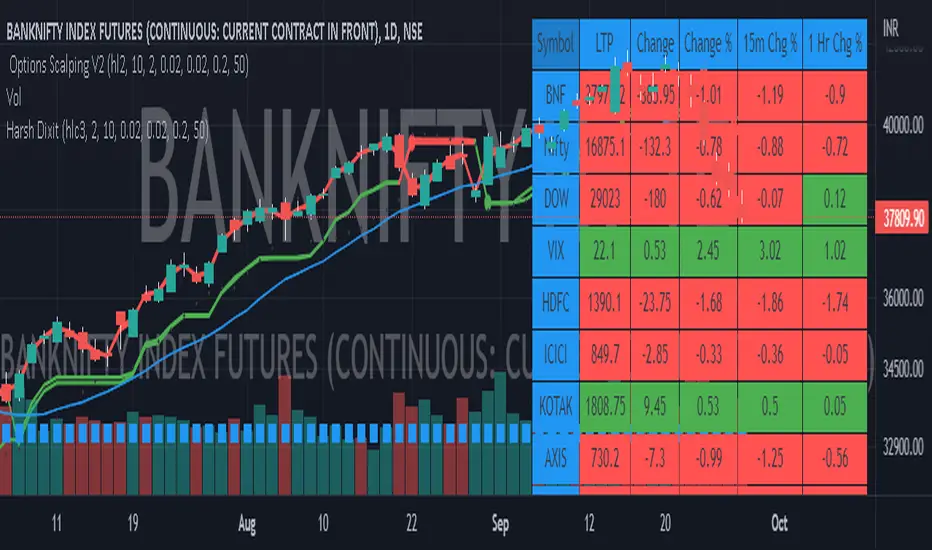
Options Scalping by harsh gbychi this is my script.
Bank Nifty Live OI Change Chart can give very useful clues for intraday support and resistance levels for Bank Nifty. If there is more addition in Open Interest at 12200 Calls, that would mean most market players are comfortable writing call options at this level because they believe it to be a strong resistance. That would be bearish indication for BankNifty.
Similarly is there is highest writing in 12000 Puts that would indicate strong intraday support at that level.
Third Scenario: There is good amount of Open Interest increase in 12000 PE and 12200 CE –> this means we should expect a range bound session for the day, as both bears and bulls are comfortable holding the 12200 and 12000 levels respectively.
Following factors could improve reliability of BankNifty OI Change analysis:
1) Put Call Ratio: Higher PCR means bullishness. If there is more writing at 12000PE and PCR is high and increasing during the day that would add to bullish scenario
If the PCR is declining for the day and more writing happening at 12200CE then this adds to bearishness.
2) Close to expiry: The closer to expiry we are, the more reliable the ‘Open Interest’ analysis. Early in the series, the OI analysis is less reliable.
3) More Players: As the number of players increase, the OI analysis become more reliable.
4) Bid-ask Spread: The lower the bid-ask spread the more reliable the OI analysis.
5) Technical Indicators: The best trades are found by combining OI analysis with other technical indicators. MACD, RSI, Channel lines and EW count give best results with Open Interest Analysis.
Combo 4+ KDJ STO RSI EMA3 Visual Trend Pine V5@RL! English !
Combo 4+ KDJ STO RSI EMA3 Visual Trend Pine V5 @ RL
Combo 4+ KDJ STO RSI EMA3 Visual Trend Pine V5 @ RL is a visual trend following indicator that groups and combines four trend following indicators. It is compiled in PINE Script Version V5 language.
• STOCH: Stochastic oscillator.
• RSI Divergence: Relative Strength Index Divergence. RSI Divergence is a difference between a fast and a slow RSI.
• KDJ: KDJ Indicator. (trend following indicator).
• EMA Triple: 3 exponential moving averages (Default display).
This indicator is intended to help beginners (and also the more experienced ones) to trade in the right direction of the market trend. It allows you to avoid the mistakes of always trading against the trend.
The calculation codes of the different indicators used are standard public codes used in the usual TradingView coding for these indicators.
The STO indicator calculation script is taken from TradingView's standard STOCH calculation.
The RSI indicator calculation script is a replica of the one created by @Shizaru.
The KDJ indicator calculation script is a replica of the one created by @iamaltcoin.
The Triple EMA indicator calculation script is a replica of the one created by @jwilcharts.
This indicator can be configured to your liking. It can even be used several times on the same graph (multi-instance), with different configurations or display of another indicator among the four that compose it, according to your needs or your tastes.
A single plot, among the 4 indicators that make it up, can be displayed at a time, but either with its own trend or with the trend of the 4 (3 by default) combined indicators (sell=green or buy=red, background color).
Trend indications (potential sell or buy areas) are displayed as a background color (bullish: green or bearish: red) when at least three of the four indicators (3 by default and configurable from 1 to 4) assume that the market is moving in the same direction. These trend indications can be configured and displayed, either only for the signal of the selected indicator and displayed, or for the signals of the four indicators together and combined (logical AND).
You can tune the input, style and visibility settings of each indicator to match your own preferences or habits.
A 'buy stop' or 'sell stop' signal is displayed (layouts) in the form of a colored square (green for 'stop buy' and red for 'stop sell'. These 'stop' signals can be configured and displayed, either only for the indicator chosen, or for the four indicators together and combined (logical OR).
Note that the presence of a Stop Long signal cancels the background color of the Long trend (green).
Likewise, the presence of a Stop Short signal cancels out the background color of the Short trend (red).
It is also made up of 3 labels:
• Trend Label
• signal Stop Label (signals Stop buy or sell )
• Info Label (Names of Long / Short / Stop Long / Stop Short indicators, and / Open / Close / High / Low ).
Each label is configurable (visibility and position on the graph).
• Trend label: indicates the number of indicators suggesting the same trend (Long or Short) as well as a strength index (PWR) of this trend: For example: 3 indicators in Short trend, 1 indicator in Long trend and 1 indicator in neutral trend will give: PWR SHORT = 2/4. (3 Short indicators - 1 Long indicator = 2 Pwr Short). And if PWR = 0 then the display is "Wait and See". It also indicates which current indicator is displayed and the display mode used (combined 1 to 4 indicators or not combined ).
• Signal Stop Label: Indicates a possible stop of the current trend.
• Label Info (Simple or Full) gives trend info for each of the 4 indicators and OHLC info for the chart (in “Full” mode).
It is possible to display this indicator several times on a chart (up to 3 indicators max with the Basic TradingView Plan and more with the paid plans), with different configurations: For example:
• 1-Stochastic - 2/4 Combined Signals - no Label displayed
• 1-RSI - Combined Signals 3/4 - Stop Label only displayed
• 1-KDJ - Combined Signals 4/4 - the 3 Labels displayed
• 1-EMA'3 - Non-combined signals (EMA only) - Trend Label displayed
Some indicators have filters / thresholds that can be configured according to your convenience and experience!
The choice of indicator colors is suitable for a graph with a "dark" theme, which you will probably need to modify for visual comfort, if you are using a "Light" mode or a custom mode.
This script is an indicator that you can run on standard chart types. It also works on non-standard chart types but the results will be skewed and different.
Non-standard charts are:
• Heikin Ashi (HA)
• Renko
• Kagi
• Point & Figure
• Range
As a reminder: No indicator is capable of providing accurate signals 100% of the time. Every now and then, even the best will fail, leaving you with a losing deal. Whichever indicator you base yourself on, remember to follow the basic rules of risk management and capital allocation.
BINANCE:BTCUSDT
**********************************************************************************************************************************************************************************************************************************************************************************
! Français !
Combo 4+ KDJ STO RSI EMA3 Visual Trend Pine V5@RL
Combo 4+ KDJ STO RSI EMA3 Visual Trend Pine V5@RL est un indicateur visuel de suivi de tendance qui regroupe et combine quatre indicateurs de suivi de tendance. Il est compilé en langage PINE Script Version V5.
• STOCH : Stochastique.
• RSI Divergence : Relative Strength Index Divergence. La Divergence RSI est une différence entre un RSI rapide et un RSI lent.
• KDJ : KDJ Indicateur. (indicateur de suivi de tendance).
• EMA Triple : 3 moyennes mobiles exponentielles (Affichage par défaut).
Cet indicateur est destiné à aider les débutants (et aussi les plus confirmé) à trader à dans le bon sens de la tendance du marché. Il permet d'éviter les erreurs qui consistent à toujours trader à contre tendance.
Les codes de calcul des différents indicateurs utilisés sont des codes publics standards utilisés dans le codage habituel de TradingView pour ces indicateurs !
Le script de calcul de l’indicateur STO est issu du calcul standard du STOCH de TradingView.
Le script de calcul de l’indicateur RSI Div est une réplique de celui créé par @Shizaru.
Le script de calcul de l’indicateur KDJ est une réplique de celui créé par @iamaltcoin.
Le script de calcul de l’indicateur Triple EMA est une réplique de celui créé par @jwilcharts
Cet indicateur peut être configuré à votre convenance. Il peut même être utilisé plusieurs fois sur le même graphique (multi-instance), avec des configurations différentes ou affichage d’un autre indicateur parmi les quatre qui le composent, selon vos besoins ou vos goûts.
Un seul tracé, parmi les 4 indicateurs qui le composent, peut être affiché à la fois mais, soit avec sa propre tendance soit avec la tendance des 4 (3 par défaut) indicateurs combinés (couleur de fond vente=vert ou achat=rouge).
Les indications de tendance (zones de vente ou d’achat potentielles) sont affichés sous la forme de couleur de fond (Haussier : vert ou baissier : rouge) lorsque au moins trois des quatre indicateurs (3 par défaut et configurable de 1 à 4) supposent que le marché évolue dans la même direction. Ces indications de tendance peuvent être configuré et affichés, soit uniquement pour le signal de l’indicateur choisi et affiché, soit pour les signaux des quatre indicateurs ensemble et combinés (ET logique).
Vous pouvez accorder les paramètres d’entrée, de style et de visibilité de chacun des indicateurs pour correspondre à vos propres préférences ou habitudes.
Un signal ‘stop achat’ ou ‘stop vente’ est affiché (layouts) sous la forme d’un carré de couleur (vert pour ‘stop achat’ et rouge pour ‘stop vente’. Ces signaux ‘stop’ peuvent être configuré et affichés, soit uniquement pour l’indicateur choisi, soit pour les quatre indicateurs ensemble et combinés (OU logique).
A noter que la présence d’un signal Stop Long annule la couleur de fond de la tendance Long (vert).
De même, la présence d’un signal Stop Short annule la couleur de fond de la tendance Short (rouge).
Il est aussi composé de 3 étiquettes (Labels) :
• Trend Label (infos de tendance)
• Signal Stop Label (signaux « Stop » achat ou vente)
• Infos Label (Noms des indicateurs Long/Short/Stop Long/Stop Short,
et /Open/Close/High/Low )
Chaque label est configurable (visibilité et position sur le graphique).
• Label Trend : indique le nombre d’indicateurs suggérant une même tendance (Long ou Short) ainsi qu’un indice de force (PWR) de cette tendance :
Par exemple : 3 indicateurs en tendance Short, 1 indicateur en tendance Long et 1 indicateur en tendance neutre donnera :
PWR SHORT = 2/4. (3 indicateurs Short – 1 indicateur Long=2 Pwr Short).
Et si PWR=0 alors l’affichage est « Wait and See » (Attendre et Observer).
Il indique aussi quel indicateur actuel est affiché et le mode d’affichage utilisé (combiné 1 à 4 indicateurs ou non combiné ).
• Signal Stop Label : Indique un possible arrêt de la tendance en cours.
• Infos Label (Simple ou complet) donne les infos de tendance de chacun des 4 indicateurs et les infos OHLC du graphique (en mode « Complet »).
Il est possible d’afficher ce même indicateur plusieurs fois sur un graphique (jusqu’à 3 indicateurs max avec le Plan Basic TradingView et plus avec les plans payants), avec des configurations différentes :
Par exemple :
• 1-Stochastique – Signaux Combinés 2/4 – aucun Label affiché
• 1-RSI – Signaux Combinés 3/4 – Label Stop uniquement affiché
• 1-KDJ – Signaux Combinés 4/4 – les 3 Labels affichés
• 1-EMA’3 - Signaux Non combinés (EMA seuls) – Trend Label affiché
Certains indicateurs ont des filtres/seuils (Thresholds) configurables selon votre convenance et votre expérience !
Le choix des couleurs de l’indicateur est adapté pour un graphique avec thème « sombre », qu’il vous faudra probablement modifier pour le confort visuel, si vous utilisez un mode « Clair » ou un mode personnalisé.
Ce script est un indicateur que vous pouvez exécuter sur des types de graphiques standard. Il fonctionne aussi sur des types de graphiques non-standard mais les résultats seront faussés et différents.
Les graphiques Non-standard sont :
• Heikin Ashi (HA)
• Renko
• Kagi
• Point & Figure
• Range
Pour rappel : Aucun indicateur n’est capable de fournir des signaux précis 100% du temps. De temps en temps, même les meilleurs échoueront, vous laissant avec une affaire perdante. Quel que soit l’indicateur sur lequel vous vous basez, n’oubliez pas de suivre les règles de base de gestion des risques et de répartition du capital.
BINANCE:BTCUSDT

MTF Technical Ratings [Anan]█ OVERVIEW
This indicator is a modified version of "Technical Ratings" v5.0 available in the public library to provide a quick overview of Technical Ratings in 6 optional timeframes.
█ FEATURES
- Multi-timeframe Table.
- Display Technical Ratings for "MAs" with a percentage.
- Display Technical Ratings for "Oscillators" with a percentage.
- Display Technical Ratings for "All" with a percentage.
- Full control of displaying any row(MAs / Oscillators / All) or any column(Multi-timeframe)
- Full control of Table position and size.
- Full control of displaying any row or column.
ORIGINAL DESCRIPTION ABOUT TECHNICAL RATING v1.0
█ OVERVIEW
This indicator calculates TradingView's well-known "Strong Buy", "Buy", "Neutral", "Sell" or "Strong Sell" states using the aggregate biases of 26 different technical indicators.
█ CALCULATIONS
The indicator calculates the aggregate value of two groups of indicators: moving averages and oscillators.
The "MAs" group is comprised of 15 different components:
• Six Simple Moving Averages of periods 10, 20, 30, 50, 100 and 200
• Six Exponential Moving Averages of the same periods
• A Hull Moving Average of period 9
• A Volume-weighed Moving Average of period 20
• Ichimoku
The "Oscillators" group includes 11 components:
• RSI
• Stochastic
• CCI
• ADX
• Awesome Oscillator
• Momentum
• MACD
• Stochastic RSI
• Wiliams %R
• Bull Bear Power
• Ultimate Oscillator
The state of each group's components is evaluated to a +1/0/-1 value corresponding to its bull/neutral/bear bias. The resulting value for each of the two groups are then averaged to produce the overall value for the indicator, which oscillates between +1 and -1. The complete conditions used in the calculations are documented in the Help Center.

Technical Ratings on Multi-frames / Assets█ OVERVIEW
This indicator is a modified version of TECHNICAL RATING v1.0 available in the public library to provide a quick overview of consolidated technical ratings performed on 12 assets in 3 timeframes.The purpose of the indicator is to provide a quick overview of the current status of the custom 12 (24) assets and to help focus on the appropriate asset.
█ MODIFICATIONS
- Markers, visualizations and alerts have been deleted
- Due to the limitation on maximum number of security (40), the results of 12 assets evaluated in 3 different time frames can be shown at the same time.
- An additional 12 assets can be configured in the settings so that you do not have to choose each ticker one by one to facilitate a quick change, but can switch between the 12 -12 assets with a single click on "Second sets?".
- The position, colors and parameters of the table can be widely customized in the settings.
- The 12 assets can be arranged in rows 3, 4, 6 and 12 with Table Rows options, which can also be used to create a simple mobile view.
- The default gradient color setting has been changed to red/yellow/green traffic lights
ORIGINAL DESCRIPTION ABOUT TECHNICAL RATING v1.0
█ OVERVIEW
This indicator calculates TradingView's well-known "Strong Buy", "Buy", "Neutral", "Sell" or "Strong Sell" states using the aggregate biases of 26 different technical indicators.
█ WARNING
This version is similar, but not identical, to our recently published "Technical Ratings" built-in, which reproduces our "Technicals" ratings displayed as a gauge in the right panel of charts, or in the "Rating" indicator available in the TradingView Screener. This is a fork and refactoring of the code base used in the "Technical Ratings" built-in. Its calculations will not always match those of the built-in, but it provides options not available in the built-in. Up to you to decide which one you prefer to use.
█ FEATURES
Differences with the built-in version
• The built-in version produces values matching the states displayed in the "Technicals" ratings gauge; this one does not always.
• A strategy version is also available as a built-in; this script is an indicator—not a strategy.
• This indicator will show a slightly different vertical scale, as it does not use a fixed scale like the built-in.
• This version allows control over repainting of the signal when you do not use a higher timeframe. Higher timeframe (HTF) information from this version does not repaint.
• You can adjust the weight of the Oscillators and MAs components of the rating here.
• You can configure markers on signal breaches of configurable levels, or on advances declines of the signal.
The indicator's settings allow you to:
• Choose the timeframe you want calculations to be made on.
• When not using a HTF, you can select a repainting or non-repainting signal.
• When using both MAs and Oscillators groups to calculate the rating, you can vary the weight of each group in the calculation. The default is 50/50.
Because the MAs group uses longer periods for some of its components, its value is not as jumpy as the Oscillators value.
Increasing the weight of the MAs group will thus have a calming effect on the signal.
• Alerts can be created on the indicator using the conditions configured to control the display of markers.
Display
The calculated rating is displayed as columns, but you can change the style in the inputs. The color of the signal can be one of three colors: bull, bear, or neutral. You can choose from a few presets, or check one and edit its color. The color is determined from the rating's value. Between 0.1 and -0.1 it is in the neutral color. Above/below 0.1/-0.1 it will appear in the bull/bear color. The intensity of the bull/bear color is determined by cumulative advances/declines in the rating. It is capped to 5, so there are five intensities for each of the bull/bear colors.
The "Strong Buy", "Buy", "Neutral", "Sell" or "Strong Sell" state of the last calculated value is displayed to the right of the last bar for each of the three groups: All, MAs and Oscillators. The first value always reflects your selection in the "Rating uses" field and is the one used to display the signal. A "Strong Buy" or "Strong Sell" state appears when the signal is above/below the 0.5/-0.5 level. A "Buy" or "Sell" state appears when the signal is above/below the 0.1/-0.1 level. The "Neutral" state appears when the signal is between 0.1 and -0.1 inclusively.
Five levels are always displayed: 0.5 and 0.1 in the bull color, zero in the neutral color, and -0.1 and - 0.5 in the bull color.
█ CALCULATIONS
The indicator calculates the aggregate value of two groups of indicators: moving averages and oscillators.
The "MAs" group is comprised of 15 different components:
• Six Simple Moving Averages of periods 10, 20, 30, 50, 100 and 200
• Six Exponential Moving Averages of the same periods
• A Hull Moving Average of period 9
• A Volume-weighed Moving Average of period 20
• Ichimoku
The "Oscillators" group includes 11 components:
• RSI
• Stochastic
• CCI
• ADX
• Awesome Oscillator
• Momentum
• MACD
• Stochastic RSI
• Wiliams %R
• Bull Bear Power
• Ultimate Oscillator

Technical Ratings█ OVERVIEW
This indicator calculates TradingView's well-known "Strong Buy", "Buy", "Neutral", "Sell" or "Strong Sell" states using the aggregate biases of 26 different technical indicators.
█ FEATURES
Differences with the built-in version
• You can adjust the weight of the Oscillators and MAs components of the rating here.
• The built-in version produces values matching the states displayed in the "Technicals" ratings gauge; this one does not always, where weighting is used.
• A strategy version is also available as a built-in; this script is an indicator—not a strategy.
• This indicator will show a slightly different vertical scale, as it does not use a fixed scale like the built-in.
• This version allows control over repainting of the signal when you do not use a higher timeframe. Higher timeframe (HTF) information from this version does not repaint.
• You can configure markers on signal breaches of configurable levels, or on advances declines of the signal.
The indicator's settings allow you to:
• Choose the timeframe you want calculations to be made on.
• When not using a HTF, you can select a repainting or non-repainting signal.
• When using both MAs and Oscillators groups to calculate the rating, you can vary the weight of each group in the calculation. The default is 50/50.
Because the MAs group uses longer periods for some of its components, its value is not as jumpy as the Oscillators value.
Increasing the weight of the MAs group will thus have a calming effect on the signal.
• Alerts can be created on the indicator using the conditions configured to control the display of markers.
Display
The calculated rating is displayed as columns, but you can change the style in the inputs. The color of the signal can be one of three colors: bull, bear, or neutral. You can choose from a few presets, or check one and edit its color. The color is determined from the rating's value. Between 0.1 and -0.1 it is in the neutral color. Above/below 0.1/-0.1 it will appear in the bull/bear color. The intensity of the bull/bear color is determined by cumulative advances/declines in the rating. It is capped to 5, so there are five intensities for each of the bull/bear colors.
The "Strong Buy", "Buy", "Neutral", "Sell" or "Strong Sell" state of the last calculated value is displayed to the right of the last bar for each of the three groups: All, MAs and Oscillators. The first value always reflects your selection in the "Rating uses" field and is the one used to display the signal. A "Strong Buy" or "Strong Sell" state appears when the signal is above/below the 0.5/-0.5 level. A "Buy" or "Sell" state appears when the signal is above/below the 0.1/-0.1 level. The "Neutral" state appears when the signal is between 0.1 and -0.1 inclusively.
Five levels are always displayed: 0.5 and 0.1 in the bull color, zero in the neutral color, and -0.1 and - 0.5 in the bull color.
The levels that can be used to determine the breaches displaying long/short markers will only be visible when their respective long/short markers are turned on in the "Direction" input. The levels appear as a bright dotted line in bull/bear colors. You can control both levels separately through the "Longs Level" and "Shorts Level" inputs.
If you specify a higher timeframe that is not greater than the chart's timeframe, an error message will appear and the indicator's background will turn red, as it doesn't make sense to use a lower timeframe than the chart's.
Markers
Markers are small triangles that appear at the bottom and top of the indicator's pane. The marker settings define the conditions that will trigger an alert when you configure an alert on the indicator. You can:
• Choose if you want long, short or both long and short markers.
• Determine the signal level and/or the number of cumulative advances/declines in the signal which must be reached for either a long or short marker to appear.
Reminder: the number of advances/declines is also what controls the brightness of the plotted signal.
• Decide if you want to restrict markers to ones that alternate between longs and shorts, if you are displaying both directions.
This helps to minimize the number of markers, e.g., only the first long marker will be displayed, and then no more long markers will appear until a short comes in, then a long, etc.
Alerts
When you create an alert from this indicator, that alert will trigger whenever your marker conditions are confirmed. Before creating your alert, configure the makers so they reflect the conditions you want your alert to trigger on.
The script uses the alert() function, which entails that you select the "Any alert() function call" condition from the "Create Alert" dialog box when creating alerts on the script. The alert messages can be configured in the inputs. You can safely disregard the warning popup that appears when you create alerts from this script. Alerts will not repaint. Markers will appear, and thus alerts will trigger, at the opening of the bar following the confirmation of the marker condition. Markers will never disappear from the bar once they appear.
Repainting
This indicator uses a two-pronged approach to control repainting. The repainting of the displayed signal is controlled through the "Repainting" field in the script's inputs. This only applies when you have "Same as chart" selected in the "Timeframe" field, as higher timeframe data never repaints. Regardless of that setting, markers and thus alerts never repaint.
When using the chart's timeframe, choosing a non-repainting signal makes the signal one bar late, so that it only displays a value once the bar it was calculated has elapsed. When using a higher timeframe, new values are only displayed once the higher timeframe completes.
Because the markers never repaint, their logic adapts to the repainting setting used for the signal. When the signal repaints, markers will only appear at the close of a realtime bar. When the signal does not repaint (or if you use a higher timeframe), alerts will appear at the beginning of the realtime bar, since they are calculated on values that already do not repaint.
█ CALCULATIONS
The indicator calculates the aggregate value of two groups of indicators: moving averages and oscillators.
The "MAs" group is comprised of 15 different components:
• Six Simple Moving Averages of periods 10, 20, 30, 50, 100 and 200
• Six Exponential Moving Averages of the same periods
• A Hull Moving Average of period 9
• A Volume-weighed Moving Average of period 20
• Ichimoku
The "Oscillators" group includes 11 components:
• RSI
• Stochastic
• CCI
• ADX
• Awesome Oscillator
• Momentum
• MACD
• Stochastic RSI
• Wiliams %R
• Bull Bear Power
• Ultimate Oscillator
The state of each group's components is evaluated to a +1/0/-1 value corresponding to its bull/neutral/bear bias. The resulting value for each of the two groups are then averaged to produce the overall value for the indicator, which oscillates between +1 and -1. The complete conditions used in the calculations are documented in the Help Center .
█ NOTES
Accuracy
When comparing values to the other versions of the Rating, make sure you are comparing similar timeframes, as the "Technicals" gauge in the chart's right pane, for example, uses a 1D timeframe by default.
For coders
We use a handy characteristic of array.avg() which, contrary to avg() , does not return na when one of the averaged values is na . It will average only the array elements which are not na . This is useful in the context where the functions used to calculate the bull/neutral/bear bias for each component used in the rating include special checks to return na whenever the dataset does not yet contain enough data to provide reliable values. This way, components gradually kick in the calculations as the script calculates on more and more historical data.
We also use the new `group` and `tooltip` parameters to input() , as well as dynamic color generation of different transparencies from the bull/bear/neutral colors selected by the user.
Our script was written using the PineCoders Coding Conventions for Pine .
The description was formatted using the techniques explained in the How We Write and Format Script Descriptions PineCoders publication.
Bits and pieces were lifted from the PineCoders' MTF Selection Framework .
Look first. Then leap.

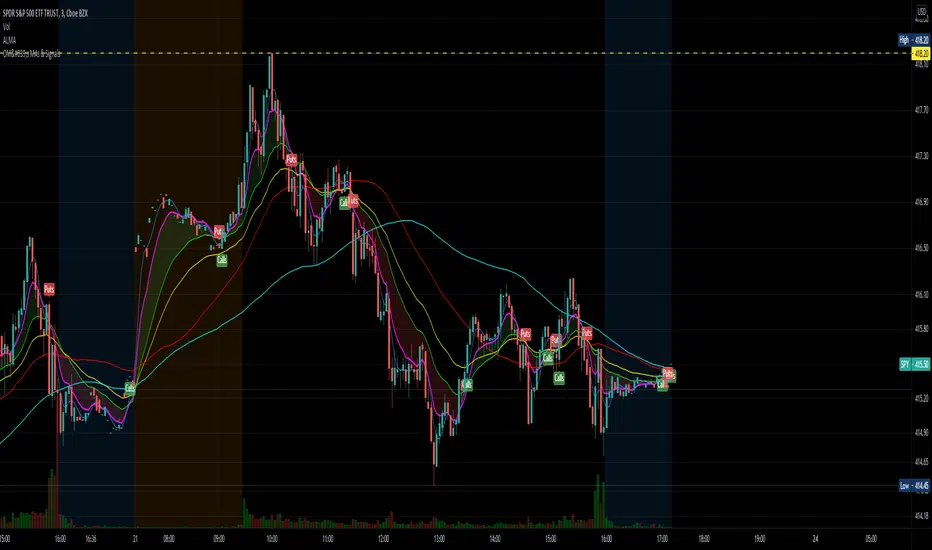
OptionsMillionaire SPY Moving Averages and Signalsby ColeJustice
OptionsMillionaire's SPY Options trading system is based mainly on these indicators:
- 8 EMA*
- 21 EMA*
- 100 SMA*
- 200 SMA*
- MACD
- RSI
- Squeeze Momentum
(*provided by this indicator)
and follows these rules:
|
| 1) I never fight the trend. If its green, i buy calls. If its red, i buy puts. I will only buy puts on a green day if there is a overall change in market trend. Inversely, calls on a red day
| 2) Price action is my #1 indicator. I wait for it to confirm my thesis before i enter a trade
| 3) I only trade SPY Options
| 4) My baseline is to choose a call/put that has a DTE (Date To Expiration) 6-7 days out, with a strike $2-$3 away. I adjust that to fit my current appetite for volatility. i virtually never play same day DTE's.
| 5) I set a 10% stop, but usually exit at 8% before my stop triggers depending on current situation
| 6) I utilize about 10-20% of my Portfolio for one trade. Sometimes more. Rarely less.
| 7) I never hold overnight in these market conditions.
| 8) I shoot for 10-20% for gains. Depending on market conditions.
| 9) Always look for confirmations in your indicators.
| 10) I never force a trade. No trade is a good trade too if the entry just isn't there.
| 11) Patience always pays off. A great set-up can form in minutes or seconds. I never regret being patient to enter. I nearly always regret rushing into a trade.
|
This indicator combines the moving averages into a single unit to simplify one part of the indicator usage rules: the 8 EMA / 21 EMA Cross. . The 8 crossing over the 21 is a Bullish signal, while the 8 crossing under the 21 is a Bearish signal. This indicator places flags at these crossover/under points, as well as shading the area between the 8 and 21 EMAs to help visualize the strength of the trend; green during a Bullish cross, and red during a Bearish cross.
A new addition to this strategy is the Hull Moving Average, or HMA. This script defaults to an HMA of 20 and shows alerts when candles close above or below the plot in the form of green and red candle backgrounds. This alert is best used in conjunction with the main crossovers and should be considered an addition level of confidence rather than providing trade entry/exits directly. This indicator is more flexible and you should feel free to adjust the period if you find a different value works better within your own personal trading style.
Each individual element of this indicator can be modified or toggled, providing maximum customization. While you should strive to become comfortable with the default settings, these options are provided in case you feel the need to adjust for your own style (or if testing on tickers other than SPY, for example).
Goodluch, and happy trading!
Trending/RangingThis script is a useful tool to use to identify the current market. It includes three other indicators:
1. ATR (combined with a SMA of the ATR)
2. ADX
3. RSI
It allows you to filter for when the market is trending vs. when the market is ranging by using any of the three indicators. You can also combine them to find extremely good trends to trade, or if you're a channel trader, identify when you wouldn't want to trade. This indicator also includes a time frame setting to allow you to ZOOM OUT and explore the long term trend of the security you are trading. I highly recommend using this indicator as a filter for when you enter a trade or not depending on the system you like to trade.

Eclipse Multi-Oscillator [JOAT]Eclipse Multi-Oscillator - Unified Momentum Confluence System
Introduction and Purpose
Eclipse Multi-Oscillator is an open-source indicator that combines four classic oscillators (RSI, Stochastic, CCI, and Williams %R) into a single unified view with confluence detection. The core problem this indicator solves is oscillator disagreement: traders often see RSI oversold while Stochastic is neutral, or CCI overbought while Williams %R is mid-range. This creates confusion about the true momentum state.
This indicator addresses that by displaying all four oscillators together and counting how many agree on overbought or oversold conditions, providing a clear confluence score that cuts through the noise.
Why These Four Oscillators Work Together
Each oscillator measures momentum differently, and their combination provides a more complete picture:
1. RSI (Relative Strength Index) - Measures the magnitude of recent price changes. Best at identifying momentum exhaustion.
2. Stochastic - Compares closing price to the high-low range. Best at identifying where price is within its recent range.
3. CCI (Commodity Channel Index) - Measures price deviation from statistical mean. Best at identifying unusual price movements.
4. Williams %R - Similar to Stochastic but inverted. Provides confirmation of Stochastic readings.
When 3 or more of these oscillators agree on overbought or oversold, the signal is significantly more reliable than any single oscillator alone.
How Confluence Scoring Works
The indicator counts how many oscillators are in extreme territory:
int obCount = 0
if rsi > rsiOB
obCount += 1
if stochK > stochOB
obCount += 1
if cci > cciOB
obCount += 1
if willRScaled > stochOB
obCount += 1
bool strongOverbought = obCount >= 3
bool strongOversold = osCount >= 3
The confluence score ranges from -4 (all oversold) to +4 (all overbought), with 0 being neutral.
Signal Types
Strong Oversold - 3+ oscillators below oversold threshold (potential bounce)
Strong Overbought - 3+ oscillators above overbought threshold (potential pullback)
OB/OS Exit - RSI leaving extreme zone with Stochastic confirmation (potential reversal)
Divergence - Price makes new high/low while RSI does not (potential reversal warning)
Dashboard Information
RSI/Stoch K/CCI/Will %R - Current values with zone status (OB/OS/MID)
Confluence - Overall bias (STRONG OS, STRONG OB, Lean Bull/Bear, Neutral)
OB Count - How many oscillators are overbought (0-4)
OS Count - How many oscillators are oversold (0-4)
How to Use This Indicator
For Reversal Trading:
1. Wait for Strong Oversold (3+ oscillators agree)
2. Look for bullish candlestick pattern or support level
3. Enter long with stop below recent low
4. Take profit when confluence returns to neutral or overbought
For Trend Confirmation:
1. Check confluence direction matches your trade bias
2. Avoid longs when confluence is strongly overbought
3. Avoid shorts when confluence is strongly oversold
For Divergence Trading:
1. Watch for "D" labels indicating RSI divergence
2. Bullish divergence at support = potential long
3. Bearish divergence at resistance = potential short
Input Parameters
RSI Length (14) - Period for RSI calculation
Stochastic K/D Length (14/3) - Periods for Stochastic
CCI Length (20) - Period for CCI
Williams %R Length (14) - Period for Williams %R
OB/OS Thresholds - Customizable levels for each oscillator
Timeframe Recommendations
15m-1H: Good for intraday momentum analysis
4H-Daily: Best for swing trading confluence
Very short timeframes may produce noisy signals
Limitations
All oscillators can remain in extreme territory during strong trends
Confluence does not predict direction, only identifies extremes
Divergence detection is simplified and may miss some patterns
Works best in ranging or moderately trending markets
Open-Source and Disclaimer
This script is published as open-source under the Mozilla Public License 2.0 for educational purposes. The source code is fully visible and can be studied.
This indicator does not constitute financial advice. Oscillator confluence does not guarantee reversals. Past performance does not guarantee future results. Always use proper risk management.
- Made with passion by officialjackofalltrades

Tzotchev Trend Measure [EdgeTools]Are you still measuring trend strength with moving averages? Here is a better variant at scientific level:
Tzotchev Trend Measure: A Statistical Approach to Trend Following
The Tzotchev Trend Measure represents a sophisticated advancement in quantitative trend analysis, moving beyond traditional moving average-based indicators toward a statistically rigorous framework for measuring trend strength. This indicator implements the methodology developed by Tzotchev et al. (2015) in their seminal J.P. Morgan research paper "Designing robust trend-following system: Behind the scenes of trend-following," which introduced a probabilistic approach to trend measurement that has since become a cornerstone of institutional trading strategies.
Mathematical Foundation and Statistical Theory
The core innovation of the Tzotchev Trend Measure lies in its transformation of price momentum into a probability-based metric through the application of statistical hypothesis testing principles. The indicator employs the fundamental formula ST = 2 × Φ(√T × r̄T / σ̂T) - 1, where ST represents the trend strength score bounded between -1 and +1, Φ(x) denotes the normal cumulative distribution function, T represents the lookback period in trading days, r̄T is the average logarithmic return over the specified period, and σ̂T represents the estimated daily return volatility.
This formulation transforms what is essentially a t-statistic into a probabilistic trend measure, testing the null hypothesis that the mean return equals zero against the alternative hypothesis of non-zero mean return. The use of logarithmic returns rather than simple returns provides several statistical advantages, including symmetry properties where log(P₁/P₀) = -log(P₀/P₁), additivity characteristics that allow for proper compounding analysis, and improved validity of normal distribution assumptions that underpin the statistical framework.
The implementation utilizes the Abramowitz and Stegun (1964) approximation for the normal cumulative distribution function, achieving accuracy within ±1.5 × 10⁻⁷ for all input values. This approximation employs Horner's method for polynomial evaluation to ensure numerical stability, particularly important when processing large datasets or extreme market conditions.
Comparative Analysis with Traditional Trend Measurement Methods
The Tzotchev Trend Measure demonstrates significant theoretical and empirical advantages over conventional trend analysis techniques. Traditional moving average-based systems, including simple moving averages (SMA), exponential moving averages (EMA), and their derivatives such as MACD, suffer from several fundamental limitations that the Tzotchev methodology addresses systematically.
Moving average systems exhibit inherent lag bias, as documented by Kaufman (2013) in "Trading Systems and Methods," where he demonstrates that moving averages inevitably lag price movements by approximately half their period length. This lag creates delayed signal generation that reduces profitability in trending markets and increases false signal frequency during consolidation periods. In contrast, the Tzotchev measure eliminates lag bias by directly analyzing the statistical properties of return distributions rather than smoothing price levels.
The volatility normalization inherent in the Tzotchev formula addresses a critical weakness in traditional momentum indicators. As shown by Bollinger (2001) in "Bollinger on Bollinger Bands," momentum oscillators like RSI and Stochastic fail to account for changing volatility regimes, leading to inconsistent signal interpretation across different market conditions. The Tzotchev measure's incorporation of return volatility in the denominator ensures that trend strength assessments remain consistent regardless of the underlying volatility environment.
Empirical studies by Hurst, Ooi, and Pedersen (2013) in "Demystifying Managed Futures" demonstrate that traditional trend-following indicators suffer from significant drawdowns during whipsaw markets, with Sharpe ratios frequently below 0.5 during challenging periods. The authors attribute these poor performance characteristics to the binary nature of most trend signals and their inability to quantify signal confidence. The Tzotchev measure addresses this limitation by providing continuous probability-based outputs that allow for more sophisticated risk management and position sizing strategies.
The statistical foundation of the Tzotchev approach provides superior robustness compared to technical indicators that lack theoretical grounding. Fama and French (1988) in "Permanent and Temporary Components of Stock Prices" established that price movements contain both permanent and temporary components, with traditional moving averages unable to distinguish between these elements effectively. The Tzotchev methodology's hypothesis testing framework specifically tests for the presence of permanent trend components while filtering out temporary noise, providing a more theoretically sound approach to trend identification.
Research by Moskowitz, Ooi, and Pedersen (2012) in "Time Series Momentum in the Cross Section of Asset Returns" found that traditional momentum indicators exhibit significant variation in effectiveness across asset classes and time periods. Their study of multiple asset classes over decades revealed that simple price-based momentum measures often fail to capture persistent trends in fixed income and commodity markets. The Tzotchev measure's normalization by volatility and its probabilistic interpretation provide consistent performance across diverse asset classes, as demonstrated in the original J.P. Morgan research.
Comparative performance studies conducted by AQR Capital Management (Asness, Moskowitz, and Pedersen, 2013) in "Value and Momentum Everywhere" show that volatility-adjusted momentum measures significantly outperform traditional price momentum across international equity, bond, commodity, and currency markets. The study documents Sharpe ratio improvements of 0.2 to 0.4 when incorporating volatility normalization, consistent with the theoretical advantages of the Tzotchev approach.
The regime detection capabilities of the Tzotchev measure provide additional advantages over binary trend classification systems. Research by Ang and Bekaert (2002) in "Regime Switches in Interest Rates" demonstrates that financial markets exhibit distinct regime characteristics that traditional indicators fail to capture adequately. The Tzotchev measure's five-tier classification system (Strong Bull, Weak Bull, Neutral, Weak Bear, Strong Bear) provides more nuanced market state identification than simple trend/no-trend binary systems.
Statistical testing by Jegadeesh and Titman (2001) in "Profitability of Momentum Strategies" revealed that traditional momentum indicators suffer from significant parameter instability, with optimal lookback periods varying substantially across market conditions and asset classes. The Tzotchev measure's statistical framework provides more stable parameter selection through its grounding in hypothesis testing theory, reducing the need for frequent parameter optimization that can lead to overfitting.
Advanced Noise Filtering and Market Regime Detection
A significant enhancement over the original Tzotchev methodology is the incorporation of a multi-factor noise filtering system designed to reduce false signals during sideways market conditions. The filtering mechanism employs four distinct approaches: adaptive thresholding based on current market regime strength, volatility-based filtering utilizing ATR percentile analysis, trend strength confirmation through momentum alignment, and a comprehensive multi-factor approach that combines all methodologies.
The adaptive filtering system analyzes market microstructure through price change relative to average true range, calculates volatility percentiles over rolling windows, and assesses trend alignment across multiple timeframes using exponential moving averages of varying periods. This approach addresses one of the primary limitations identified in traditional trend-following systems, namely their tendency to generate excessive false signals during periods of low volatility or sideways price action.
The regime detection component classifies market conditions into five distinct categories: Strong Bull (ST > 0.3), Weak Bull (0.1 < ST ≤ 0.3), Neutral (-0.1 ≤ ST ≤ 0.1), Weak Bear (-0.3 ≤ ST < -0.1), and Strong Bear (ST < -0.3). This classification system provides traders with clear, quantitative definitions of market regimes that can inform position sizing, risk management, and strategy selection decisions.
Professional Implementation and Trading Applications
The indicator incorporates three distinct trading profiles designed to accommodate different investment approaches and risk tolerances. The Conservative profile employs longer lookback periods (63 days), higher signal thresholds (0.2), and reduced filter sensitivity (0.5) to minimize false signals and focus on major trend changes. The Balanced profile utilizes standard academic parameters with moderate settings across all dimensions. The Aggressive profile implements shorter lookback periods (14 days), lower signal thresholds (-0.1), and increased filter sensitivity (1.5) to capture shorter-term trend movements.
Signal generation occurs through threshold crossover analysis, where long signals are generated when the trend measure crosses above the specified threshold and short signals when it crosses below. The implementation includes sophisticated signal confirmation mechanisms that consider trend alignment across multiple timeframes and momentum strength percentiles to reduce the likelihood of false breakouts.
The alert system provides real-time notifications for trend threshold crossovers, strong regime changes, and signal generation events, with configurable frequency controls to prevent notification spam. Alert messages are standardized to ensure consistency across different market conditions and timeframes.
Performance Optimization and Computational Efficiency
The implementation incorporates several performance optimization features designed to handle large datasets efficiently. The maximum bars back parameter allows users to control historical calculation depth, with default settings optimized for most trading applications while providing flexibility for extended historical analysis. The system includes automatic performance monitoring that generates warnings when computational limits are approached.
Error handling mechanisms protect against division by zero conditions, infinite values, and other numerical instabilities that can occur during extreme market conditions. The finite value checking system ensures data integrity throughout the calculation process, with fallback mechanisms that maintain indicator functionality even when encountering corrupted or missing price data.
Timeframe validation provides warnings when the indicator is applied to unsuitable timeframes, as the Tzotchev methodology was specifically designed for daily and higher timeframe analysis. This validation helps prevent misapplication of the indicator in contexts where its statistical assumptions may not hold.
Visual Design and User Interface
The indicator features eight professional color schemes designed for different trading environments and user preferences. The EdgeTools theme provides an institutional blue and steel color palette suitable for professional trading environments. The Gold theme offers warm colors optimized for commodities trading. The Behavioral theme incorporates psychology-based color contrasts that align with behavioral finance principles. The Quant theme provides neutral colors suitable for analytical applications.
Additional specialized themes include Ocean, Fire, Matrix, and Arctic variations, each optimized for specific visual preferences and trading contexts. All color schemes include automatic dark and light mode optimization to ensure optimal readability across different chart backgrounds and trading platforms.
The information table provides real-time display of key metrics including current trend measure value, market regime classification, signal strength, Z-score, average returns, volatility measures, filter threshold levels, and filter effectiveness percentages. This comprehensive dashboard allows traders to monitor all relevant indicator components simultaneously.
Theoretical Implications and Research Context
The Tzotchev Trend Measure addresses several theoretical limitations inherent in traditional technical analysis approaches. Unlike moving average-based systems that rely on price level comparisons, this methodology grounds trend analysis in statistical hypothesis testing, providing a more robust theoretical foundation for trading decisions.
The probabilistic interpretation of trend strength offers significant advantages over binary trend classification systems. Rather than simply indicating whether a trend exists, the measure quantifies the statistical confidence level associated with the trend assessment, allowing for more nuanced risk management and position sizing decisions.
The incorporation of volatility normalization addresses the well-documented problem of volatility clustering in financial time series, ensuring that trend strength assessments remain consistent across different market volatility regimes. This normalization is particularly important for portfolio management applications where consistent risk metrics across different assets and time periods are essential.
Practical Applications and Trading Strategy Integration
The Tzotchev Trend Measure can be effectively integrated into various trading strategies and portfolio management frameworks. For trend-following strategies, the indicator provides clear entry and exit signals with quantified confidence levels. For mean reversion strategies, extreme readings can signal potential turning points. For portfolio allocation, the regime classification system can inform dynamic asset allocation decisions.
The indicator's statistical foundation makes it particularly suitable for quantitative trading strategies where systematic, rules-based approaches are preferred over discretionary decision-making. The standardized output range facilitates easy integration with position sizing algorithms and risk management systems.
Risk management applications benefit from the indicator's ability to quantify trend strength and provide early warning signals of potential trend changes. The multi-timeframe analysis capability allows for the construction of robust risk management frameworks that consider both short-term tactical and long-term strategic market conditions.
Implementation Guide and Parameter Configuration
The practical application of the Tzotchev Trend Measure requires careful parameter configuration to optimize performance for specific trading objectives and market conditions. This section provides comprehensive guidance for parameter selection and indicator customization.
Core Calculation Parameters
The Lookback Period parameter controls the statistical window used for trend calculation and represents the most critical setting for the indicator. Default values range from 14 to 63 trading days, with shorter periods (14-21 days) providing more sensitive trend detection suitable for short-term trading strategies, while longer periods (42-63 days) offer more stable trend identification appropriate for position trading and long-term investment strategies. The parameter directly influences the statistical significance of trend measurements, with longer periods requiring stronger underlying trends to generate significant signals but providing greater reliability in trend identification.
The Price Source parameter determines which price series is used for return calculations. The default close price provides standard trend analysis, while alternative selections such as high-low midpoint ((high + low) / 2) can reduce noise in volatile markets, and volume-weighted average price (VWAP) offers superior trend identification in institutional trading environments where volume concentration matters significantly.
The Signal Threshold parameter establishes the minimum trend strength required for signal generation, with values ranging from -0.5 to 0.5. Conservative threshold settings (0.2 to 0.3) reduce false signals but may miss early trend opportunities, while aggressive settings (-0.1 to 0.1) provide earlier signal generation at the cost of increased false positive rates. The optimal threshold depends on the trader's risk tolerance and the volatility characteristics of the traded instrument.
Trading Profile Configuration
The Trading Profile system provides pre-configured parameter sets optimized for different trading approaches. The Conservative profile employs a 63-day lookback period with a 0.2 signal threshold and 0.5 noise sensitivity, designed for long-term position traders seeking high-probability trend signals with minimal false positives. The Balanced profile uses a 21-day lookback with 0.05 signal threshold and 1.0 noise sensitivity, suitable for swing traders requiring moderate signal frequency with acceptable noise levels. The Aggressive profile implements a 14-day lookback with -0.1 signal threshold and 1.5 noise sensitivity, optimized for day traders and scalpers requiring frequent signal generation despite higher noise levels.
Advanced Noise Filtering System
The noise filtering mechanism addresses the challenge of false signals during sideways market conditions through four distinct methodologies. The Adaptive filter adjusts thresholds based on current trend strength, increasing sensitivity during strong trending periods while raising thresholds during consolidation phases. The Volatility-based filter utilizes Average True Range (ATR) percentile analysis to suppress signals during abnormally volatile conditions that typically generate false trend indications.
The Trend Strength filter requires alignment between multiple momentum indicators before confirming signals, reducing the probability of false breakouts from consolidation patterns. The Multi-factor approach combines all filtering methodologies using weighted scoring to provide the most robust noise reduction while maintaining signal responsiveness during genuine trend initiations.
The Noise Sensitivity parameter controls the aggressiveness of the filtering system, with lower values (0.5-1.0) providing conservative filtering suitable for volatile instruments, while higher values (1.5-2.0) allow more signals through but may increase false positive rates during choppy market conditions.
Visual Customization and Display Options
The Color Scheme parameter offers eight professional visualization options designed for different analytical preferences and market conditions. The EdgeTools scheme provides high contrast visualization optimized for trend strength differentiation, while the Gold scheme offers warm tones suitable for commodity analysis. The Behavioral scheme uses psychological color associations to enhance decision-making speed, and the Quant scheme provides neutral colors appropriate for quantitative analysis environments.
The Ocean, Fire, Matrix, and Arctic schemes offer additional aesthetic options while maintaining analytical functionality. Each scheme includes optimized colors for both light and dark chart backgrounds, ensuring visibility across different trading platform configurations.
The Show Glow Effects parameter enhances plot visibility through multiple layered lines with progressive transparency, particularly useful when analyzing multiple timeframes simultaneously or when working with dense price data that might obscure trend signals.
Performance Optimization Settings
The Maximum Bars Back parameter controls the historical data depth available for calculations, with values ranging from 5,000 to 50,000 bars. Higher values enable analysis of longer-term trend patterns but may impact indicator loading speed on slower systems or when applied to multiple instruments simultaneously. The optimal setting depends on the intended analysis timeframe and available computational resources.
The Calculate on Every Tick parameter determines whether the indicator updates with every price change or only at bar close. Real-time calculation provides immediate signal updates suitable for scalping and day trading strategies, while bar-close calculation reduces computational overhead and eliminates signal flickering during bar formation, preferred for swing trading and position management applications.
Alert System Configuration
The Alert Frequency parameter controls notification generation, with options for all signals, bar close only, or once per bar. High-frequency trading strategies benefit from all signals mode, while position traders typically prefer bar close alerts to avoid premature position entries based on intrabar fluctuations.
The alert system generates four distinct notification types: Long Signal alerts when the trend measure crosses above the positive signal threshold, Short Signal alerts for negative threshold crossings, Bull Regime alerts when entering strong bullish conditions, and Bear Regime alerts for strong bearish regime identification.
Table Display and Information Management
The information table provides real-time statistical metrics including current trend value, regime classification, signal status, and filter effectiveness measurements. The table position can be customized for optimal screen real estate utilization, and individual metrics can be toggled based on analytical requirements.
The Language parameter supports both English and German display options for international users, while maintaining consistent calculation methodology regardless of display language selection.
Risk Management Integration
Effective risk management integration requires coordination between the trend measure signals and position sizing algorithms. Strong trend readings (above 0.5 or below -0.5) support larger position sizes due to higher probability of trend continuation, while neutral readings (between -0.2 and 0.2) suggest reduced position sizes or range-trading strategies.
The regime classification system provides additional risk management context, with Strong Bull and Strong Bear regimes supporting trend-following strategies, while Neutral regimes indicate potential for mean reversion approaches. The filter effectiveness metric helps traders assess current market conditions and adjust strategy parameters accordingly.
Timeframe Considerations and Multi-Timeframe Analysis
The indicator's effectiveness varies across different timeframes, with higher timeframes (daily, weekly) providing more reliable trend identification but slower signal generation, while lower timeframes (hourly, 15-minute) offer faster signals with increased noise levels. Multi-timeframe analysis combining trend alignment across multiple periods significantly improves signal quality and reduces false positive rates.
For optimal results, traders should consider trend alignment between the primary trading timeframe and at least one higher timeframe before entering positions. Divergences between timeframes often signal potential trend reversals or consolidation periods requiring strategy adjustment.
Conclusion
The Tzotchev Trend Measure represents a significant advancement in technical analysis methodology, combining rigorous statistical foundations with practical trading applications. Its implementation of the J.P. Morgan research methodology provides institutional-quality trend analysis capabilities previously available only to sophisticated quantitative trading firms.
The comprehensive parameter configuration options enable customization for diverse trading styles and market conditions, while the advanced noise filtering and regime detection capabilities provide superior signal quality compared to traditional trend-following indicators. Proper parameter selection and understanding of the indicator's statistical foundation are essential for achieving optimal trading results and effective risk management.
References
Abramowitz, M. and Stegun, I.A. (1964). Handbook of Mathematical Functions with Formulas, Graphs, and Mathematical Tables. Washington: National Bureau of Standards.
Ang, A. and Bekaert, G. (2002). Regime Switches in Interest Rates. Journal of Business and Economic Statistics, 20(2), 163-182.
Asness, C.S., Moskowitz, T.J., and Pedersen, L.H. (2013). Value and Momentum Everywhere. Journal of Finance, 68(3), 929-985.
Bollinger, J. (2001). Bollinger on Bollinger Bands. New York: McGraw-Hill.
Fama, E.F. and French, K.R. (1988). Permanent and Temporary Components of Stock Prices. Journal of Political Economy, 96(2), 246-273.
Hurst, B., Ooi, Y.H., and Pedersen, L.H. (2013). Demystifying Managed Futures. Journal of Investment Management, 11(3), 42-58.
Jegadeesh, N. and Titman, S. (2001). Profitability of Momentum Strategies: An Evaluation of Alternative Explanations. Journal of Finance, 56(2), 699-720.
Kaufman, P.J. (2013). Trading Systems and Methods. 5th Edition. Hoboken: John Wiley & Sons.
Moskowitz, T.J., Ooi, Y.H., and Pedersen, L.H. (2012). Time Series Momentum. Journal of Financial Economics, 104(2), 228-250.
Tzotchev, D., Lo, A.W., and Hasanhodzic, J. (2015). Designing robust trend-following system: Behind the scenes of trend-following. J.P. Morgan Quantitative Research, Asset Management Division.

DynamicMALibrary "DynamicMA"
Dynamic Moving Averages Library
Introduction
The Dynamic Moving Averages Library is a specialized collection of custom built functions designed to calculate moving averages dynamically, beginning from the first available bar. Unlike standard moving averages, which rely on fixed length lookbacks, this library ensures that indicators remain fully functional from the very first data point, making it an essential tool for analysing assets with short time series or limited historical data.
This approach allows traders and developers to build robust indicators that do not require a preset amount of historical data before generating meaningful outputs. It is particularly advantageous for:
Newly listed assets with minimal price history.
High-timeframe trading, where large lookback periods can lead to delayed or missing data.
By eliminating the constraints of fixed lookback periods, this library enables the seamless construction of trend indicators, smoothing functions, and hybrid models that adapt instantly to market conditions.
Comprehensive Set of Custom Moving Averages
The library includes a wide range of custom dynamic moving averages, each designed for specific analytical use cases:
SMA (Simple Moving Average) – The fundamental moving average, dynamically computed.
EMA (Exponential Moving Average) – Adaptive smoothing for better trend tracking.
DEMA (Double Exponential Moving Average) – Faster trend detection with reduced lag.
TEMA (Triple Exponential Moving Average) – Even more responsive than DEMA.
WMA (Weighted Moving Average) – Emphasizes recent price action while reducing noise.
VWMA (Volume Weighted Moving Average) – Accounts for volume to give more weight to high-volume periods.
HMA (Hull Moving Average) – A superior smoothing method with low lag.
SMMA (Smoothed Moving Average) – A hybrid approach between SMA and EMA.
LSMA (Least Squares Moving Average) – Uses linear regression for trend detection.
RMA (Relative Moving Average) – Used in RSI-based calculations for smooth momentum readings.
ALMA (Arnaud Legoux Moving Average) – A Gaussian-weighted MA for superior signal clarity.
Hyperbolic MA (HyperMA) – A mathematically optimized averaging method with dynamic weighting.
Each function dynamically adjusts its calculation length to match the available bar count, ensuring instant functionality on all assets.
Fully Optimized for Pine Script v6
This library is built on Pine Script v6, ensuring compatibility with modern TradingView indicators and scripts. It includes exportable functions for seamless integration into custom indicators, making it easy to develop trend-following models, volatility filters, and adaptive risk-management systems.
Why Use Dynamic Moving Averages?
Traditional moving averages suffer from a common limitation: they require a fixed historical window to generate meaningful values. This poses several problems:
New Assets Have No Historical Data - If an asset has only been trading for a short period, traditional moving averages may not be able to generate valid signals.
High Timeframes Require Massive Lookbacks - On 1W or 1M charts, a 200-period SMA would require 200 weeks or months of data, making it unusable on newer assets.
Delayed Signal Initialization - Standard indicators often take dozens of bars to stabilize, reducing effectiveness when trading new trends.
The Dynamic Moving Averages Library eliminates these issues by ensuring that every function:
Starts calculation from bar one, using available data instead of waiting for a lookback period.
Adapts dynamically across timeframes, making it equally effective on low or high timeframes.
Allows smoother, more responsive trend tracking, particularly useful for volatile or low-liquidity assets.
This flexibility makes it indispensable for custom script developers, quantitative analysts, and discretionary traders looking to build more adaptive and resilient indicators.
Final Summary
The Dynamic Moving Averages Library is a versatile and powerful set of functions designed to overcome the limitations of fixed-lookback indicators. By dynamically adjusting the calculation length from the first bar, this library ensures that moving averages remain fully functional across all timeframes and asset types, making it an essential tool for traders and developers alike.
With built-in adaptability, low-lag smoothing, and support for multiple moving average types, this library unlocks new possibilities for quantitative trading and strategy development - especially for assets with short price histories or those traded on higher timeframes.
For traders looking to enhance signal reliability, minimize lag, and build adaptable trading systems, the Dynamic Moving Averages Library provides an efficient and flexible solution.
SMA(sourceData, maxLength)
Dynamic SMA
Parameters:
sourceData (float)
maxLength (int)
EMA(src, length)
Dynamic EMA
Parameters:
src (float)
length (int)
DEMA(src, length)
Dynamic DEMA
Parameters:
src (float)
length (int)
TEMA(src, length)
Dynamic TEMA
Parameters:
src (float)
length (int)
WMA(src, length)
Dynamic WMA
Parameters:
src (float)
length (int)
HMA(src, length)
Dynamic HMA
Parameters:
src (float)
length (int)
VWMA(src, volsrc, length)
Dynamic VWMA
Parameters:
src (float)
volsrc (float)
length (int)
SMMA(src, length)
Dynamic SMMA
Parameters:
src (float)
length (int)
LSMA(src, length, offset)
Dynamic LSMA
Parameters:
src (float)
length (int)
offset (int)
RMA(src, length)
Dynamic RMA
Parameters:
src (float)
length (int)
ALMA(src, length, offset_sigma, sigma)
Dynamic ALMA
Parameters:
src (float)
length (int)
offset_sigma (float)
sigma (float)
HyperMA(src, length)
Dynamic HyperbolicMA
Parameters:
src (float)
length (int)

The Most Powerful TQQQ EMA Crossover Trend Trading StrategyTQQQ EMA Crossover Strategy Indicator
Meta Title: TQQQ EMA Crossover Strategy - Enhance Your Trading with Effective Signals
Meta Description: Discover the TQQQ EMA Crossover Strategy, designed to optimize trading decisions with fast and slow EMA crossovers. Learn how to effectively use this powerful indicator for better trading results.
Key Features
The TQQQ EMA Crossover Strategy is a powerful trading tool that utilizes Exponential Moving Averages (EMAs) to identify potential entry and exit points in the market. Key features of this indicator include:
**Fast and Slow EMAs:** The strategy incorporates two EMAs, allowing traders to capture short-term trends while filtering out market noise.
**Entry and Exit Signals:** Automated signals for entering and exiting trades based on EMA crossovers, enhancing decision-making efficiency.
**Customizable Parameters:** Users can adjust the lengths of the EMAs, as well as take profit and stop loss multipliers, tailoring the strategy to their trading style.
**Visual Indicators:** Clear visual plots of the EMAs and exit points on the chart for easy interpretation.
How It Works
The TQQQ EMA Crossover Strategy operates by calculating two EMAs: a fast EMA (default length of 20) and a slow EMA (default length of 50). The core concept is based on the crossover of these two moving averages:
- When the fast EMA crosses above the slow EMA, it generates a *buy signal*, indicating a potential upward trend.
- Conversely, when the fast EMA crosses below the slow EMA, it produces a *sell signal*, suggesting a potential downward trend.
This method allows traders to capitalize on momentum shifts in the market, providing timely signals for trade execution.
Trading Ideas and Insights
Traders can leverage the TQQQ EMA Crossover Strategy in various market conditions. Here are some insights:
**Scalping Opportunities:** The strategy is particularly effective for scalping in volatile markets, allowing traders to make quick profits on small price movements.
**Swing Trading:** Longer-term traders can use this strategy to identify significant trend reversals and capitalize on larger price swings.
**Risk Management:** By incorporating customizable stop loss and take profit levels, traders can manage their risk effectively while maximizing potential returns.
How Multiple Indicators Work Together
While this strategy primarily relies on EMAs, it can be enhanced by integrating additional indicators such as:
- **Relative Strength Index (RSI):** To confirm overbought or oversold conditions before entering trades.
- **Volume Indicators:** To validate breakout signals, ensuring that price movements are supported by sufficient trading volume.
Combining these indicators provides a more comprehensive view of market dynamics, increasing the reliability of trade signals generated by the EMA crossover.
Unique Aspects
What sets this indicator apart is its simplicity combined with effectiveness. The reliance on EMAs allows for smoother signals compared to traditional moving averages, reducing false signals often associated with choppy price action. Additionally, the ability to customize parameters ensures that traders can adapt the strategy to fit their unique trading styles and risk tolerance.
How to Use
To effectively utilize the TQQQ EMA Crossover Strategy:
1. **Add the Indicator:** Load the script onto your TradingView chart.
2. **Set Parameters:** Adjust the fast and slow EMA lengths according to your trading preferences.
3. **Monitor Signals:** Watch for crossover points; enter trades based on buy/sell signals generated by the indicator.
4. **Implement Risk Management:** Set your stop loss and take profit levels using the provided multipliers.
Regularly review your trading performance and adjust parameters as necessary to optimize results.
Customization
The TQQQ EMA Crossover Strategy allows for extensive customization:
- **EMA Lengths:** Change the default lengths of both fast and slow EMAs to suit different time frames or market conditions.
- **Take Profit/Stop Loss Multipliers:** Adjust these values to align with your risk management strategy. For instance, increasing the take profit multiplier may yield larger gains but could also increase exposure to market fluctuations.
This flexibility makes it suitable for various trading styles, from aggressive scalpers to conservative swing traders.
Conclusion
The TQQQ EMA Crossover Strategy is an effective tool for traders seeking an edge in their trading endeavors. By utilizing fast and slow EMAs, this indicator provides clear entry and exit signals while allowing for customization to fit individual trading strategies. Whether you are a scalper looking for quick profits or a swing trader aiming for larger moves, this indicator offers valuable insights into market trends.
Incorporate it into your TradingView toolkit today and elevate your trading performance!

Uptrick: Dual Moving Average Volume Oscillator
Title: Uptrick: Dual Moving Average Volume Oscillator (DPVO)
### Overview
The "Uptrick: Dual Moving Average Volume Oscillator" (DPVO) is an advanced trading tool designed to enhance market analysis by integrating volume data with price action. This indicator is specially developed to provide traders with deeper insights into market dynamics, making it easier to spot potential entry and exit points based on volume and price interactions. The DPVO stands out by offering a sophisticated approach to traditional volume analysis, setting it apart from typical volume indicators available on the TradingView platform.
### Unique Features
Unlike traditional indicators that analyze volume and price movements separately, the DPVO combines these two critical elements to offer a comprehensive view of market behavior. By calculating the Volume Impact, which involves the product of the exponential moving averages (EMAs) of volume and the price range (close - open), this indicator highlights significant trading activities that could indicate strong buying or selling pressure. This method allows traders to see not just the volume spikes, but how those spikes relate to price movements, providing a clearer picture of market sentiment.
### Customization and Inputs
The DPVO is highly customizable, catering to various trading styles and strategies:
- **Oscillator Length (`oscLength`)**: Adjusts the period over which the volume and price difference is analyzed, allowing traders to set it according to their trading timeframe.
- **Fast and Slow Moving Averages (`fastMA` and `slowMA`)**: These parameters control the responsiveness of the DPVO. A shorter `fastMA` coupled with a longer `slowMA` can help in identifying trends quicker or smoothing out market noise for more conservative approaches.
- **Signal Smoothing (`signalSmooth`)**: This input helps in reducing signal noise, making the crossover and crossunder points between the DVO and its smoothed signal line clearer and easier to interpret.
### Functionality Details
The DPVO operates through a sequence of calculated steps that integrate volume data with price movement:
1. **Volume Impact Calculation**: This is the foundational step where the product of the EMA of volume and the EMA of price range (close - open) is calculated. This metric highlights trading sessions where significant volume accompanies substantial price movements, suggesting a strong market response.
2. **Dynamic Volume Oscillator (DVO)**: The heart of the indicator, the DVO, is derived by calculating the difference between the fast EMA and the slow EMA of the Volume Impact. This result is then normalized by dividing by the EMA of the volume over the same period to scale the output, making it consistent across various trading environments.
3. **Signal Generation**: The final output is smoothed using a simple moving average of the DVO to filter out market noise. Buy and sell signals are generated based on the crossover and crossunder of the DVO with its smoothed version, providing clear cues for market entry or exit.
### Originality
The DPVO's originality lies in its innovative integration of volume and price movement, a novel approach not typically observed in other volume indicators. By analyzing the product of volume and price change EMAs, the DPVO captures the essence of market dynamics more holistically than traditional tools, which often only reflect volume levels without contextualizing them with price actions. This dual analysis provides traders with a deeper understanding of market forces, enabling them to make more informed decisions based on a combination of volume surges and significant price movements. The DPVO also introduces a unique normalization and smoothing technique that refines the oscillator's output, offering cleaner and more reliable signals that are adaptable to various market conditions and trading styles.
### Practical Application
The DPVO excels in environments where volume plays a crucial role in validating price movements. Traders can utilize the buy and sell signals generated by the DPVO to enhance their decision-making process. The signals are plotted directly on the trading chart, with buy signals appearing below the price bars and sell signals above, ensuring they are prominent and actionable. This setup is particularly useful for day traders and swing traders who rely on timely and accurate signals to maximize their trading opportunities.
### Best Practices
To maximize the effectiveness of the DPVO, traders should consider the following best practices:
- **Market Selection**: Use the DPVO in markets known for strong volume-price correlation such as major forex pairs, popular stocks, and cryptocurrencies.
- **Signal Confirmation**: While the DPVO provides powerful signals, confirming these signals with additional indicators such as RSI or MACD can increase trade reliability.
- **Risk Management**: Always use stop-loss orders to manage risks associated with trading signals. Adjust the position size based on the volatility of the asset to avoid significant losses.
### Practical Example + How to use it
Practical Example1: Day Trading Cryptocurrencies
For a day trader focusing on the highly volatile cryptocurrency market, the DPVO can be an effective tool on a 15-minute chart. Suppose a trader is monitoring Bitcoin (BTC) during a period of high market activity. The DPVO might show an upward crossover of the DVO above its smoothed signal line while also indicating a significant increase in volume. This could signal that strong buying pressure is entering the market, suggesting a potential short-term rally. The trader could enter a long position based on this signal, setting a stop-loss just below the recent support level to manage risk. If the DPVO later shows a crossover in the opposite direction with decreasing volume, it might signal a good exit point, allowing the trader to lock in profits before a potential pullback.
- **Swing Trading Stocks**: For a swing trader looking at stocks, the DPVO could be applied on a daily chart. If the oscillator shows a consistent downward trend along with increasing volume, this could suggest a potential sell-off, providing a sell signal before a significant downturn.
You can look for:
--> Increase in volume - You can use indicators like 24-hour-Volume to have a better visualization
--> Uptrend/Downtrend in the indicator (HH, HL, LL, LH)
--> Confirmation (Buy signal/Sell signal)
--> Correct Price action (Not too steep moves up or down. Stable moves.) (Optional)
--> Confirmation with other indicators (Optional)
Quick image showing you an example of a buy signal on SOLANA:
### Technical Notes
- **Calculation Efficiency**: The DPVO utilizes exponential moving averages (EMAs) in its calculations, which provides a balance between responsiveness and smoothing. EMAs are favored over simple moving averages in this context because they give more weight to recent data, making the indicator more sensitive to recent market changes.
- **Normalization**: The normalization of the DVO by the EMA of the volume ensures that the oscillator remains consistent across different assets and timeframes. This means the indicator can be used on a wide variety of markets without needing significant adjustments, making it a versatile tool for traders.
- **Signal Line Smoothing**: The final signal line is smoothed using a simple moving average (SMA) to reduce noise. The choice of SMA for smoothing, as opposed to EMA, is intentional to provide a more stable signal that is less prone to frequent whipsaws, which can occur in highly volatile markets.
- **Lag and Sensitivity**: Like all moving average-based indicators, the DPVO may introduce a slight lag in signal generation. However, this is offset by the indicator’s ability to filter out market noise, making it a reliable tool for identifying genuine trends and reversals. Adjusting the `fastMA`, `slowMA`, and `signalSmooth` inputs allows traders to fine-tune the sensitivity of the DPVO to match their specific trading strategy and market conditions.
- **Platform Compatibility**: The DPVO is written in Pine Script™ v5, ensuring compatibility with the latest features and functionalities offered by TradingView. This version takes advantage of optimized functions for performance and accuracy in calculations, making it well-suited for real-time analysis.
Conclusion
The "Uptrick: Dual Moving Average Volume Oscillator" is a revolutionary tool that merges volume analysis with price movement to offer traders a more nuanced understanding of market trends and reversals. Its ability to provide clear, actionable signals based on a unique combination of volume and price changes makes it an invaluable addition to any trader's toolkit. Whether you are managing long-term positions or looking for quick trades, the DPVO provides insights that can help refine any trading strategy, making it a standout choice in the crowded field of technical indicators.
Nothing from this indicator or any other Uptrick Indicators is financial advice. Only you are ultimately responsible for your choices.

Uptrick: TimeFrame Trends: Performance & Sentiment Indicator### **Uptrick: TimeFrame Trends: Performance & Sentiment Indicator (TFT) - In-Depth Explanation**
#### **Overview**
The **Uptrick: TimeFrame Trends: Performance & Sentiment Indicator (TFT)** is a sophisticated trading tool designed to provide traders with a comprehensive view of market trends across multiple timeframes, combined with a sentiment gauge through the Relative Strength Index (RSI). This indicator offers a unique blend of performance analysis, sentiment evaluation, and visual signal generation, making it an invaluable resource for traders who seek to understand both the macro and micro trends within a financial instrument.
#### **Purpose**
The primary purpose of the TFT indicator is to empower traders with the ability to assess the performance of an asset over various timeframes while simultaneously gauging market sentiment through the RSI. By analyzing price changes over periods ranging from one week to one year, and complementing this with sentiment signals, TFT enables traders to make informed decisions based on a well-rounded analysis of historical price performance and current market conditions.
#### **Key Components and Features**
1. **Multi-Timeframe Performance Analysis:**
- **Performance Lookback Periods:**
- The TFT indicator calculates the percentage price change over several predefined timeframes: 7 days (1 week), 14 days (2 weeks), 30 days (1 month), 180 days (6 months), and 365 days (1 year). These timeframes provide a layered view of how an asset has performed over short, medium, and long-term periods.
- **Percentage Change Calculation:**
- The indicator computes the percentage change for each timeframe by comparing the current closing price to the closing price at the start of each period. This gives traders insight into the strength and direction of the trend over different periods, helping them identify consistent trends or potential reversals.
2. **Sentiment Analysis Using RSI:**
- **Relative Strength Index (RSI):**
- RSI is a widely-used momentum oscillator that measures the speed and change of price movements. It oscillates between 0 and 100 and is typically used to identify overbought or oversold conditions. In TFT, the RSI is calculated using a 14-period lookback, which is standard for most RSI implementations.
- **RSI Smoothing with EMA:**
- To refine the RSI signal and reduce noise, TFT applies a 10-period Exponential Moving Average (EMA) to the RSI values. This smoothed RSI is then used to generate buy, sell, and neutral signals based on its position relative to the 50 level:
- **Buy Signal:** Triggered when the smoothed RSI crosses above 50, indicating bullish sentiment.
- **Sell Signal:** Triggered when the smoothed RSI crosses below 50, indicating bearish sentiment.
- **Neutral Signal:** Triggered when the smoothed RSI equals 50, suggesting indecision or a balanced market.
3. **Visual Signal Generation:**
- **Signal Plots:**
- TFT provides clear visual cues directly on the price chart by plotting shapes at the points where buy, sell, or neutral signals are generated. These shapes are color-coded (green for buy, red for sell, yellow for neutral) and are positioned below or above the price bars for easy identification.
- **First Occurrence Trigger:**
- To avoid clutter and focus on significant market shifts, TFT only triggers the first occurrence of each signal type. This feature helps traders concentrate on the most relevant signals without being overwhelmed by repeated alerts.
4. **Customizable Performance & Sentiment Table:**
- **Table Display:**
- The TFT indicator includes a customizable table that displays the calculated percentage changes for each timeframe. This table is positioned on the chart according to user preference (top-left, top-right, bottom-left, bottom-right) and provides a quick reference to the asset’s performance across multiple periods.
- **Dynamic Text Color:**
- To enhance readability and provide immediate visual feedback, the text color in the table changes based on the direction of the percentage change: green for positive (upward movement) and red for negative (downward movement). This color-coding helps traders quickly assess whether the asset is in an uptrend or downtrend for each period.
- **Customizable Font Size:**
- Traders can adjust the font size of the table to fit their chart layout and personal preferences, ensuring that the information is accessible without being intrusive.
5. **Flexibility and Customization:**
- **Lookback Period Customization:**
- While the default lookback periods are set for common trading intervals (7 days, 14 days, etc.), these can be adjusted to match different trading strategies or market conditions. This flexibility allows traders to tailor the indicator to focus on the timeframes most relevant to their analysis.
- **RSI and EMA Settings:**
- The length of the RSI calculation and the smoothing EMA can also be customized. This is particularly useful for traders who prefer shorter or longer periods for their momentum analysis, allowing them to fine-tune the sensitivity of the indicator.
- **Table Position and Appearance:**
- The table’s position on the chart, along with its font size and colors, is fully customizable. This ensures that the indicator can be integrated seamlessly into any chart setup without obstructing key price data.
#### **Use Cases and Applications**
1. **Trend Identification and Confirmation:**
- **Short-Term Traders:**
- Traders focused on short-term movements can use the 7-day and 14-day performance metrics to identify recent trends and momentum shifts. The RSI signals provide additional confirmation, helping traders enter or exit positions based on the latest market sentiment.
- **Swing Traders:**
- For those holding positions over days to weeks, the 30-day and 180-day performance data are particularly useful. These metrics highlight medium-term trends, and when combined with RSI signals, they provide a robust framework for swing trading strategies.
- **Long-Term Investors:**
- Long-term investors can benefit from the 1-year performance data to gauge the overall health and direction of an asset. The indicator’s ability to track performance across different periods helps in identifying long-term trends and potential reversal points.
2. **Sentiment Analysis and Market Timing:**
- **Market Sentiment Tracking:**
- By using RSI in conjunction with performance metrics, TFT provides a clear picture of market sentiment. Traders can use this information to time their entries and exits more effectively, aligning their trades with periods of strong bullish or bearish sentiment.
- **Avoiding False Signals:**
- The smoothing of RSI helps reduce noise and avoid false signals that are common in volatile markets. This makes the TFT indicator a reliable tool for identifying true market trends and avoiding whipsaws that can lead to losses.
3. **Comprehensive Market Analysis:**
- **Multi-Timeframe Analysis:**
- TFT’s ability to analyze multiple timeframes simultaneously makes it an excellent tool for comprehensive market analysis. Traders can compare short-term and long-term performance to understand the broader market context, making it easier to align their trading strategies with the overall trend.
- **Performance Benchmarking:**
- The percentage change metrics provide a clear benchmark for an asset’s performance over time. This information can be used to compare the asset against broader market indices or other assets, helping traders make more informed decisions about where to allocate their capital.
4. **Custom Strategy Development:**
- **Tailoring to Specific Markets:**
- TFT can be customized to suit different markets, whether it’s stocks, forex, commodities, or cryptocurrencies. For instance, traders in volatile markets may opt for shorter lookback periods and more sensitive RSI settings, while those in stable markets may prefer longer periods for a smoother analysis.
- **Integrating with Other Indicators:**
- TFT can be used alongside other technical indicators to create a more comprehensive trading strategy. For example, combining TFT with moving averages, Bollinger Bands, or MACD can provide additional layers of confirmation and reduce the likelihood of false signals.
#### **Best Practices for Using TFT**
- **Regularly Adjust Lookback Periods:**
- Depending on the market conditions and the asset being traded, it’s important to regularly review and adjust the lookback periods for the performance metrics. This ensures that the indicator remains relevant and responsive to current market trends.
- **Combine with Volume Analysis:**
- While TFT provides a solid foundation for trend and sentiment analysis, combining it with volume indicators can further enhance its effectiveness. Volume can confirm the strength of a trend or signal potential reversals when divergences occur.
- **Use RSI with Other Momentum Indicators:**
- Although RSI is a powerful tool on its own, using it alongside other momentum indicators like Stochastic Oscillator or MACD can provide additional confirmation and help refine entry and exit points.
- **Customize Table Settings for Clarity:**
- Ensure that the performance table is positioned and sized appropriately on the chart. It should be easily readable without obstructing important price data. Adjust the text size and colors as needed to maintain clarity.
- **Monitor Multiple Timeframes:**
- Utilize the multi-timeframe analysis feature of TFT to monitor trends across different periods. This helps in identifying the dominant trend and avoiding trades that go against the broader market direction.
#### **Conclusion**
The **Uptrick: TimeFrame Trends: Performance & Sentiment Indicator (TFT)** is a comprehensive and versatile tool that combines the power of multi-timeframe performance analysis with sentiment gauging through RSI. Its ability to customize and adapt to various trading strategies and markets makes it a valuable asset for traders at all levels. By offering a clear visual representation of trends and market sentiment, TFT empowers traders to make more informed and confident trading decisions, whether they are focusing on short-term price movements or long-term investment opportunities. With its deep integration of performance metrics and sentiment analysis, TFT stands out as a must-have indicator for any trader looking to gain a holistic understanding of market dynamics.

BX-Volume Trend and OscillatorBX-Volume Trend and Oscillator (VTO)
This is my second indicator. I created this indicator for myself. I was inspired by the indicators created by Bjorgum, Duyck and QuantTherapy and decided to create multiple indicators that either work well combined with their indicators or something new that applies some of their indicator concepts. I decided to share this because I believe in learning and earing together as a community. I will later share the rest of the indicators I have created. If you guys have any questions or suggestions write them.
The BX-Volume Trend and Oscillator (VTO) is a comprehensive trading indicator designed to help traders identify trends, momentum shifts, and potential reversals by analyzing volume and price action through various metrics. This indicator combines relative volume analysis with custom Xtrender oscillators and moving averages to provide valuable insights into market behavior.
Image: BX-Volume Trend and Oscillator (VTO)
Features:
Relative Volume Analysis: Measures the current volume relative to the average volume over a specified period, helping traders understand if the current trading activity is unusually high or low.
Short-Term Xtrender Oscillator: This oscillator analyzes the difference between two short-term Exponential Moving Averages (EMAs) and smooths it with a custom RSI, highlighting short-term trends and potential reversal points.
Long-Term Xtrender Oscillator: Similar to the short-term oscillator but uses longer-term EMAs and RSI for identifying more sustained trends and shifts.
T3 Moving Average: A smoothed version of the Xtrender oscillator that helps in detecting trend changes more clearly.
Volume Trend Plot: Shows the smoothed relative volume to understand how trading activity aligns with the trend.
Visual Indicators: Uses colors and shapes to highlight significant changes and trends, such as circles to mark potential reversal points.
How to Use the Indicator
Analyze Relative Volume:
Relative Volume Plot: The smoothed relative volume is displayed in white, helping you assess if current trading volumes are above or below the historical average.
High Relative Volume: Indicates strong trading interest, which could support or contradict the prevailing trend.
Image above: is set to daily timeframe
Monitor Short-Term Xtrender Oscillator
Short-Term Xtrender: Plotted as a column histogram with colors changing from green to red based on the oscillator's movement and momentum. Green and lime colors indicate bullish trends, while maroon and red suggest bearish conditions.
Smoothed Short-Term Xtrender (T3): Plotted as a line that adjusts color based on the short-term Xtrender's trend. The line changes color to match the histogram's color, providing a clearer view of momentum shifts.
Reversal Markers: Small circles indicate potential short-term trend reversals, where changes in the T3 moving average suggest shifts in momentum.
Assess Long-Term Xtrender Oscillator:
Long-Term Xtrender: Plotted as a histogram, with color changes similar to the short-term Xtrender. It shows longer-term trends and shifts.
Color Indicators: Lime and green colors suggest an uptrend, while red and maroon indicate a downtrend.
Look for Zero Line Crossings:
The zero line serves as a reference point. Crossings above the zero line may indicate bullish trends, while crossings below may signal bearish trends.
Image above: is set to daily timeframe, and it showcases the Short-Term Xtrender (T3) applied.
Image above: is set to 8hr timeframe: Using the lower timeframe you can spot better details of pullbacks and potential reversals.
Example of Use:
Identify Trend and Momentum: Use the combination of the short-term and long-term Xtrender oscillators to gauge the prevailing market trend. For instance, if both oscillators are above zero and showing upward momentum, it suggests a strong bullish trend.
Spot Reversals: Observe the short-term Xtrender and its smoothed T3 version. If the T3 line changes direction and crosses through previous peaks and troughs, it could signal a potential reversal.
Volume Confirmation: Check the relative volume and its smoothed version to confirm the strength of price movements. Significant changes in volume can validate the trends indicated by the Xtrender oscillators.
By combining these elements, the BX-Volume Trend and Oscillator (VTO) provides a holistic view of market dynamics, helping traders make more informed decisions based on trend strength, potential reversals, and volume activity.
Lastly, my Scripts/Indicators/Ideas /Systems that I share are only for educational purposes!
