ICT MTF FVG [MK]FVGs (Fair Value Gaps) are significant levels that may act as support or resistance to price. The script finds FVGs as per ICT trading system, then plots the full FVG to the right side of the chart. FVG boxes do not change size when they are semi-mitigated as its important to know where the original FVG midpoint lies. Plotting to the right side of price allows for a cleaner chart. The script is MTF and can display FVG boxes for the following timeframes. Chart, 5,10,15,30,1hr,4hr,8hr,12hr,D,W,M.
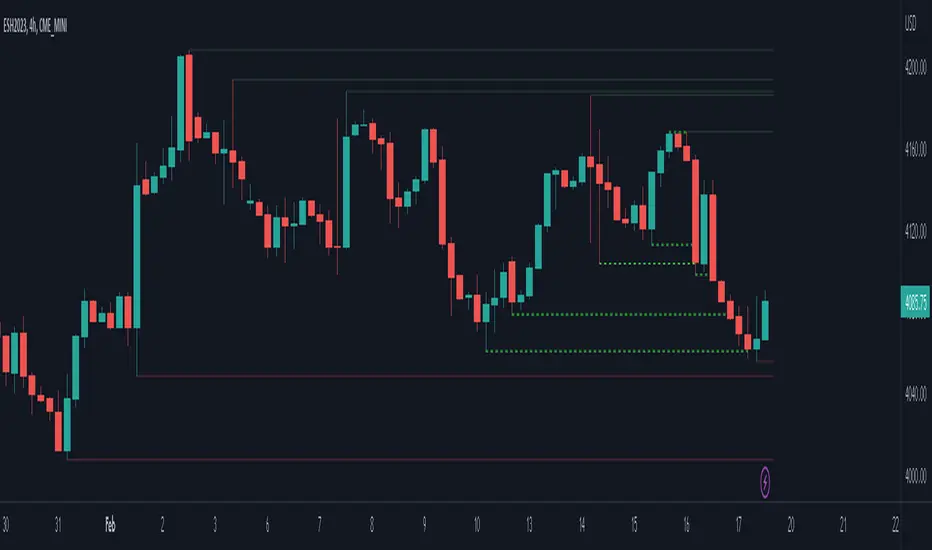
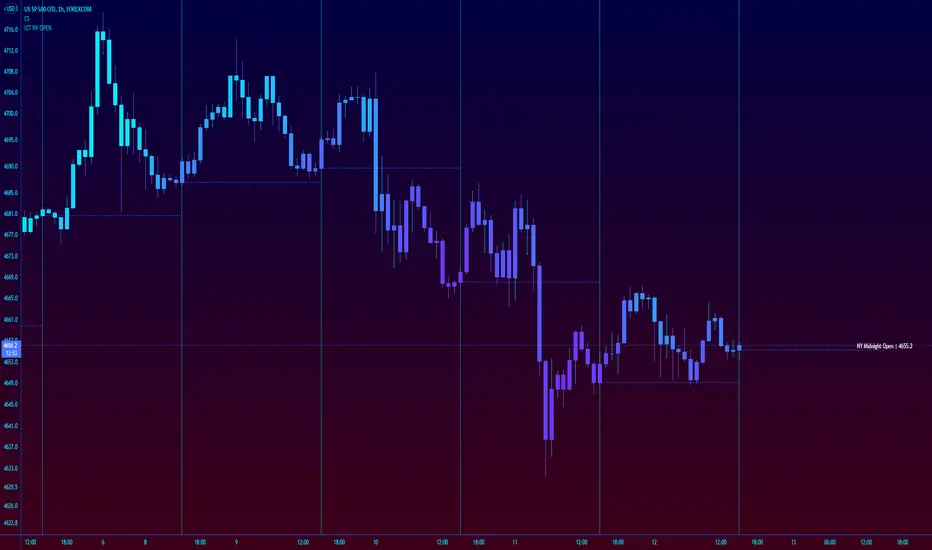
Below shows 1hr FVGs marked out. NOTE: this is not what the script does, this is for explanation only.
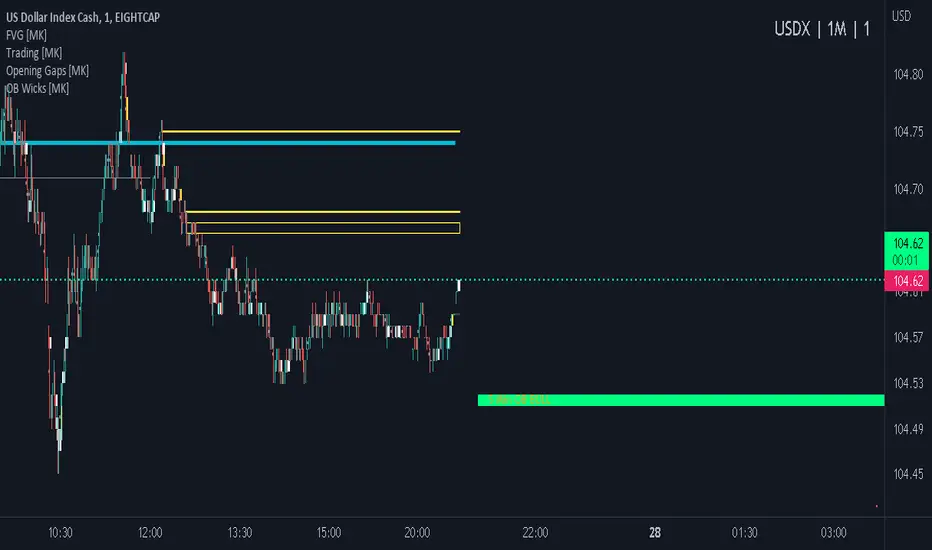
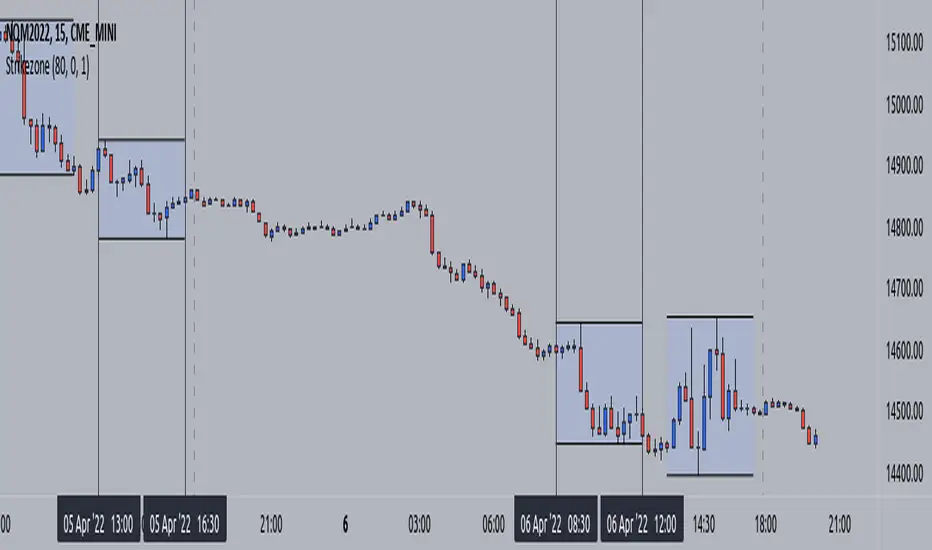
Below shows what the script will do. 1hr FVGs shown on 15min chart
Pine Script® göstergesi