Fair Value Gaps (FVG)This indicator automatically detects Fair Value Gaps (FVGs) using the classic 3-candle structure (ICT-style).
It is designed for traders who want clean charts and relevant FVGs only, without the usual clutter from past sessions or tiny, meaningless gaps.
Key Features
• Bullish & Bearish FVG detection
Identifies imbalances where price fails to trade efficiently between candles.
• Automatic FVG removal when filled
As soon as price trades back into the gap, the box is deleted in real time – no more outdated zones on the chart.
• Only shows FVGs from the current session
At the start of each new session, all previous FVGs are cleared.
Perfect for intraday traders who only care about today’s liquidity map.
• Flexible minimum gap size filter
Avoid noise by filtering FVGs using one of three modes:
Ticks (based on market tick size)
Percent (relative to current price)
Points (absolute price distance)
• Right-extension option
Keep gaps extended forward in time or limit them to the candles that created them.
Why This Indicator?
Many FVG indicators overwhelm the chart with zones from previous days or tiny imbalances that don’t matter.
This version keeps things clean, meaningful, and real-time accurate, ideal for day traders who rely on market structure and liquidity.
"ict" için komut dosyalarını ara

QuantMotions - FVG with Volume TrackingFair Value Gap Detector with Dynamic Shrinking & Volume Analysis
Overview
Advanced Fair Value Gap (FVG) detection indicator with real-time box shrinking and volume delta analysis. Automatically identifies price inefficiencies and tracks institutional volume flow within each gap.
What are Fair Value Gaps?
Fair Value Gaps occur when price moves so rapidly that a "gap" is left between three consecutive candles, creating an inefficiency where no trading occurred. These gaps often act as support/resistance zones that price tends to revisit.
Detection:
- Bullish FVG: When low > high (upward price inefficiency)
- Bearish FVG: When high < low (downward price inefficiency)
Key Features
Dynamic Box Shrinking
FVG boxes automatically shrink as price enters them:
- Bullish FVGs shrink from top as price moves down into the gap
- Bearish FVGs shrink from bottom as price moves up into the gap
- Provides precise visualization of remaining unfilled gap area
Volume Delta Analysis
Tracks volume characteristics for the 3-candle FVG formation:
- Total Volume: Sum of volume from all three FVG candles
- Up/Down Split: Separates buying vs selling pressure
- Delta %: Shows directional bias of volume flow
- Color Coding: Green/Red when volume confirms direction, Orange when it doesn't
Smart Filtering
- ATR-based minimum gap size - Filters out insignificant noise gaps
- Auto-cleanup - Removes fully filled FVGs automatically
- Maximum display limit - Keeps charts clean by limiting visible FVGs
Live Statistics
Real-time stats table showing:
- Active bullish/bearish FVG count
- Average volume delta for each direction
- Fill progress tracking
Settings
Min Gap Size (ATR): Minimum gap size as multiple of ATR(14). Default: 0.3
- Lower values (0.1-0.3): More sensitive, shows smaller gaps
- Higher values (0.5-1.0): More selective, only significant gaps
Max FVGs: Maximum number of FVG boxes to display (5-100)
Remove Fully Filled: Automatically remove FVGs when price completely fills them
Shrink on Partial Fill: Enable dynamic box shrinking as price enters gaps
Show Volume Info: Display volume delta labels at box edges
How to Use
1. Confluence Trading: Look for FVGs that align with your support/resistance levels
2. Volume Confirmation: Check volume delta - strong directional volume increases probability
3. Partial Fills: Watch for price reactions at shrinking FVG boundaries
4. Multiple Timeframes: Use on higher timeframes (4H+) for swing trading, lower timeframes for scalping
Best Practices
- Combine with trend analysis - FVGs in trend direction have higher fill rates
- Pay attention to volume delta - gaps with confirming volume are more reliable
- Use on liquid markets for accurate volume data
- Higher timeframe FVGs typically carry more significance
Notes
- Works on all timeframes and instruments
- Volume data accuracy depends on your data provider
- FVGs are not guaranteed support/resistance - use proper risk management
- This indicator shows historical inefficiencies, not future predictions
Disclaimer: This indicator is for educational purposes only. Past performance does not guarantee future results. Always use proper risk management.

Smart Money COTThis indicator implements the method of analysing COT data as defined by Michael Huddleston (I.E. The Inner Circle Trader). It removes all superfluous information contained in the standard COT reports and focusses only on Commercial speculators using the overall Long-Short positions.
Features
The unique feature of this indicator is its ability to look back over time and provide the following information:
Calculation of the range high and low of the specified lookback range.
Calculation of equilibrium of that range.
Automatic colour coding of net long and net short positions when the Long-Short COT calculation is above or below equilibrium of the lookback range.
Instructions
Use the Daily Timeframe only. You may get unexpected results on other timeframes.
Ensure the asset has COT data available. Script is mainly focused on commodity futures, such as ES, NQ, YM. It has not been tested against Forex.
You will need to define the "Lookback" setting in the script settings. Use the total number of trading days required for your analysis. E.g. if you want a 6 month COT analysis, use the measurement tool to count the quantity of daily candles between now and 6 months ago - use this as your Lookback setting. Adjust as needed for other lookback periods, e.g. 3 months, 12 months etc.
Other Info
The script provides the ability to customise colours in its settings.
Range High and Range Low plots can be disabled in settings.

[JAMJAM] v3This indicator is developed based on ICT concepts, focusing on identifying liquidity pools and order blocks within the market structure. It helps in visualizing high-probability setups by filtering out market noise. The script is part of a comprehensive trading system aimed at automating the detection of smart money movements. It is strictly for private analysis and forward testing.

jhehli LiquidityWhat are BSL and SSL?
In the context of Smart Money Concepts, liquidity simply refers to pending orders—specifically Stop Losses and Buy/Sell Stop orders—resting above old highs and below old lows.
BSL (Buy-Side Liquidity): This is found above Swing Highs. Retail traders who are short the market will place their "Buy Stop" protective orders here. Additionally, breakout traders place "Buy Limit" orders here. Smart Money views this area as a pool of willing buyers. To fill large sell orders, institutions must drive price up into this liquidity to pair their massive sell interest with these buy stops.
SSL (Sell-Side Liquidity): This is found below Swing Lows. Retail traders who are long the market place their "Sell Stop" protective orders here. Smart Money targets these levels to accumulate long positions. They need the market to sell off into these levels so they can buy from the willing sellers at a discount.
How this Indicator Works
This tool automates the process of market structure analysis by identifying key Swing Highs and Swing Lows.
Detection: It scans price action to find fractal highs and lows (classic swing points) where price has rejected a level.
Visualization: It projects a line from these points, clearly marking where the "stops" are likely residing.
Liquidity Raids: When price pierces these levels, it is considered a "Liquidity Raid" or "Stop Hunt."
How to Use This in Your Trading
Do not treat these lines simply as Support and Resistance. In the ICT methodology, old highs and lows are targets, not barriers.
For Reversals: Wait for a "Turtle Soup" or "Judas Swing." This occurs when price aggressively expands into a BSL or SSL level to trigger stops, only to quickly reverse back into the trading range. This indicates that Smart Money has finished their accumulation or distribution.
For Bias: If the higher timeframe trend is Bullish, expect SSL to be raided to fuel the move, while BSL becomes the target (Draw on Liquidity).
By using this indicator, you remove the guesswork of manually marking every swing point, allowing you to focus on price action and the reaction at these critical liquidity pools.

SMC Trend Reversal by Pooja🌟 SMC Trend Reversal by Pooja — CHoCH + BOS + RSI Confirmation
🔥 Smart Money Concepts • Trend Reversal Detection • Multi-Asset Optimized
The SMC Trend Reversal by Pooja is a powerful market-structure indicator designed for traders who follow Smart Money Concepts (SMC) and want to identify trend reversals, BOS, and CHoCH with high clarity.
It blends pivot-based structure breaks, RSI confirmation, and an optional session filter, giving traders a clean and reliable view of market shifts across Crypto, Forex, Indices, and Equity Derivatives.
✨ 🔰 Why SMC Matters in Crypto & Forex?
Both Crypto and Forex markets:
Trade 24/7 / 5 days with high volatility
React strongly to liquidity zones, market structure shifts, and smart money footprints
Often reverse sharply after liquidity grabs
Follow clean CHoCH → BOS → Trend progression sequences
This is why CHoCH (Change of Character) and BOS (Break of Structure) are crucial tools used by professional SMC traders to catch early trend reversals.
This indicator automates that process for you.
No clutter. No repaints. No noise.
Just pure SMC structure.
🚀 Key Features
🟣 CHoCH Detection (Change of Character)
Detects when the market shifts direction
A CHoCH appears when the trend flips from down → up or up → down
Highlights the earliest sign of a trend reversal
Draws a clean CHoCH line across structure
Works beautifully in volatile markets like Crypto & Forex
🔵 BOS Detection (Break of Structure)
Identifies structural continuation in the same direction
Helps confirm the new trend after CHoCH
Clear BOS lines to visualize progression of market flow
Ideal for trend-following and breakout traders
🧠 RSI-Based Confirmation (Optional)
To avoid fake CHoCH signals, the indicator uses RSI filtering:
RSI > Upper Level → Show “B” Buy Label
RSI < Lower Level → Show “S” Sell Label
This improves accuracy especially in:
Fast crypto markets (BTC, ETH, SOL etc.)
Liquidity-driven assets (Forex, Indices)
⏱️ Session Block (Asia/Kolkata Compatible)
Avoid signals in the first few minutes of market open or in volatile windows.
Block signals in a selected time range
Perfect for Indian market opening volatility (09:00–09:25)
🎯 Clean, Minimal, Easy-to-Read Visuals
✔ Horizontal structural lines
✔ Color-coded CHoCH and BOS
✔ Buy (B) / Sell (S) labels only when meaningful
✔ No unnecessary clutter
✔ Suitable for both beginners and advanced SMC traders
📢 Built-In Alerts
Receive notifications for:
🔔 Bullish CHoCH
🔔 Bearish CHoCH
🔔 Bullish BOS
🔔 Bearish BOS
Perfect for mobile, desktop, and webhook automation.
📈 How It Helps Your Trading
✔ Catch early trend reversals with confidence
✔ Avoid false signals with RSI filtering
✔ Trade like Smart Money (Institutional concepts)
✔ Works on all timeframes — scalping to swing
✔ Specially powerful on Crypto & Forex due to their structure-driven nature
✔ Cleaner charts → Better decisions → Higher probability trades
🧩 Who Should Use This Indicator?
✔ SMC / ICT style traders
✔ Breakout and trend-following traders
✔ Reversal traders
✔ Crypto & Forex scalpers
✔ Option buyers looking for early trend shifts
✔ Intraday NIFTY / BANKNIFTY traders
⚠️ Disclaimer
This indicator is for educational purposes and market analysis only.
It does not guarantee profits. Always practice risk management and test your settings before using it live.

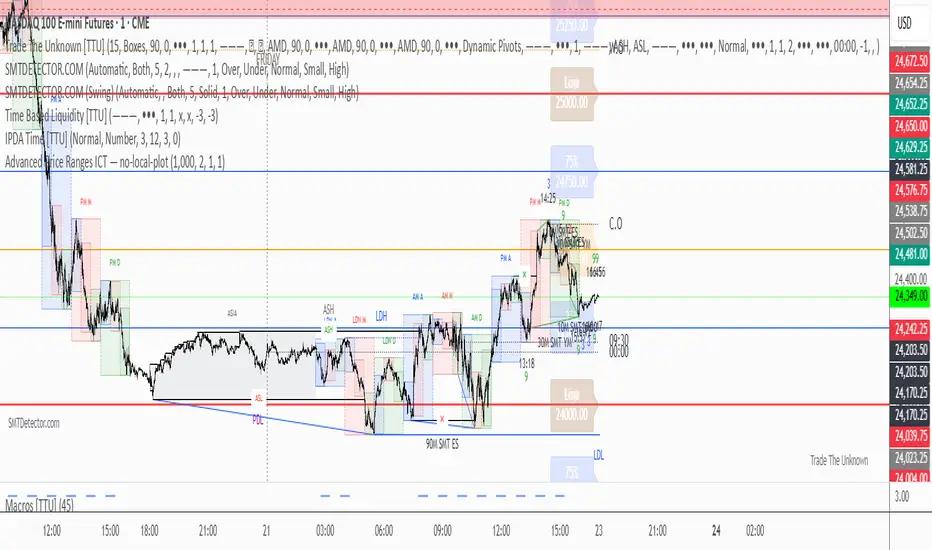
Advanced Price Ranges — Izaak ButlerThis indicator automatically draws equally-spaced price ranges (based on a user-defined size) above and below the current price. Each range displays its High, Low, 50% midpoint, and 25/75% quarter levels. All lines now extend both forward and backward in time, covering the entire chart. Labels are added on the right edge for easy reference, and optional alerts trigger when price crosses key levels. This tool helps visualize structured price zones and ICT-style range behaviour across all market conditions.
30s Model IndicatorThe Model
The 30s model is a NASDAQ (NQ) scalping strategy based on entries within 30-second fair-value gaps (FVGs), formed after liquidity is taken on a higher timeframe.
What the Indicator Does
The indicator identifies liquidity sweeps: swing highs/lows with at least "Left Pivot" bars to the left, capturing at least one prior swing high/low.
It then detects if a 30s FVG formed within "FVG Distance from Swing" bars of the latest liquidity-taking swing high/low.
If found, it verifies the FVG meets the "Minimum FVG Size" and that forming candles didn't hit the take-profit level.
When conditions match, the FVG is highlighted with entry, take-profit, and stop-loss lines, plus optional price labels. The appearance of all the elements can be customized in the indicator settings.
You can also setup alerts on the indicator that will trigger whenever a valid 30s is formed.
Error Conditions
Not running on 30s time-frame
Not using NQ, or MNQ

TradeBeard Larry Williams A/D + Classic DivergenceName: TradeBeard – Larry Williams A/D + Classic Divergence
What it does:
This indicator plots a classic Larry Williams Accumulation/Distribution (A/D) line, using:
(Close−Open)/(High−Low)×Volume
It then looks at price swings vs. A/D swings and marks true Larry-style divergences:
Bull Div – Price makes a lower low, but the A/D line makes a higher low → buying pressure/accumulation.
Bear Div – Price makes a higher high, but the A/D line makes a lower high → selling pressure/distribution.
Lines are drawn between the two pivots on the A/D line, with a label at the most recent pivot.
How to use / read it:
Use on any timeframe; the logic is the same.
Look for Bull Div near potential bottoms as confirmation that smart money is quietly buying.
Look for Bear Div near potential tops as confirmation that smart money is unloading.
Settings:
Pivot left bars (price) / Pivot right bars (price)
Controls how “wide” a swing high/low must be.
1 / 1 ≈ very sensitive (ICT/Larry-style 3-bar swings).
Higher values = fewer but cleaner swings and fewer signals.
Show bullish divergences / Show bearish divergences
Turn each signal type on or off.
Bullish color (line + label) / Bearish color (line + label)
Color of the divergence lines and label background.
Bullish label text color / Bearish label text color
Text color inside the Bull Div / Bear Div labels.
That’s it: pure Larry Williams A/D flow, price-based pivots, and clean visual divergence signals, wrapped in a TradeBeard skin.
I hope this will help you in your trading.
// Disclaimer:
// This script is for educational and informational purposes only.
// Trading and investing involve risk. You are fully responsible for your own decisions,

8FigRenko – Precision FVG Zones8FigRenko – Pure FVG Zones is a clean, reliable Fair Value Gap tool designed for traders who want accurate FVG zones only from the chart timeframe — without repainting, without higher-timeframe complications, and without messy borders.
This script is built for traders who want simple, precise, and visually clean imbalance zones that work the way FVGs should work:
🔥 Features
✔ Chart-timeframe FVGs only
No request.security, no multi-TF artifacts, no lagging or repainting.
The script reads exactly what your chart shows and never mixes timeframes.
✔ Wick-based or Body-based detection
Use classic ICT wick gaps, or switch to body-only gaps with one click.
✔ Minimum FVG size (points)
Filters out noise by requiring a minimum point distance (default: 5 points).
Great for futures and fast intraday charts.
✔ Clean, seamless boxes (no borders)
The FVG zones are rendered with borderless boxes, matching the modern style shown in institutional imbalance tools.
✔ Proper “end-to-end” FVG drawing
Each gap box starts from the origin of the imbalance and extends forward automatically.
✔ Auto-disrespect removal
FVGs are automatically deleted when price invalidates the zone:
Bullish FVG removed if close < FVG low
Bearish FVG removed if close > FVG high
No clutter. No manual cleanup.
✔ Extend zones forever or to the current bar
Choose if your FVGs run across the full future chart or just up to the latest candle.
✔ Optional: show only most recent FVG
Great for scalping or IFV (Immediate Fair Value) strategies.

Magnus Bestest 3This indicator is a sophisticated version of my Magnus Bestest signature move only as this script is highly advanced and has a huge amount of lines of code and structures so I had to create a new separate indicator for it. It signals only when there is a very nice liquidity and broken pivot points, confirming a truly nice trade opportunity.
My indicators so far that you can find and use:
1.) Magnus Bestest - full of various signals like liquidity signals, reversal signals, top/bottom ICT style signals, liquidity power candles showing big institutions joining the moves.
2.) Magnus Bestest 2 - My signature moves to clean liquidity = quality signals but not so often.
3.) Magnus Bestest 3 - Latest and most powerful signals. I finally captured my signature move in it's most powerful form. Biggest advantages are: Extreme precision, many trades on 1,2,3,4,5 minute TimeFrames so you can be sure to get at least 10 signals per day and very sim0le unambiguous entries and SL/TP levels making it a monkey-style indicator avoiding most possibilities to do human errors.
DISCLAIMER: I'm not a financial adviser and this is not a financial advise, just for educational purposed. Remember, most traders lose money.

Change in State of Delivery CISD [AlgoAlpha]🟠 OVERVIEW
This script tracks how price “changes delivery” after failed attempts to push in one direction. It builds swing levels from pivots, watches for those levels to be wicked, and then checks if price delivers cleanly in the opposite direction. When the pattern meets the script’s tolerance rules, it marks a Change in State of Delivery (CISD). These CISD levels are drawn as origin lines and are used to spot shifts in intent, failed pushes, and continuation attempts. A CISD becomes stronger when it forms after opposing liquidity is swept within a defined lookback.
🟠 CONCEPTS
The script first defines structure using swing highs/lows. These levels act as potential liquidity points. When price wicks through a swing, the script registers a mitigation event. After this, it looks for a reversal-style candle sequence: a failed push, followed by a counter-move strong enough to pass a tolerance ratio. This ratio compares how far price expanded away from the failed attempt versus the counter-move that followed. If the ratio is high enough, this becomes a CISD. The idea is simple: liquidity interaction sets context , and the tolerance logic identifies actual intent . CISD levels and sweep markers combine these two ideas into a clean map of where delivery flipped.
🟠 FEATURES
Liquidity tracking: marks swing highs/lows and updates them until expiry
Liquidity sweep confirmation when CISD aligns with recent mitigations
Alert conditions for all key events: mitigations, CISDs, and strong CISDs
🟠 USAGE
Setup : Add the script to your chart. Use it on any timeframe where swing behavior matters. Set the Swing Period for how wide a pivot must be. Set Noise Filter to control how strict the CISD detection is. Liquidity Lookback defines how recent a wick must be to confirm a sweep.
Read the chart : Origin lines mark where the CISD began. A green line signals bullish intent; a red line signals bearish intent. ▲ and ▼ shapes show CISDs that form after liquidity is swept, these mark strong signals for potential entry. Swing dots show recent swing highs/lows. Candle colors follow the latest CISD trend.
Settings that matter : Increasing Swing Period produces fewer but stronger swings. Raising Noise Filter requires cleaner counter-moves and reduces false CISDs. Liquidity Lookback controls how strict the sweep confirmation is. Expiry Bars decides how long swing levels remain active.

Thiru 369 LabelsThiru 369 Labels
**Thiru 369 Labels** is a sophisticated time-based indicator that calculates the numerical sum of time digits and displays visual labels when the sum matches harmonic values (3, 6, or 9). Based on the mathematical principles popularized by Nikola Tesla, this indicator helps traders identify potential market timing opportunities during major trading sessions.
📊 What It Does
This indicator monitors the current time (hour and minute) and calculates the sum of all digits, reducing it to a single digit. When this final sum equals 3, 6, or 9, a label is displayed on the chart. The indicator specifically focuses on three major trading sessions:
- **London Session**: 02:30 - 07:00 (GMT-5)
- **NY AM Session**: 07:00 - 11:30 (GMT-5)
- **NY PM Session**: 11:30 - 16:00 (GMT-5)
🔢 How It Works
### Time Sum Calculation
The indicator uses a standard mathematical reduction method:
1. **Extract Digits**: Takes the hour and minute (e.g., 09:51)
2. **Sum All Digits**: Adds all digits together (0 + 9 + 5 + 1 = 15)
3. **Reduce to Single Digit**: Continues reducing until single digit (15 → 1 + 5 = 6)
4. **Check Match**: If result equals 3, 6, or 9, displays label
Examples:
- **03:30** → 0 + 3 + 3 + 0 = **6** ✅ (Perfect 6)
- **12:06** → 1 + 2 + 0 + 6 = **9** ✅ (Perfect 9)
- **09:51** → 0 + 9 + 5 + 1 = 15 → 1 + 5 = **6** ✅
- **14:22** → 1 + 4 + 2 + 2 = 9 ✅ (Perfect 9)
Session Detection
The indicator automatically detects when the current time falls within active trading sessions and only displays labels during these periods. This ensures you're only seeing relevant timing signals during market hours.
Cycle Detection
The indicator can also detect different time cycles within sessions:
- **90-minute cycles**: Major session periods
- **30-minute cycles**: Sub-cycles within sessions
- **10-minute cycles**: Detailed intervals
🎯 Key Features
✅ Time Sum Detection
- Calculates time sum using standard 369 method
- Displays labels when sum matches 3, 6, or 9
- Customizable target sums (default: 3, 6, 9)
✅ Session Monitoring
- London Session (02:30 - 07:00)
- NY AM Session (07:00 - 11:30)
- NY PM Session (11:30 - 16:00)
- Enable/disable individual sessions
✅ Cycle Detection
- 90-minute cycles
- 30-minute cycles
- 10-minute cycles
- Optional cycle information display
✅ Visual Customization
- Label size options (Auto, Tiny, Small, Normal, Large, Huge)
- Custom colors for each sum (3, 6, 9)
- Session-based colors (Purple=London, Green=NY AM, Blue=NY PM)
- Label transparency control
- Text-only labels (no background box)
✅ Display Options
- Show/hide time text
- Show/hide cycle information
- Drawing limit options (Current Day, Last 2/3/5 Days, All Days)
- Debug table for real-time monitoring
✅ Advanced Settings
- Timezone selection (27 timezone options)
- Swing sensitivity for label positioning
- Label offset control
- Confirmed bars only option
📖 How to Use
Step 1: Add Indicator to Chart
1. Open TradingView
2. Click "Indicators" button
3. Search for "Thiru 369 Labels"
4. Click to add to chart
Step 2: Configure Basic Settings
**Time Sum Settings:**
- Enable Time Sum Detection: ✅ (default: ON)
- Target Sums: "3,6,9" (default)
- Label Size: Choose your preferred size
- Drawing Limit: "All Days" (default) or limit to specific periods
**Session Settings:**
- Monitor London Session: ✅ (default: ON)
- Monitor NY AM Session: ✅ (default: ON)
- Monitor NY PM Session: ✅ (default: ON)
**Cycle Settings:**
- 90 Minute Cycles: ✅ (default: ON)
- 30 Minute Cycles: ✅ (default: ON)
- 10 Minute Cycles: ✅ (default: ON)
Step 3: Customize Appearance
**Label Colors:**
- Use Custom Sum Colors: OFF (default) - Uses session colors
- OR Enable to use: Blue (3), Red (6), Maroon (9)
**Display Settings:**
- Label Transparency: Adjust as needed
- Show Time Text: Optional
- Show Cycle Information: Optional
- Show Debug Table: ✅ (recommended for monitoring)
Step 4: Set Timezone
**General Settings:**
- Session Timezone: Select your timezone (default: GMT-5)
- Choose from 27 timezone options
Step 5: Monitor Labels
- Labels will automatically appear when:
- Time sum equals 3, 6, or 9
- Current time is within an active session
- Drawing limit allows it
💡 Use Cases
1. Market Timing Entries
Use 3, 6, 9 labels as potential entry signals when combined with other technical analysis:
- Wait for label to appear
- Confirm with price action
- Enter trade with proper risk management
2. Session Analysis
Identify optimal trading times within sessions:
- Monitor which sessions show most labels
- Track label frequency per session
- Plan trading around high-frequency periods
3. Cycle Recognition
Understand market rhythm patterns:
- 90-minute cycles for major moves
- 30-minute cycles for intermediate moves
- 10-minute cycles for precise timing
4. Time-Based Confirmation
Use labels to confirm other indicators:
- Combine with price action
- Use with support/resistance levels
- Confirm with volume analysis
⚙️ Settings Overview
Time Sum Settings
- **Enable Time Sum Detection**: Master switch for the indicator
- **Target Sums**: Comma-separated list of target values (default: "3,6,9")
- **Label Size**: Size of displayed labels
- **Show Time Text**: Display time along with sum
- **Show Cycle Information**: Display cycle type (90m, 30m, 10m)
- **Drawing Limit**: Limit labels to specific time periods
- **Show Debug Table**: Real-time monitoring table
- **Only Show on Confirmed Bars**: Wait for bar confirmation
Session Settings
- **Monitor London Session**: Enable/disable London session (02:30-07:00)
- **Monitor NY AM Session**: Enable/disable NY AM session (07:00-11:30)
- **Monitor NY PM Session**: Enable/disable NY PM session (11:30-16:00)
Cycle Settings
- **90 Minute Cycles**: Enable 90-minute cycle detection
- **30 Minute Cycles**: Enable 30-minute cycle detection
- **10 Minute Cycles**: Enable 10-minute cycle detection
Display Settings
- **Label Transparency**: Control label background transparency
Label Colors
- **Color for Sum 3**: Custom color for sum = 3
- **Color for Sum 6**: Custom color for sum = 6
- **Color for Sum 9**: Custom color for sum = 9
- **Use Custom Sum Colors**: Toggle between custom and session colors
General Settings
- **Session Timezone**: Select timezone for calculations (27 options)
- **Swing Sensitivity**: Bars for swing detection
- **Label Offset**: Vertical spacing for labels
🔍 Debug Table
The debug table provides real-time information:
- **Time**: Current time with seconds
- **Sum**: Calculated time sum
- **Session**: Active session (London, NY AM, NY PM, or None)
- **Cycle**: Active cycle (90min, 30min, 10min, or None)
- **Status**: Match status (MATCH! or No Match)
- **Targets**: Configured target sums
- **Next**: Next potential sum value
Enable the debug table to monitor the indicator's calculations in real-time.
📊 Examples
Example 1: Perfect 6
**Time**: 03:30
**Calculation**: 0 + 3 + 3 + 0 = 6
**Result**: Label "6" appears (if in active session)
Example 2: Perfect 9
**Time**: 12:06
**Calculation**: 1 + 2 + 0 + 6 = 9
**Result**: Label "9" appears (if in active session)
Example 3: Reduced to 6
**Time**: 09:51
**Calculation**: 0 + 9 + 5 + 1 = 15 → 1 + 5 = 6
**Result**: Label "6" appears (if in active session)
Example 4: Reduced to 3
**Time**: 11:10
**Calculation**: 1 + 1 + 1 + 0 = 3
**Result**: Label "3" appears (if in active session)
🎨 Visual Features
Label Display
- **Text Only**: Clean text labels without background boxes
- **Color Coded**: Different colors for different sums or sessions
- **Smart Positioning**: Labels positioned above/below candles based on swing detection
- **Adaptive Offset**: Automatic spacing to avoid overlap
Session Colors (Default)
- **London Session**: Purple labels
- **NY AM Session**: Green labels
- **NY PM Session**: Blue labels
Custom Colors (Optional)
- **Sum 3**: Blue
- **Sum 6**: Red
- **Sum 9**: Maroon
📜 License & Attribution
**Copyright**: © 2025 ThiruDinesh
**License**: Mozilla Public License 2.0
**Contact**: TradingView @ThiruDinesh
This indicator is based on mathematical principles of numerical reduction and harmonic numbers, concepts popularized by Nikola Tesla and used in various trading methodologies.

Thiru TOI TrackerThiru TOI Tracker - Time of Interest Trading Indicator
OVERVIEW
Thiru TOI Tracker identifies critical Time-of-Interest (TOI) windows during major trading sessions. This proprietary indicator automatically marks key institutional trading times with dynamic line extensions that adapt to price action, helping traders identify optimal entry and exit points.
KEY FEATURES
• Three Major Sessions: London (2:45-3:15 AM & 3:45-4:15 AM), NY AM (9:45-10:15 AM & 10:45-11:15 AM), NY PM (1:45-2:15 PM & 2:45-3:15 PM EST)
• Dynamic Line Extension: Lines automatically extend based on price action, creating adaptive support/resistance levels
• Multi-Session Tracking: Monitor multiple sessions simultaneously with independent customization
• Intelligent Memory Management: Automatic cleanup maintains optimal performance
• Customizable Visuals: Colors, line styles, labels, and timeframe filtering
HOW IT WORKS
The indicator uses proprietary time window detection to identify 30-minute TOI windows within major trading sessions. When a window becomes active, it draws vertical lines at start/end times with horizontal extensions. Lines dynamically extend upward when price breaks above them, creating adaptive support/resistance levels that respond to market conditions.
USAGE
1. Set "Draw Timing Limit" (recommended: "5" for 5m and below)
2. Enable sessions you trade in "Session Settings"
3. Customize colors and line styles in "Visual Settings"
4. Watch for vertical lines at TOI window start times
5. Use dynamic line extensions as support/resistance levels
BEST PRACTICES
• Use on lower timeframes (1m, 5m, 15m) for best results
• Enable only sessions you actively trade
• Combine with price action analysis for entry/exit decisions
• Monitor multiple sessions to identify confluence zones
• Adjust colors to match your chart theme
SETTINGS
Session Settings: Enable/disable individual time windows for London, NY AM, NY PM
Visual Settings: Customize colors, line styles (Solid/Dotted/Dashed), width (1-5), labels, and extension
Timeframe Filter: Control which timeframes display TOI lines (default: 5-minute and below)
TECHNICAL
• Pine Script v6
• Max Lines: 50 | Max Labels: 50
• Timezone: America/New_York
• Automatic memory management
• Works on all instruments and chart types
UNIQUE FEATURES
• Proprietary time window detection algorithm
• Dynamic line extension system (not static markers)
• Intelligent memory management
• Multi-session architecture with independent customization
• Adaptive support/resistance levels
© 2025 ThiruDinesh - Proprietary Algorithm - All Rights Reserved
Contact: TradingView @ThiruDinesh

BORSA 321 - Care PackageOverview
Care Package is a complete higher-timeframe and intraday context tool designed to map out every important environmental factor on your chart: sessions, opening levels, gaps, market structure, order blocks, fair value gaps, volume imbalance and more.
It automatically plots:
Sessions / killzones (Asia, London, New York AM/Lunch/PM)
Key opening levels (00:00, 08:30, 09:30, 13:30)
Previous day AM/PM high–low ranges
New Day and New Week Opening Gaps (NDOG / NWOG)
RTH gap and RTH zone levels
Multi-timeframe Fair Value Gaps (up to 4)
Fractals and Order Blocks (with optional FVG confirmation)
Market structure (HH/HL/LL/LH, CHoCH, BOS)
Volume Imbalance zones with mitigation logic
All session logic runs on IANA time zones (like America/New_York), giving accurate sessions and market opens regardless of DST or broker feed.
Care Package serves as the full “context layer” for intraday execution charts.
What It Shows
1. Sessions / Killzones
The indicator automatically highlights:
Asia Session
London Session
New York AM
New York Lunch
New York PM
Each session displays:
A high–low range box
Labels for session high and session low
A midline showing the mean price
Optional forward extensions of session levels to the current bar
This cleanly outlines intraday phases for ICT/SMC execution.
2. Opening Price Levels
Key market open levels tracked:
00:00
08:30
09:30
13:30
For each open, the script draws:
A horizontal line at the opening price
A label showing time and price
An optional vertical line marking the opening bar
These opens often act as liquidity or reversal areas.
3. Previous Day AM/PM Levels
The script splits the prior day into:
Previous Day AM (first half)
Previous Day PM (second half)
Both provide:
PD AM High, PD AM Low
PD PM High, PD PM Low
Forward-projected levels
Labels for easy identification
Useful for navigating intraday targets and reaction zones.
4. Last N Days High/Low
Tracks a rolling daily range:
Each day’s High and Low
Labels containing the date
Forward extension into today’s price action
This shows where price sits relative to recent daily extremes.
5. New Day & New Week Opening Gaps (NDOG / NWOG)
The script automatically identifies:
NDOG (New Day Open Gap)
NWOG (New Week Open Gap)
Each gap includes:
A shaded zone between the two opens
Labels showing the gap type and date/week
Forward extension (optional)
Limiting the number of historical gaps (optional)
Critical for identifying unfilled imbalance zones across sessions and weeks.
6. RTH Gap & RTH Zone
You define RTH open/close times, and the indicator:
Detects RTH gaps
Draws a full zone based on direction
Plots subdivision lines (top, 75%, mid, 25%, bottom)
Extends the RTH Close reference line forward
Can extend old RTH zones automatically
Ideal for futures traders and equities.
7. Higher-Timeframe Fair Value Gaps (up to 4 TFs)
Supports up to four selectable FVG timeframes such as:
Chart timeframe
5m, 15m, 1H, 4H, 1D, 1W, 1M
Each FVG includes:
Top and bottom boundary
A midline (mean threshold)
Colored bullish or bearish fill
A label showing FVG + timeframe
Automatic cleanup when mitigated (close/wick based)
You get a clean and accurate HTF FVG map without clutter.
8. Fractals & Order Blocks
Fractals:
Standard or 5-bar fractals
Plotted as swing highs and lows
Order Blocks:
Bullish OB → down candle before up displacement
Bearish OB → up candle before down displacement
Optionally require OB to be near an FVG
Wick-based or body-based OB size
Forward-projected OB boxes
Auto-delete after mitigation
This keeps your OBs clean and execution-focused.
9. Market Structure (HH/HL/LL/LH, CHoCH, BOS)
The indicator automatically detects:
HH (Higher High)
HL (Higher Low)
LH (Lower High)
LL (Lower Low)
And also identifies:
CHoCH (Change of Character)
BOS (Break of Structure)
Each break includes:
A horizontal level at the break point
A color-coded label
Bullish (green) or bearish (red) styling
A complete market structure map is built automatically.
10. Volume Imbalances (VI)
Detects and displays:
Bullish VI (VI+)
Bearish VI (VI-)
Features:
Configurable colors
Custom label size
Max visible boxes
Extension until mitigation
Automatic mitigation detection (close or wick)
Highlight when price enters an active VI
Perfect for tracking aggressive buying/selling footprints.
11. Timezone & Date/Time Widget
Uses IANA timezones for:
Accurate session boundaries
Proper DST handling
Multi-market consistency
Also includes a small on-chart table showing:
Your timezone date/time
Exchange timezone date/time
Great for globally active traders.
12. Max Display Timeframe
To prevent clutter, the script disables visuals above a chosen timeframe.
If you exceed it:
A clean on-chart message appears
Tells you to lower your chart TF or adjust the Max Display TF
Keeps charts fast and clean
Key Inputs & Customization
Timezone (IANA format)
Max Display Timeframe
Session/Killzone toggles, colors, naming
Opening levels (00:00 / 08:30 / 09:30 / 13:30)
Previous Day AM/PM highs/lows
NDOG / NWOG gap settings
RTH gap settings
FVG batching (4 independent timeframes)
Fractal type
Order Block settings (range type, deletion, FVG filter)
Market structure settings
Volume Imbalance settings
Date/time widget settings
Everything is modular — turn features on/off individually.
How It Helps Traders
For Intraday Traders / Scalpers:
Session mapping for timing setups
Exact key opening prices
RTH gaps and internals
Precise daily AM/PM high–low context
HTF FVGs, OBs, VI zones for higher-timeframe bias
Real-time CHoCH/BOS for entry timing
For Swing Traders:
Daily/weekly context plotted automatically
NDOG, NWOG, RTH gap awareness
Macro structure levels
HTF FVGs and OBs for HTF targets

Narrative [#]Narrative - Not predicting, “anticipating”.
Overview
Narrative, is a multi-timeframe technical analysis indicator that provides anticipative candle structure analysis by identifying and visualizing higher timeframe (HTF) price levels based on candle composition dynamics. The indicator calculates hierarchical price zones derived from candle body proportions and wick ranges, then projects these levels as support/resistance quadrants and standard deviation-based extensions for the current and subsequent timeframe periods.
Core Functionality
Narrative Analysis Algorithm
The indicator operates on a user-selectable timeframe (1m through Weekly) and analyzes completed candles to identify structural patterns:
Body-to-Wick Ratio Analysis: Compares the candle body size relative to upper and lower wicks to determine market structure bias
Quadrant Level Generation: Subdivides identified wick ranges into proportional levels (.25, .5, .75) representing key equilibrium points
Standard Deviation Extensions: Calculates and displays standard deviation bands based on either wick-specific ranges or full candle range (High-Low)
Anticipation Status Classification: Categorizes candle structure as Bullish Expansion, Bearish Expansion, or Consolidation Reversal to telegraph anticipated price behavior
What Makes This Indicator Different
Dynamic Level Generation: Unlike static support/resistance tools, Narrative generates levels from actual candle structure proportions rather than lower timeframe structure.
Hierarchical Quadrant System: Provides four distinct sublevel zones within major price ranges, enabling confluence for PD Arrays (Premium/Discount Arrays from ICT), support and resistance and “random” price movements.
Dual STDV Calculation Methods: Offers both wick-specific and full-range standard deviation modes, accommodating different narratives and their key level framework.
Advantages:
Works on any timeframe and any instrument without volume data dependency
Identifies institutional price structure through pure OHLC analysis
Provides forward-looking anticipation rather than reactive analysis
Unique Features:
Extracts pattern-specific information from individual candle structures
Updates on every timeframe change with fresh level calculations
Combines reversal probability assessment with geometric price projections
Technical Specifications
Input Parameters
Narrative Timeframe: Selectable from 1m, 5m, 15m, 1H, 4H, D, W
Show Anticipation Table: Boolean toggle for narrative status display
Reversal Candles Toggle: Master control for all level overlays
STDV Range Options: Toggle between 1-2 STDV (basic) and 3-4 STDV (extended)
Quadrant Display: Individual toggles for .25, .5, .75 level visibility
Customizable Colors: Separate color schemes for bullish, bearish, body, and wick levels
Line Styling: Adjustable line width, style (solid/dotted/dashed), and extension periods
Output Display Elements
Quadrant Levels:
Upper wick quadrants (Price High to Body High)
Lower wick quadrants (Body Low to Price Low)
Body range quadrants (Open-Close range)
Each subdivided into .25, .5, and .75 proportional levels
Standard Deviation Extensions:
±1, ±2, ±2.5 bands (basic mode)
±3, ±4 bands (extended mode)
Full-range or wick-specific calculations
Narrative Table:
Real-time anticipation classification
Timeframe reference
Updates on new candle formation
Optimal Use Cases
Best Performance Timeframes: Weekly, Daily, and 4-Hour (larger sample size for ratio accuracy)
Primary trend identification and institutional level discovery
Swing trade entry/exit optimization
Multi-timeframe confluence analysis
Secondary Timeframes: 1-Hour through 15-Minute
Intraday precision entry points
Scalp setup confirmation
Micro-level support/resistance zones
Supported Instruments: All (Forex, Stocks, Cryptos, Commodities, Indices)
No instrument-specific calibration required
Pure OHLC-based analysis
Trading Applications
Anticipation Planning: Use the narrative status to pre-position orders ahead of candle close
Level Confluence: Identify zones where quadrants align with other technical tools
Risk Management: Set stops relative to discovered STDV extensions or quadrants
Breakout Validation: Confirm breakouts occur at identified quadrant levels
Reversal Probability: Assess expansion vs. consolidation patterns for mean reversion setups
Compliance & Safety
No Repainting: Levels are calculated once at candle close and remain fixed
No Lookahead Bias: All calculations use closed candle data
Non-Repaint Draw Algorithm: Historical levels persist, new levels overlay forward only
Performance Optimized: Efficiently manages up to 500 lines and labels per chart instance
Summary
Narrative bridges the gap between price action analysis and algorithmic level projection by extracting predictive structure from candle composition. It provides institutional-grade level identification without requiring volume data, making it a lightweight yet powerful addition to any technical analysis workflow. The indicator excels at revealing hidden price structure that traditional indicators overlook, offering traders a quantifiable edge in identifying key reversal and continuation zones.

Flout Ranges + STDVs [bilal]# Flout Ranges + STDVs
## What It Does
Automatically draws FLOUT, CBDR, and ASIA session ranges with standard deviation levels and highlight zones. Perfect for ICT-style trading and session-based strategies.
## Main Features
**📊 Session Ranges**
- FLOUT, CBDR, and ASIA ranges drawn automatically
- Works for both Indices and Forex (just toggle Forex Mode)
- Customizable colors and labels for each range
**📈 Standard Deviation Levels**
- Shows key STDV levels from your ranges
- FLOUT: -6 to +6 from midpoint
- CBDR/ASIA: 0 to 7 from range low
- Helps identify expansion targets and reversal zones
**🎯 Highlight Zones**
- Zone 1 (default 3.5-4.0 STDV): Common reversal area
- Zone 2 (default 5.5-6.0 STDV): Extended targets
- Shaded boxes make them easy to spot
- Automatically extends forward into London session
**📐 Smart Trendlines**
- Connects the open prices at key times
- Switches to X-pattern on trending FLOUT days
- Helps identify directional bias
## Quick Setup
1. Add indicator to your 1-5 minute chart
2. Toggle **Forex Mode** if trading forex (otherwise leave off for indices)
3. Turn on STDV lines for the ranges you want to see
4. Adjust highlight zones if needed (defaults work great)
## Why Use This?
- **Save Time**: No more manual drawing of ranges and levels
- **Stay Consistent**: Same levels calculated every session
- **Better Entries**: Use STDV zones for high-probability setups
- **Cleaner Charts**: Toggle what you need, hide what you don't
## Pro Tips
💡 Watch for reactions at 3.5-4.0 STDV zones - these are prime reversal areas
💡 Combine multiple ranges for allignements setups
---
*All times in New York timezone. Best used on 1-5 minute charts.*

Advanced Time Dividers & Killzones IndicatorOverview
A comprehensive Pine Script v6 indicator that displays customizable time period dividers and trading session killzones on your chart. Perfect for intraday traders who need clear visual separation of time periods and want to identify key trading sessions.
✨ Features
Time Period Dividers
Weekly Lines: Vertical lines marking the start of each week
Monthly Lines: Vertical lines marking the start of each month
Quarterly Lines: Vertical lines marking the start of each quarter (Q1, Q2, Q3, Q4)
Yearly Lines: Vertical lines marking the start of each year
Trading Session Killzones
London Session: 2:00-5:00 GMT (Blue shaded box)
New York Session: 7:00-10:00 GMT (Green shaded box)
London Close: 10:00-12:00 GMT (Orange shaded box)
Asia Session: 20:00-00:00 GMT (Pink shaded box)
🎨 Customization Options
Display Controls
Toggle each time divider type individually
Toggle each killzone individually
Adjust historical and future display range
Show/hide labels on dividers and killzones
Style Customization
Line Styles: Choose between Solid, Dashed, or Dotted lines
Line Width: Adjustable from 1 to 5 pixels
Colors: Fully customizable colors for each element with transparency control
Label Size: Choose from Tiny, Small, Normal, or Large
Period Settings
Control how many bars to display in the past (0-5000)
Control how many bars to display in the future (0-1000)
📋 Usage Instructions
Add to Chart: Add the indicator to any chart
Select Timeframe: Works best on intraday timeframes (1H, 15min, 5min) for killzones
Customize: Open settings to enable/disable features and customize colors
Trading: Use the dividers to identify time periods and killzones to spot high-liquidity sessions
💡 Trading Applications
Time Dividers
Weekly/Monthly Analysis: Identify major time period transitions
Market Structure: Analyze how price behaves at period boundaries
Event Correlation: Align with economic calendar events
Killzones
High Liquidity Periods: Trade during peak market activity
ICT Strategy: Follows Inner Circle Trader killzone concepts
Session-Based Trading: Focus on specific trading sessions
Volatility Windows: Identify when major moves typically occur
⚙️ Technical Details
Version: Pine Script v6
Type: Overlay indicator
Max Lines: 500 (optimized performance)
Max Boxes: 500 (for killzone visualization)
Timezone: GMT/UTC for killzones
Memory Efficient: Automatic cleanup of old objects
🎯 Best Practices
Combine with Price Action: Use dividers to frame your analysis
Focus on Killzones: Most significant price moves occur during these sessions
Adjust Transparency: Find the right balance between visibility and chart clarity
Use Labels Wisely: Toggle labels on/off based on your needs
Timeframe Selection: Use lower timeframes (≤1H) to see killzones clearly
📝 Notes
Killzone times are in GMT/UTC timezone
Works on all instruments (Forex, Crypto, Stocks, Futures)
Optimized for performance with automatic memory management
Fully compatible with other indicators
🔄 Updates & Support
This indicator is actively maintained. Feel free to suggest improvements or report issues in the comments.

GT3_Trades Sessions Highs & LowsThis indicator automatically identifies and displays the session highs and lows for the three major global market sessions: Asia, London, and New York. It is designed for intraday traders who rely on session-based structure, liquidity levels, and volatility windows. The script dynamically tracks and plots the highest and lowest price reached during each session and extends these levels forward on the chart for strong visual clarity.
Key Features
Session-Based Highs & Lows
Calculates and updates the high and low for each session (Asia, London, New York) in real time as price develops within the session window.
Fully Customizable Display Options
Traders can individually toggle the visibility of each session’s high and low levels.
Line colors, styles (Solid, Dashed, Dotted), and thickness are also user-configurable.
Accurate Timezone Handling
Session times are defined using user-selected timezone settings (default UTC+3), ensuring session boundaries match the trader’s desired market timing.
Automatic Daily Reset
At the start of each new trading day, the indicator clears the previous levels and begins tracking fresh highs and lows for the new day.
Dynamic Line Drawing
Each level is plotted using real Pine Script line objects, which update automatically as new highs or lows form. Once created, each line extends forward to the right—providing clear, persistent references for potential liquidity zones, breakouts, and reversions.
Efficient Tracking Logic
The script keeps track of the bar index where each high/low occurs and updates the line endpoints in real time. Historical levels are not reused, ensuring clean, uncluttered visuals.
How It Helps Traders
Identifies liquidity pools and sweep areas based on session extremes.
Highlights intraday structure shifts when price breaks or respects session highs/lows.
Provides a clear overview of volatility cycles across the global trading day.
Helps detect potential reversal or continuation setups when interacting with session boundaries.
Ideal For
Intraday and scalping strategies
ICT-based session analysis
Liquidity, sweep, and FVG traders
Forex, indices, crypto, and commodities

Smart Money Concepts [XoRonX]# Smart Money Concepts (SMC) - Advanced Trading Indicator
## 📊 Deskripsi
**Smart Money Concepts ** adalah indicator trading komprehensif yang menggabungkan konsep Smart Money Trading dengan berbagai alat teknikal analisis modern. Indicator ini dirancang untuk membantu trader mengidentifikasi pergerakan institusional (smart money), struktur pasar, zona supply/demand, dan berbagai sinyal trading penting.
Indicator ini mengintegrasikan multiple timeframe analysis, order blocks detection, fair value gaps, fibonacci retracement, volume profile, RSI multi-timeframe, dan moving averages dalam satu platform yang powerful dan mudah digunakan.
---
## 🎯 Fitur Utama
### 1. **Smart Money Structure**
- **Internal Structure** - Struktur pasar jangka pendek untuk entry presisi
- **Swing Structure** - Struktur pasar jangka panjang untuk trend analysis
- **BOS (Break of Structure)** - Konfirmasi kelanjutan trend
- **CHoCH (Change of Character)** - Deteksi potensi reversal
### 2. **Order Blocks**
- **Internal Order Blocks** - Zona demand/supply jangka pendek
- **Swing Order Blocks** - Zona demand/supply jangka panjang
- Filter otomatis berdasarkan volatilitas (ATR/Range)
- Mitigation tracking (High/Low atau Close)
- Customizable display (jumlah order blocks yang ditampilkan)
### 3. **Equal Highs & Equal Lows (EQH/EQL)**
- Deteksi otomatis equal highs/lows
- Indikasi liquidity zones
- Threshold adjustment untuk sensitivitas
- Visual lines dan labels
### 4. **Fair Value Gaps (FVG)**
- Multi-timeframe FVG detection
- Auto threshold filtering
- Bullish & Bearish FVG boxes
- Extension control
- Color customization
### 5. **Premium & Discount Zones**
- Premium Zone (75-100% dari range)
- Equilibrium Zone (47.5-52.5% dari range)
- Discount Zone (0-25% dari range)
- Auto-update berdasarkan swing high/low
### 6. **Fibonacci Retracement**
- **Equilibrium to Discount** - Fib dari EQ ke discount zone
- **Equilibrium to Premium** - Fib dari EQ ke premium zone
- **Discount to Premium** - Fib full range
- Reverse option
- Show/hide lines
- Custom colors
### 7. **Volume Profile (VRVP)**
- Visible Range Volume Profile
- Point of Control (POC)
- Value Area (70% volume)
- Auto-adjust rows
- Placement options (Left/Right)
- Width customization
### 8. **RSI Multi-Timeframe**
- Monitor 3 timeframes sekaligus
- Overbought/Oversold signals
- Visual table display
- Color-coded signals (Red OB, Green OS)
- Customizable position & size
### 9. **Moving Averages**
- 3 Moving Average lines
- Pilihan tipe: EMA, SMA, WMA
- Automatic/Manual period mode
- Individual color & width settings
- Cross alerts (MA vs MA, Price vs MA)
### 10. **Multi-Timeframe Levels**
- Support up to 5 different timeframes
- Previous high/low levels
- Custom line styles
- Color customization
### 11. **Candle Color**
- Color candles berdasarkan trend
- Bullish = Green, Bearish = Red
- Optional toggle
---
## 🛠️ Cara Penggunaan
### **A. Setup Awal**
1. **Tambahkan Indicator ke Chart**
- Buka TradingView
- Klik "Indicators" → "My Scripts" atau paste code
- Pilih "Smart Money Concepts "
2. **Pilih Mode Display**
- **Historical**: Tampilkan semua struktur (untuk backtesting)
- **Present**: Hanya tampilkan struktur terbaru (clean chart)
3. **Pilih Style**
- **Colored**: Warna berbeda untuk bullish/bearish
- **Monochrome**: Tema warna abu-abu
---
### **B. Penggunaan Fitur**
#### **1. Smart Money Structure**
**Internal Structure (Real-time):**
- ✅ Aktifkan "Show Internal Structure"
- Pilih tampilan: All, BOS only, atau CHoCH only
- Gunakan untuk entry timing presisi
- Filter confluence untuk mengurangi noise
**Swing Structure:**
- ✅ Aktifkan "Show Swing Structure"
- Pilih tampilan struktur bullish/bearish
- Adjust "Swings Length" (default: 50)
- Gunakan untuk konfirmasi trend utama
**Tips:**
- BOS = Konfirmasi trend continuation
- CHoCH = Warning untuk possible reversal
- Tunggu price retest ke order block setelah BOS
---
#### **2. Order Blocks**
**Setup:**
- ✅ Aktifkan Internal/Swing Order Blocks
- Set jumlah blocks yang ditampil (1-20)
- Pilih filter: ATR atau Cumulative Mean Range
- Pilih mitigation: Close atau High/Low
**Cara Trading:**
1. Tunggu BOS/CHoCH terbentuk
2. Identifikasi order block terdekat
3. Wait for price pullback ke order block
4. Entry saat price respek order block (rejection)
5. Stop loss di bawah/atas order block
6. Target: swing high/low berikutnya
**Color Code:**
- 🔵 Light Blue = Internal Bullish OB
- 🔴 Light Red = Internal Bearish OB
- 🔵 Dark Blue = Swing Bullish OB
- 🔴 Dark Red = Swing Bearish OB
---
#### **3. Equal Highs/Lows (EQH/EQL)**
**Setup:**
- ✅ Aktifkan "Equal High/Low"
- Set "Bars Confirmation" (default: 3)
- Adjust threshold (0-0.5, default: 0.1)
**Interpretasi:**
- EQH = Liquidity di atas, kemungkinan sweep lalu dump
- EQL = Liquidity di bawah, kemungkinan sweep lalu pump
- Biasanya smart money akan grab liquidity sebelum move besar
**Trading Strategy:**
- Wait for EQH/EQL formation
- Anticipate liquidity grab
- Entry setelah sweep dengan konfirmasi (order block, FVG, CHoCH)
---
#### **4. Fair Value Gaps (FVG)**
**Setup:**
- ✅ Aktifkan "Fair Value Gaps"
- Pilih timeframe (default: chart timeframe)
- Enable/disable auto threshold
- Set extension bars
**Cara Trading:**
1. Bullish FVG = Support zone untuk buy
2. Bearish FVG = Resistance zone untuk sell
3. Price tends to fill FVG (retest)
4. Entry saat price kembali ke FVG
5. Partial fill = valid, full fill = invalidated
**Tips:**
- FVG + Order Block = High probability setup
- Multi-timeframe FVG lebih kuat
- Unfilled FVG = strong momentum
---
#### **5. Premium & Discount Zones**
**Setup:**
- ✅ Aktifkan "Premium/Discount Zones"
- Zones akan auto-update berdasarkan swing high/low
**Interpretasi:**
- 🟢 **Discount Zone** = Area BUY (price murah)
- ⚪ **Equilibrium** = Neutral (50%)
- 🔴 **Premium Zone** = Area SELL (price mahal)
**Trading Strategy:**
- BUY dari discount zone
- SELL dari premium zone
- Avoid trading di equilibrium
- Combine dengan structure confirmation
---
#### **6. Fibonacci Retracement**
**Setup:**
- Pilih Fib yang ingin ditampilkan:
- Equilibrium to Discount
- Equilibrium to Premium
- Discount to Premium
- Toggle show lines
- Enable reverse jika perlu
- Custom colors
**Key Levels:**
- 0.236 = Shallow retracement
- 0.382 = Common retracement
- 0.5 = 50% golden level
- 0.618 = Golden ratio (penting!)
- 0.786 = Deep retracement
**Cara Pakai:**
- 0.618-0.786 = Ideal entry zone dalam trend
- Combine dengan order blocks
- Wait for confirmation candle
---
#### **7. Volume Profile (VRVP)**
**Setup:**
- ✅ Aktifkan "Show Volume Profile"
- Set jumlah rows (10-100)
- Adjust width (5-50%)
- Pilih placement (Left/Right)
- Enable POC dan Value Area
**Interpretasi:**
- **POC (Point of Control)** = Harga dengan volume tertinggi = magnet
- **Value Area** = 70% volume = fair price range
- **Low Volume Nodes** = Weak support/resistance
- **High Volume Nodes** = Strong support/resistance
**Trading:**
- POC acts as support/resistance
- Price tends to return to POC
- Breakout dari Value Area = momentum
---
#### **8. RSI Multi-Timeframe**
**Setup:**
- ✅ Aktifkan "Show RSI Table"
- Set 3 timeframes (default: chart, 5m, 15m)
- Set RSI period (default: 14)
- Set Overbought level (default: 70)
- Set Oversold level (default: 30)
- Pilih posisi & ukuran table
**Interpretasi:**
- 🟢 **OS (Oversold)** = RSI ≤ 30 = Kondisi jenuh jual
- 🔴 **OB (Overbought)** = RSI ≥ 70 = Kondisi jenuh beli
- **-** = Neutral zone
**Trading Strategy:**
1. Multi-timeframe alignment = strong signal
2. OS + Bullish structure = BUY signal
3. OB + Bearish structure = SELL signal
4. Divergence RSI vs Price = reversal warning
**Contoh:**
- TF1: OS, TF2: OS, TF3: OS + Price di discount zone = STRONG BUY
---
#### **9. Moving Averages**
**Setup:**
- Pilih MA Type: EMA, SMA, atau WMA (berlaku untuk ketiga MA)
- Pilih Period Mode: Automatic atau Manual
- Set period untuk MA 1, 2, 3 (default: 20, 50, 100)
- Custom color & width per MA
- ✅ Enable Cross Alerts
**Interpretasi:**
- **Golden Cross** = MA fast cross above MA slow = Bullish
- **Death Cross** = MA fast cross below MA slow = Bearish
- Price above all MAs = Strong uptrend
- Price below all MAs = Strong downtrend
**Trading Strategy:**
1. MA1 (20) = Short-term trend
2. MA2 (50) = Medium-term trend
3. MA3 (100) = Long-term trend
**Entry Signals:**
- Price bounce dari MA dalam trend = continuation
- MA cross dengan konfirmasi structure = entry
- Multiple MA confluence = strong support/resistance
**Alerts Available:**
- MA1 cross MA2/MA3
- MA2 cross MA3
- Price cross any MA
---
#### **10. Multi-Timeframe Levels**
**Setup:**
- Enable HTF Level 1-5
- Set timeframes (contoh: 5m, 1H, 4H, D, W)
- Pilih line style (solid/dashed/dotted)
- Custom colors
**Cara Pakai:**
- Previous high/low dari HTF = strong S/R
- Breakout HTF level = significant move
- Multiple HTF levels confluence = major zone
---
### **C. Trading Setup Combination**
#### **Setup 1: High Probability Buy (Bullish)**
1. ✅ Swing structure: Bullish BOS
2. ✅ Price di Discount Zone
3. ✅ Pullback ke Bullish Order Block
4. ✅ Bullish FVG di bawah
5. ✅ RSI Multi-TF: Oversold
6. ✅ Price bounce dari MA
7. ✅ POC/Value Area support
8. ✅ Fibonacci 0.618-0.786 retracement
**Entry:** Saat price reject dari order block dengan confirmation candle
**Stop Loss:** Below order block
**Target:** Swing high atau premium zone
---
#### **Setup 2: High Probability Sell (Bearish)**
1. ✅ Swing structure: Bearish BOS
2. ✅ Price di Premium Zone
3. ✅ Pullback ke Bearish Order Block
4. ✅ Bearish FVG di atas
5. ✅ RSI Multi-TF: Overbought
6. ✅ Price reject dari MA
7. ✅ POC/Value Area resistance
8. ✅ Fibonacci 0.618-0.786 retracement
**Entry:** Saat price reject dari order block dengan confirmation candle
**Stop Loss:** Above order block
**Target:** Swing low atau discount zone
---
#### **Setup 3: Liquidity Grab (EQH/EQL)**
1. ✅ Identifikasi EQH atau EQL
2. ✅ Wait for liquidity sweep
3. ✅ Konfirmasi dengan CHoCH
4. ✅ Order block terbentuk setelah sweep
5. ✅ Entry saat retest order block
---
### **D. Tips & Best Practices**
**Risk Management:**
- Selalu gunakan stop loss
- Risk 1-2% per trade
- Risk:Reward minimum 1:2
- Jangan over-leverage
**Confluence adalah Kunci:**
- Minimal 3-4 konfirmasi sebelum entry
- Lebih banyak konfirmasi = higher probability
- Quality over quantity
**Timeframe Analysis:**
- HTF (Higher Timeframe) = Trend direction
- LTF (Lower Timeframe) = Entry timing
- Align dengan HTF trend
**Backtesting:**
- Gunakan mode "Historical"
- Test strategy di berbagai market condition
- Record dan analyze hasil
**Market Condition:**
- Trending market = Follow BOS, use order blocks
- Ranging market = Use premium/discount zones, EQH/EQL
- High volatility = Wider stops, wait for clear structure
**Avoid:**
- Trading di equilibrium zone
- Entry tanpa konfirmasi
- Fighting the trend
- Overleveraging
- Emotional trading
---
## 📈 Recommended Settings
### **For Scalping (1m - 5m):**
- Internal Structure: ON
- Swing Structure: OFF
- Order Blocks: Internal only
- RSI Timeframes: 1m, 5m, 15m
- MA Periods: 9, 21, 50
### **For Day Trading (15m - 1H):**
- Internal Structure: ON
- Swing Structure: ON
- Order Blocks: Both
- RSI Timeframes: 15m, 1H, 4H
- MA Periods: 20, 50, 100
### **For Swing Trading (4H - D):**
- Internal Structure: OFF
- Swing Structure: ON
- Order Blocks: Swing only
- RSI Timeframes: 4H, D, W
- MA Periods: 20, 50, 200
---
## ⚠️ Disclaimer
Indicator ini adalah alat bantu analisis teknikal. Tidak ada indicator yang 100% akurat. Selalu:
- Lakukan analisa fundamental
- Gunakan proper risk management
- Praktik di demo account terlebih dahulu
- Trading memiliki resiko, trade at your own risk
---
## 📝 Version Info
**Version:** 5.0
**Platform:** TradingView Pine Script v5
**Author:** XoRonX
**Max Labels:** 500
**Max Lines:** 500
**Max Boxes:** 500
---
## 🔄 Updates & Support
Untuk update, bug reports, atau pertanyaan:
- Check documentation regularly
- Test new features in replay mode
- Backup your settings before updates
---
## 🎓 Learning Resources
**Recommended Study:**
1. Smart Money Concepts (SMC) basics
2. Order blocks theory
3. Liquidity concepts
4. ICT (Inner Circle Trader) concepts
5. Volume profile analysis
6. Multi-timeframe analysis
**Practice:**
- Start with higher timeframes
- Master one concept at a time
- Keep a trading journal
- Review your trades weekly
---
**Happy Trading! 🚀📊**
_Remember: The best indicator is your own analysis and discipline._

MMM Time Stamp & Asian Session @MaxMaserati 3.0═════════════════════════════════════════════════════════════MMM TimeStamps & Asia @MaxMaserati 3.0 ═════════════════════════════════════════════════════════════
This indicator helps intraday traders identify critical market timing and key liquidity zones. It displays customizable time labels at major market events (market open, pre-market moves, session changes) and automatically tracks the Asian session range with high, low, and mid-level lines.
The Asian session levels act as important reference points for institutional order flow and potential support/resistance zones during subsequent trading sessions. Lines extend forward until broken, helping traders identify when price takes liquidity or respects these key levels.
The visual background and customizable labels make it easy to spot session boundaries and plan trades around these high-probability zones.
Ideal for traders following ICT concepts, session-based strategies, SMC or anyone needing clear visual markers for time-based analysis on intraday charts.
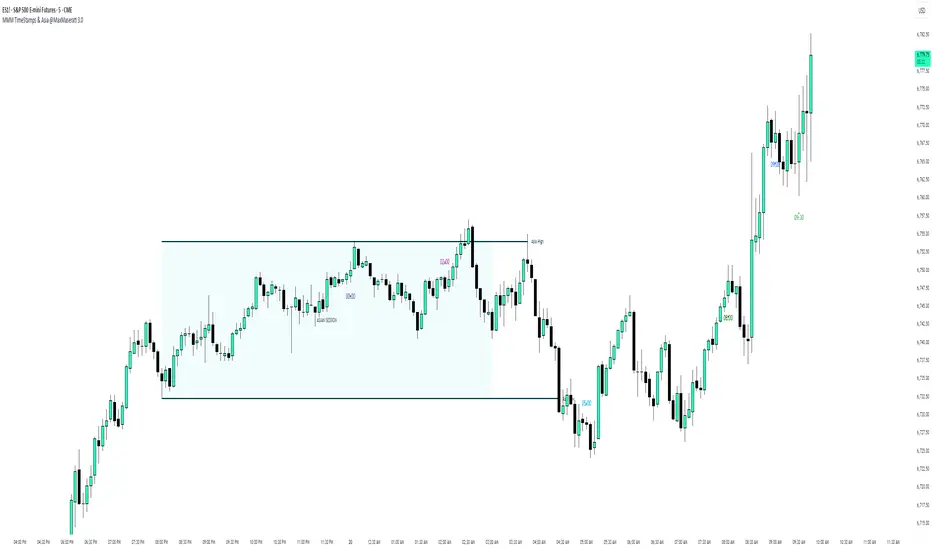
Live Session Extremes: Asia / London / NY (5m)This script automatically tracks and plots the live high and low levels of the three major Forex trading sessions:
Asia Session (18:00–03:00) — Teal
London Session (03:00–08:00) — Blue
New York Session (08:00–12:00) — Red
Designed specifically for 5-minute charts, it updates in real time as each session forms new highs or lows.
You always see the most recent session’s levels, cleanly plotted and color-coded on your chart.
✔ Features
Live updating lines for each session’s high & low
Lines anchored to the exact candles that created the extreme
Auto-cleaning: old session levels are deleted when a new session begins
Clear labeling:
Asia High / Asia Low (Teal)
London High / London Low (Blue)
NY High / NY Low (Red)
Extend-right option for projecting session levels into future price action
Built for precision session-based strategies such as:
Liquidity grabs
Session sweeps
BOS/CHOCH analysis
ICT-style trading
High/low power levels

ID Candle Body % Star Rating + SMC ToolkitThis tool combines strong-body candle detection, trend analysis, SMC-based setups, session levels, VWAP, Donchian Channels and live alerts. It’s built to help you read momentum, structure and volatility on any intraday chart.
1. Strong Body Candle Detection
The script highlights candles with exceptional bodies using three conditions:
• Body is larger than the previous five candles
• Body makes up more than 85% of the entire candle
• Both conditions happening at the same time
These signals help you spot strength or exhaustion in real time.
2. EMA Trend Layer
Three EMAs (50/100/200 by default) plot the overall trend.
When enabled, the area between the fast and slow EMAs fills with a soft color to show bullish or bearish bias at a glance.
3. Bullish and Bearish Setup (ICT-style patterns)
The indicator marks classic two-candle continuation setups:
• Bullish setup with a break above the previous high and an FVG
• Bearish setup with a break below the previous low and an FVG
You can also enable “low break” and “high break” variations to track liquidity sweeps.
Each setup has its own alert option.
4. Four Key Market Sessions
The script plots Asia Open, Midnight Open, London Open and New York Open.
Each session shows:
• A real-time box
• High, low and midpoint
• Optional extended lines projecting forward
These levels often act as reaction zones on lower timeframes.
5. VWAP With Optional Bands
You can anchor VWAP to the session, week, month, quarter or year.
Bands can be calculated using standard deviation or a percentage.
There’s also an option to hide VWAP on higher timeframes.
6. Donchian Channel
A classic 20-period DC is included to provide an additional structure reference for breakouts and trend ranges.
7. Real-Time Alerts
Alerts trigger only once per bar and cover:
• Bullish setup
• Bearish setup
• Liquidity sweep variations
• VWAP star-rating (if enabled in the code block)
Great for traders who monitor multiple pairs.
