[Yorsh] BJN Liquidity Matrix v1.0Indicator Analysis & Performance Report: BJN Liquidity Matrix v1.0
1. Executive Summary
The BJN Liquidity Matrix v1.0 is a sophisticated, professional-grade trading indicator for TradingView, built on the modern PineScript v6. It is designed to provide traders with a comprehensive and highly customizable view of market liquidity, time-based events, and price structure.
Its primary differentiator in a crowded market is its performance-first architecture. While most multi-feature indicators cause significant chart lag and slow performance, this tool is meticulously engineered to be lightweight, fast, and reliable, ensuring that your trading analysis is never compromised by technical bottlenecks. It delivers a full suite of institutional trading concepts without sacrificing speed.
2. Core Features Overview
The indicator seamlessly integrates several key analytical concepts into a single, cohesive toolkit.
A. Advanced Time Analysis
Customizable Killzone Boxes: Automatically draws key trading sessions (Asia, London, NY AM, NY Lunch, NY PM) on the chart. This helps visualize the high and low of each session, which often act as critical support and resistance levels.
Session High/Low Lines: Extends horizontal lines from the identified highs and lows of each Killzone, allowing you to track these liquidity points throughout the trading day.
Macro Time Highlighting: Visually alerts you when the market enters specific "macro" time windows, which are often periods of increased volatility and algorithmic activity.
B. Multi-Layered Liquidity & Price Structure
Current Timeframe (CTF) Swings: Automatically identifies and plots short-term swing highs and lows on your active chart, providing a clear map of immediate liquidity pools.
Higher Timeframe (HTF) Liquidity: Plots key fractals from the 1-hour timeframe directly onto your chart, tagged as "1H
". This saves you from constantly switching timeframes to find significant swing points.
Previous Day High/Low (PDH/PDL): Clearly marks the previous day's high and low with clean, auto-adjusting labels. These are fundamental levels watched by all market participants.
C. Integrated Market Bias Tools
Daily BIAS: Draws a dynamic equilibrium price (50% level) based on the current day's developing range. This acts as a simple but powerful bias filter: favoring longs below it and shorts above it.
Probabilistic Hourly Bias: A unique feature that analyzes the closing price of the previous hourly candle to provide a statistical probability of the market taking out the previous hour's high or low.
D. The "Smart Status" Information Hub
This is the indicator's central dashboard. Instead of cluttering your chart with dozens of lines, this dynamic table intelligently sorts and displays the most relevant, un-taken liquidity levels above and below the current price. It automatically updates as levels are breached, providing a clean, at-a-glance view of:
Nearest Buy-Side & Sell-Side Liquidity
Untouched Session Highs/Lows
Active PDH/PDL levels
The Hourly Bias probability (when active and not taken)
3. The Performance Advantage: A Smoother Trading Experience
This indicator was engineered to outperform its competitors by focusing on computational efficiency. This is not just a feature; it is the core design philosophy.
Efficient Drawing Management: Most indicators slow down charts by continuously drawing thousands of objects over historical data. The BJN Liquidity Matrix uses an advanced system to only draw what is necessary. It intelligently limits drawings to a recent, user-defined period (e.g., the last 2 days), preventing historical clutter that cripples browser performance.
Smart De-Cluttering: Broken liquidity levels are not left on the chart indefinitely. The script will automatically hide old, irrelevant lines after a set number of hours, keeping your workspace clean and focused on current market structure.
Minimal Data Requests: The script uses internal caching for data like in example the Previous Day Highs/Lows. This means it fetches the data once and reuses it, drastically reducing requests to TradingView's servers and resulting in faster script loading times and reloads.
On-Demand Table Refresh: The comprehensive "Smart Status" table—a feature that would typically cause constant lag—is programmed to only perform its heavy recalculations on the very last bar. This means it doesn't slow down historical data or cause screen-tearing while the market is active.
In summary, you get all the analytical power without the lag, freezing, or slow loading times that plague other "all-in-one" liquidity indicators.
4. Ideal User Profile
This indicator is an ideal tool for:
Day Traders & Scalpers: Who rely on session liquidity and intraday price structure.
SMC / ICT Traders: Who base their strategies on concepts like liquidity grabs, fractals, and time-based models.
Performance-Conscious Traders: Anyone who uses multiple indicators or trades on a less powerful computer and cannot afford chart lag.
"ict" için komut dosyalarını ara

Luxy BIG beautiful Dynamic ORBThis is an advanced Opening Range Breakout (ORB) indicator that tracks price breakouts from the first 5, 15, 30, and 60 minutes of the trading session. It provides complete trade management including entry signals, stop-loss placement, take-profit targets, and position sizing calculations.
The ORB strategy is based on the concept that the opening range of a trading session often acts as support/resistance, and breakouts from this range tend to lead to significant moves.
What Makes This Different?
Most ORB indicators simply draw horizontal lines and leave you to figure out the rest. This indicator goes several steps further:
Multi-Stage Tracking
Instead of just one ORB timeframe, this tracks FOUR simultaneously (5min, 15min, 30min, 60min). Each stage builds on the previous one, giving you multiple trading opportunities throughout the session.
Active Trade Management
When a breakout occurs, the indicator automatically calculates and displays entry price, stop-loss, and multiple take-profit targets. These lines extend forward and update in real-time until the trade completes.
Cycle Detection
Unlike indicators that only show the first breakout, this tracks the complete cycle: Breakout → Retest → Re-breakout. You can see when price returns to test the ORB level after breaking out (potential re-entry).
Failed Breakout Warning
If price breaks out but quickly returns inside the range (within a few bars), the label changes to "FAILED BREAK" - warning you to exit or avoid the trade.
Position Sizing Calculator
Built-in risk management that tells you exactly how many shares to buy based on your account size and risk tolerance. No more guessing or manual calculations.
Advanced Filtering
Optional filters for volume confirmation, trend alignment, and Fair Value Gaps (FVG) to reduce false signals and improve win rate.
Core Features Explained
### 1. Multi-Stage ORB Levels
The indicator builds four separate Opening Range levels:
ORB 5 - First 5 minutes (fastest signals, most volatile)
ORB 15 - First 15 minutes (balanced, most popular)
ORB 30 - First 30 minutes (slower, more reliable)
ORB 60 - First 60 minutes (slowest, most confirmed)
Each level is drawn as a horizontal range on your chart. As time progresses, the ranges expand to include more price action. You can enable or disable any stage and assign custom colors to each.
How it works: During the opening minutes, the indicator tracks the highest high and lowest low. Once the time period completes, those levels become your ORB high and low for that stage.
### 2. Breakout Detection
When price closes outside the ORB range, a label appears:
BREAK UP (green label above price) - Price closed above ORB High
BREAK DOWN (red label below price) - Price closed below ORB Low
The label shows which ORB stage triggered (ORB5, ORB15, etc.) and the cycle number if tracking multiple breakouts.
Important: Signals appear on bar close only - no repainting. What you see is what you get.
### 3. Retest Detection
After price breaks out and moves away, if it returns to test the ORB level, a "RETEST" label appears (orange). This indicates:
The original breakout level is now acting as support/resistance
Potential re-entry opportunity if you missed the first breakout
Confirmation that the level is significant
The indicator requires price to move a minimum distance away before considering it a valid retest (configurable in settings).
### 4. Failed Breakout Detection
If price breaks out but returns inside the ORB range within a few bars (before the breakout is "committed"), the original label changes to "FAILED BREAK" in orange.
This warns you:
The breakout lacked conviction
Consider exiting if already in the trade
Wait for better setup
Committed Breakout: The indicator tracks how many bars price stays outside the range. Only after staying outside for the minimum number of bars does it become a committed breakout that can be retested.
### 5. TP/SL Lines (Trade Management)
When a breakout occurs, colored horizontal lines appear showing:
Entry Line (cyan for long, orange for short) - Your entry price (the ORB level)
Stop Loss Line (red) - Where to exit if trade goes against you
TP1, TP2, TP3 Lines (same color as entry) - Profit targets at 1R, 2R, 3R
These lines extend forward as new bars form, making it easy to track your trade. When a target is hit, the line turns green and the label shows a checkmark.
Lines freeze (stop updating) when:
Stop loss is hit
The final enabled take-profit is hit
End of trading session (optional setting)
### 6. Position Sizing Dashboard
The dashboard (bottom-left corner by default) shows real-time information:
Current ORB stage and range size
Breakout status (Inside Range / Break Up / Break Down)
Volume confirmation (if filter enabled)
Trend alignment (if filter enabled)
Entry and Stop Loss prices
All enabled Take Profit levels with percentages
Risk/Reward ratio
Position sizing: Max shares to buy and total risk amount
Position Sizing Example:
If your account is $25,000 and you risk 1% per trade ($250), and the distance from entry to stop loss is $0.50, the calculator shows you can buy 500 shares (250 / 0.50 = 500).
### 7. FVG Filter (Fair Value Gap)
Fair Value Gaps are price inefficiencies - gaps left by strong momentum where one candle's high doesn't overlap with a previous candle's low (or vice versa).
When enabled, this filter:
Detects bullish and bearish FVGs
Draws semi-transparent boxes around these gaps
Only allows breakout signals if there's an FVG near the breakout level
Why this helps: FVGs indicate institutional activity. Breakouts through FVGs tend to be stronger and more reliable.
Proximity setting: Controls how close the FVG must be to the ORB level. 2.0x means the breakout can be within 2 times the FVG size - a reasonable default.
### 8. Volume & Trend Filters
Volume Filter:
Requires current volume to be above average (customizable multiplier). High volume breakouts are more likely to sustain.
Set minimum multiplier (e.g., 1.5x = 50% above average)
Set "strong volume" multiplier (e.g., 2.5x) that bypasses other filters
Dashboard shows current volume ratio
Trend Filter:
Only shows breakouts aligned with a higher timeframe trend. Choose from:
VWAP - Price above/below volume-weighted average
EMA - Price above/below exponential moving average
SuperTrend - ATR-based trend indicator
Combined modes (VWAP+EMA, VWAP+SuperTrend) for stricter filtering
### 9. Pullback Filter (Advanced)
Purpose:
Waits for price to pull back slightly after initial breakout before confirming the signal.
This reduces false breakouts from immediate reversals.
How it works:
- After breakout is detected, indicator waits for a small pullback (default 2%)
- Once pullback occurs AND price breaks out again, signal is confirmed
- If no pullback within timeout period (5 bars), signal is issued anyway
Settings:
Enable Pullback Filter: Turn this filter on/off
Pullback %: How much price must pull back (2% is balanced)
Timeout (bars): Max bars to wait for pullback (5 is standard)
When to use:
- Choppy markets with many fake breakouts
- When you want higher quality signals
- Combine with Volume filter for maximum confirmation
Trade-off:
- Better signal quality
- May miss some valid fast moves
- Slight entry delay
How to Use This Indicator
### For Beginners - Simple Setup
Add the indicator to your chart (5-minute or 15-minute timeframe recommended)
Leave all default settings - they work well for most stocks
Watch for BREAK UP or BREAK DOWN labels to appear
Check the dashboard for entry, stop loss, and targets
Use the position sizing to determine how many shares to buy
Basic Trading Plan:
Wait for a clear breakout label
Enter at the ORB level (or next candle open if you're late)
Place stop loss where the red line indicates
Take profit at TP1 (50% of position) and TP2 (remaining 50%)
### For Advanced Traders - Customized Setup
Choose which ORB stages to track (you might only want ORB15 and ORB30)
Enable filters: Volume (stocks) or Trend (trending markets)
Enable FVG filter for institutional confirmation
Set "Track Cycles" mode to catch retests and re-breakouts
Customize stop loss method (ATR for volatile stocks, ORB% for stable ones)
Adjust risk per trade and account size for accurate position sizing
Advanced Strategy Example:
Enable ORB15 only (disable others for cleaner chart)
Turn on Volume filter at 1.5x with Strong at 2.5x
Enable Trend filter using VWAP
Set Signal Mode to "Track Cycles" with Max 3 cycles
Wait for aligned breakouts (Volume + Trend + Direction)
Enter on retest if you missed the initial break
### Timeframe Recommendations
5-minute chart: Scalping, very active trading, crypto
15-minute chart: Day trading, balanced approach (most popular)
30-minute chart: Swing entries, less screen time
60-minute chart: Position trading, longer holds
The indicator works on any intraday timeframe, but ORB is fundamentally a day trading strategy. Daily charts don't make sense for ORB.
DEFAULT CONFIGURATION
ON by Default:
• All 4 ORB stages (5/15/30/60)
• Breakout Detection
• Retest Labels
• All TP levels (1/1.5/2/3)
• TP/SL Lines (Detailed mode)
• Dashboard (Bottom Left, Dark theme)
• Position Size Calculator
OFF by Default (Optional Filters):
• FVG Filter
• Pullback Filter
• Volume Filter
• Trend Filter
• HTF Bias Check
• Alerts
Recommended for Beginners:
• Leave all defaults
• Session Mode: Auto-Detect
• Signal Mode: Track Cycles
• Stop Method: ATR
• Add Volume Filter if trading stocks
Recommended for Advanced:
• Enable ORB15 + ORB30 only (disable 5 & 60)
• Enable: Volume + Trend + FVG
• Signal Mode: Track Cycles, Max 3
• Stop Method: ATR or Safer
• Enable HTF Daily bias check
## Settings Guide
The settings are organized into logical groups. Here's what each section controls:
### ORB COLORS Section
Show Edge Labels: Display "ORB 5", "ORB 15" labels at the right edge of the levels
Background: Fill the area between ORB high/low with color
Transparency: How see-through the background is (95% is nearly invisible)
Enable ORB 5/15/30/60: Turn each stage on or off individually
Colors: Assign colors to each ORB stage for easy identification
### SESSION SETTINGS Section
Session Mode: Choose trading session (Auto-Detect works for most instruments)
Custom Session Hours: Define your own hours if needed (format: HHMM-HHMM)
Auto-Detect uses the instrument's natural hours (stocks use exchange hours, crypto uses 24/7).
### BREAKOUT DETECTION Section
Enable Breakout Detection: Master switch for signals
Show Retest Labels: Display retest signals
Label Size: Visual size for all labels (Small recommended)
Enable FVG Filter: Require Fair Value Gap confirmation
Show FVG Boxes: Display the gap boxes on chart
Signal Mode: "First Only" = one signal per direction per day, "Track Cycles" = multiple signals
Max Cycles: How many breakout-retest cycles to track (6 is balanced)
Breakout Buffer: Extra distance required beyond ORB level (0.1-0.2% recommended)
Min Distance for Retest: How far price must move away before retest is valid (2% recommended)
Min Bars Outside ORB: Bars price must stay outside for committed breakout (2 is balanced)
### TARGETS & RISK Section
Enable Targets & Stop-Loss: Calculate and show trade management
TP1/TP2/TP3 checkboxes: Select which profit targets to display
Stop Method: How to calculate stop loss placement
- ATR: Based on volatility (best for most cases)
- ORB %: Fixed % of ORB range
- Swing: Recent swing high/low
- Safer: Widest of all methods
ATR Length & Multiplier: Controls ATR stop distance (14 period, 1.5x is standard)
ORB Stop %: Percentage beyond ORB for stop (20% is balanced)
Swing Bars: Lookback period for swing high/low (3 is recent)
### TP/SL LINES Section
Show TP/SL Lines: Display horizontal lines on chart
Label Format: "Short" = minimal text, "Detailed" = shows prices
Freeze Lines at EOD: Stop extending lines at session close
### DASHBOARD Section
Show Info Panel: Display the metrics dashboard
Theme: Dark or Light colors
Position: Where to place dashboard on chart
Toggle rows: Show/hide specific information rows
Calculate Position Size: Enable the position sizing calculator
Risk Mode: Risk fixed $ amount or % of account
Account Size: Your total trading capital
Risk %: Percentage to risk per trade (0.5-1% recommended)
### VOLUME FILTER Section
Enable Volume Filter: Require volume confirmation
MA Length: Average period (20 is standard)
Min Volume: Required multiplier (1.5x = 50% above average)
Strong Volume: Multiplier that bypasses other filters (2.5x)
### TREND FILTER Section
Enable Trend Filter: Require trend alignment
Trend Mode: Method to determine trend (VWAP is simple and effective)
Custom EMA Length: If using EMA mode (50 for swing, 20 for day trading)
SuperTrend settings: Period and Multiplier if using SuperTrend mode
### HIGHER TIMEFRAME Section
Check Daily Trend: Display higher timeframe bias in dashboard
Timeframe: What TF to check (D = daily, recommended)
Method: Price vs MA (stable) or Candle Direction (reactive)
MA Period: EMA length for Price vs MA method (20 is balanced)
Min Strength %: Minimum strength threshold for HTF bias to be considered
- For "Price vs MA": Minimum distance (%) from moving average
- For "Candle Direction": Minimum candle body size (%)
- 0.5% is balanced - increase for stricter filtering
- Lower values = more signals, higher values = only strong trends
### ALERTS Section
Enable Alerts: Master switch (must be ON to use any alerts)
Breakout Alerts: Notify on ORB breakouts
Retest Alerts: Notify when price retests after breakout
Failed Break Alerts: Notify on failed breakouts
Stage Complete Alerts: Notify when each ORB stage finishes forming
After enabling desired alert types, click "Create Alert" button, select this indicator, choose "Any alert() function call".
## Tips & Best Practices
### General Trading Tips
ORB works best on liquid instruments (stocks with good volume, major crypto pairs)
First hour of the session is most important - that's when ORB is forming
Breakouts WITH the trend have higher success rates - use the trend filter
Failed breakouts are common - use the "Min Bars Outside" setting to filter weak moves
Not every day produces good ORB setups - be patient and selective
### Position Sizing Best Practices
Never risk more than 1-2% of your account on a single trade
Use the built-in calculator - don't guess your position size
Update your account size monthly as it grows
Smaller accounts: use $ Amount mode for simplicity
Larger accounts: use % of Account mode for scaling
### Take Profit Strategy
Most traders use: 50% at TP1, 50% at TP2
Aggressive: Hold through TP1 for TP2 or TP3
Conservative: Full exit at TP1 (1:1 risk/reward)
After TP1 hits, consider moving stop to breakeven
TP3 rarely hits - only on strong trending days
### Filter Combinations
Maximum Quality: Volume + Trend + FVG (fewest signals, highest quality)
Balanced: Volume + Trend (good quality, reasonable frequency)
Active Trading: No filters or Volume only (many signals, lower quality)
Trending Markets: Trend filter essential (indices, crypto)
Range-Bound: Volume + FVG (avoid trend filter)
### Common Mistakes to Avoid
Chasing breakouts - wait for the bar to close, don't FOMO into wicks
Ignoring the stop loss - always use it, move it manually if needed
Over-leveraging - the calculator shows MAX shares, you can buy less
Trading every signal - quality > quantity, use filters
Not tracking results - keep a journal to see what works for YOU
## Pros and Cons
### Advantages
Complete all-in-one solution - from signal to position sizing
Multiple timeframes tracked simultaneously
Visual clarity - easy to see what's happening
Cycle tracking catches opportunities others miss
Built-in risk management eliminates guesswork
Customizable filters for different trading styles
No repainting - what you see is locked in
Works across multiple markets (stocks, forex, crypto)
### Limitations
Intraday strategy only - doesn't work on daily charts
Requires active monitoring during first 1-2 hours of session
Not suitable for after-hours or extended sessions by default
Can produce many signals in choppy markets (use filters)
Dashboard can be overwhelming for complete beginners
Performance depends on market conditions (trends vs ranges)
Requires understanding of risk management concepts
### Best For
Day traders who can watch the first 1-2 hours of market open
Traders who want systematic entry/exit rules
Those learning proper position sizing and risk management
Active traders comfortable with multiple signals per day
Anyone trading liquid instruments with clear sessions
### Not Ideal For
Swing traders holding multi-day positions
Set-and-forget / passive investors
Traders who can't watch market open
Complete beginners unfamiliar with trading concepts
Low volume / illiquid instruments
## Frequently Asked Questions
Q: Why are no signals appearing?
A: Check that you're on an intraday timeframe (5min, 15min, etc.) and that the current time is within your session hours. Also verify that "Enable Breakout Detection" is ON and at least one ORB stage is enabled. If using filters, they might be blocking signals - try disabling them temporarily.
Q: What's the best ORB stage to use?
A: ORB15 (15 minutes) is most popular and balanced. ORB5 gives faster signals but more noise. ORB30 and ORB60 are slower but more reliable. Many traders use ORB15 + ORB30 together.
Q: Should I enable all the filters?
A: Start with no filters to see all signals. If too many false signals, add Volume filter first (stocks) or Trend filter (trending markets). FVG filter is most restrictive - use for maximum quality but fewer signals.
Q: How do I know which stop loss method to use?
A: ATR works for most cases - it adapts to volatility. Use ORB% if you want predictable stop placement. Swing is for respecting chart structure. Safer gives you the most room but largest risk.
Q: Can I use this for swing trading?
A: Not really - ORB is fundamentally an intraday strategy. The ranges reset each day. For swing trading, look at weekly support/resistance or moving averages instead.
Q: Why do TP/SL lines disappear sometimes?
A: Lines freeze (stop extending) when: stop loss is hit, the last enabled take-profit is hit, or end of session arrives (if "Freeze at EOD" is enabled). This is intentional - the trade is complete.
Q: What's the difference between "First Only" and "Track Cycles"?
A: "First Only" shows one breakout UP and one DOWN per day maximum - clean but might miss opportunities. "Track Cycles" shows breakout-retest-rebreak sequences - more signals but busier chart.
Q: Is position sizing accurate for options/forex?
A: The calculator is designed for shares (stocks). For options, ignore the share count and use the risk amount. For forex, you'll need to adapt the lot size calculation manually.
Q: How much capital do I need to use this?
A: The indicator works for any account size, but practical day trading typically requires $25,000 in the US due to Pattern Day Trader rules. Adjust the "Account Size" setting to match your capital.
Q: Can I backtest this strategy?
A: This is an indicator, not a strategy script, so it doesn't have built-in backtesting. You can visually review historical signals or code a strategy script using similar logic.
Q: Why does the dashboard show different entry price than the breakout label?
A: If you're looking at an old breakout, the ORB levels may have changed when the next stage completed. The dashboard always shows the CURRENT active range and trade setup.
Q: What's a good win rate to expect?
A: ORB strategies typically see 40-60% win rate depending on market conditions and filters used. The strategy relies on positive risk/reward ratios (2:1 or better) to be profitable even with moderate win rates.
Q: Does this work on crypto?
A: Yes, but crypto trades 24/7 so you need to define what "session start" means. Use Session Mode = Custom and set your preferred daily reset time (e.g., 0000-2359 UTC).
## Credits & Transparency
### Development
This indicator was developed with the assistance of AI technology to implement complex ORB trading logic.
The strategy concept, feature specifications, and trading logic were designed by the publisher. The implementation leverages modern development tools to ensure:
Clean, efficient, and maintainable code
Comprehensive error handling and input validation
Detailed documentation and user guidance
Performance optimization
### Trading Concepts
This indicator implements several public domain trading concepts:
Opening Range Breakout (ORB): Trading strategy popularized by Toby Crabel, Mark Fisher and many more talanted traders.
Fair Value Gap (FVG): Price imbalance concept from ICT methodology
SuperTrend: ATR-based trend indicator using public formula
Risk/Reward Ratio: Standard risk management principle
All mathematical formulas and technical concepts used are in the public domain.
### Pine Script
Uses standard TradingView built-in functions:
ta.ema(), ta.atr(), ta.vwap(), ta.highest(), ta.lowest(), request.security()
No external libraries or proprietary code from other authors.
## Disclaimer
This indicator is provided for educational and informational purposes only. It is not financial advice.
Trading involves substantial risk of loss and is not suitable for every investor. Past performance shown in examples is not indicative of future results.
The indicator provides signals and calculations, but trading decisions are solely your responsibility. Always:
Test strategies on paper before using real money
Never risk more than you can afford to lose
Understand that all trading involves risk
Consider seeking advice from a licensed financial advisor
The publisher makes no guarantees regarding accuracy, profitability, or performance. Use at your own risk.
---
Version: 3.0
Pine Script Version: v6
Last Updated: October 2024
For support, questions, or suggestions, please comment below or send a private message.
---
Happy trading, and remember: consistent risk management beats perfect entry timing every time.

FU Candle Detector (Smart Money Concept) En Anglais🧠 Overall concept: “FU Candle” in Smart Money logic
In the context of Smart Money Concepts (SMC) or ICT (Inner Circle Trader), an FU Candle (also known as a “Fakeout Candle” or “Manipulation Candle”) is a candle that:
Creates an imbalance or a break (often above a swing high or below a swing low),
Attracts liquidity by trapping retail traders (liquidity grab),
Then abruptly reverses direction, revealing the hand of “Smart Money” (large institutions).
It therefore often marks:
The point of manipulation before an impulsive movement (reversal),
An area of interest for entering in the institutional direction (after the liquidity grab).
---
⚙️ How the “FU Candle Detector” script works
The script identifies these candlesticks by observing several typical criteria:
1. Detection of the manipulative candle (FU Candle)
Search for a candlestick that breaks a previous swing (significant high or low),
But closes in the opposite direction, often below/above the broken zone,
Thus indicating a fakeout.
Examples:
Bullish FU Candle: breaks a previous low, but closes bullish.
Bearish FU Candle: breaks a previous high, but closes bearish.
---
2. Visualization on the chart
The script generally displays:
🔴 Red markers for bearish FUs (Fake Breakout upwards),
🟢 Green markers for bullish FUs (Fake Breakout downwards),
🟦 Rectangles of areas of interest (often around the FU Candle Open),
📏 Horizontal lines on areas of imbalance (OB/FVG if integrated).
---
3. Possible additions depending on the version
Depending on the version you have received, the script can also:
Detect Fair Value Gaps (FVG) around FU Candles,
Mark Order Blocks (OB) associated with manipulation,
Add alerts when new FU Candles are detected,
Calculate the distance between the manipulation point and the price return,
Filter according to candle size, volume, or market structure (MSB/CHoCH).
---
🎯 Practical use
FU Candles are often used:
As confirmation of an imminent reversal,
To identify institutional entry zones (hidden Order Block),
To anticipate the direction of the next impulse after the liquidity hunt.
Typical entry example:
> Wait for the formation of an FU Candle + price return within the candle body = entry in the opposite direction to the false breakout.
📈 Recommended combinations
This detector is often combined with:
Structure Break Indicator (CHoCH / BOS)
Liquidity Pool Zones
Fair Value Gap Finder
Order Block Detector
This gives you a complete Smart Money Concept system, capable of mapping:
1. Where liquidity has been taken,
2. Where the price is rebalancing,
3. Where Smart Money is repositioning its orders.

Automatic Higher Timeframe Dividers [@gaucho_trader]🧭 Overview
The HTF Separators (auto) indicator automatically draws vertical lines marking the start of each candle belonging to a higher–timeframe (HTF).
This allows you to visually identify the boundaries of higher–timeframe candles within your current chart — an essential concept for multi–timeframe (MTF) analysis.
For example:
On a 15-minute chart, each line marks the start of a new 4-hour candle.
On a 1-hour chart, the lines show where each daily candle begins.
On a daily chart, they highlight the start of each month.
These vertical separators help you recognize moments when price often reacts or shifts, since the open of a new higher-timeframe candle frequently aligns with impulses, reversals, or structural changes.
⚙️ Main Features
✅ Automatic timeframe mapping:
1m → 15m
3m → 30m
5m → 1H
15m → 4H
1H → 1D
4H → 1W
1D → 1M
✅ Full customization:
Line color
Line width
Style (solid, dashed, or dotted)
✅ Optional HTF label:
Display a small label showing the detected higher timeframe (e.g. “HTF: 4H”).
🧩 How to use
Add the indicator to your chart.
Adjust the color, width, and style to your preference.
(Optional) Enable the label to display the current HTF being tracked.
Watch how vertical lines automatically appear whenever a new higher-timeframe candle starts.
This helps you align your trades and analysis with higher-timeframe structure, giving you a clearer understanding of market cycles and timing.
💡 Practical Example
If you trade on a 15-minute chart, each separator line represents the start of a 4-hour candle.
Use it to:
Understand the context of your current candle within the larger trend.
Spot key reaction points at HTF opens.
Time entries and exits around HTF shifts.
🧠 Best for
Traders using multi-timeframe analysis (MTF)
Intraday and swing traders seeking better HTF alignment
Anyone wanting a cleaner and more structured chart view
📈 Automatic Higher Timeframe Dividers is a lightweight, practical tool that brings clarity and temporal precision to your technical analysis — helping you instantly see where each major candle begins on your chart.

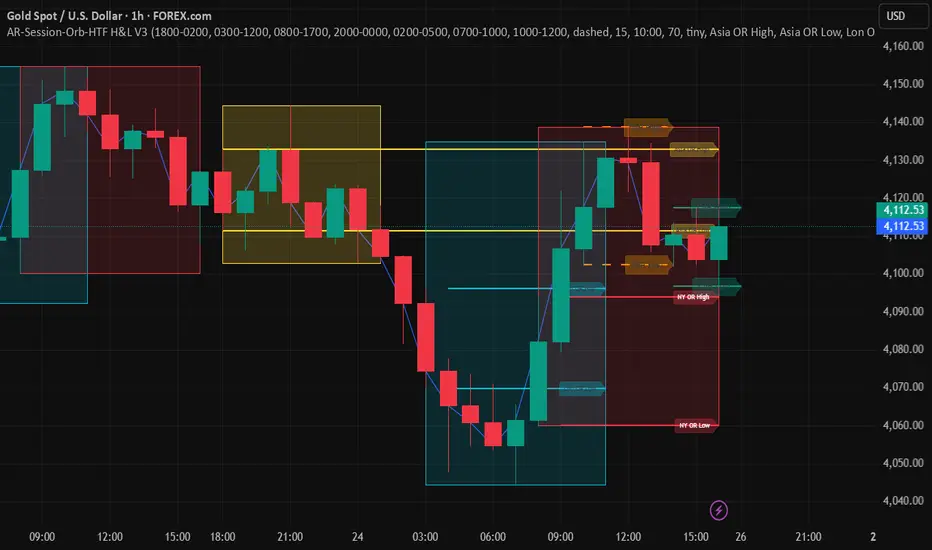
AR-Session-Orb-HTF H&L V3This indicator is built for intraday model execution around liquidity grabs, session timing, and higher-timeframe draw-on-liquidity. It maps out sessions, killzones, opening ranges, and key highs/lows from higher timeframes directly onto any lower timeframe chart (down to 1 minute).
________________________________________
1. Sessions (Asia / London / New York)
• Highlights the 3 main sessions with colored boxes:
o Asia
o London
o New York
• Default session times are set in New York local time:
o Asia: 18:00–02:00
o London: 03:00–12:00
o New York: 08:00–17:00
• You can change these times in the settings.
• Each box automatically expands as the session progresses.
These session windows make it easy to see where liquidity builds and when expansion usually happens.
________________________________________
2. ICT Killzones
The script includes 4 configurable killzones (also based on NY local time by default):
• Asia late session: 20:00–00:00
• London killzone: 02:00–05:00
• New York AM: 07:00–10:00
• New York Midday: 10:00–12:00
For each killzone, the script draws vertical dashed/dotted markers at the start and end of that window so you can quickly see if price is operating inside a high-probability delivery period.
You can:
• toggle each killzone on/off
• adjust the time windows
• choose line style (dashed or dotted)
• choose marker color
________________________________________
3. Opening Range Levels
The indicator captures the high and low of the first X minutes (default 15) of each important window and projects those levels as horizontal lines.
It does this for:
• Asia Open Range
• London Open Range
• New York Open Range
• New York Mid-Session Range (2nd NY range later in the session)
Behavior:
• Asia OR: after the first X minutes of Asia session, the high/low are projected across the entire rest of the trading day.
• London OR: first X minutes of London, then the levels extend only during the London session.
• NY OR: first X minutes of New York, extended only while NY session is active.
• NY Mid OR: a second New York range that starts later in the session (default 10:00). It also uses the first X minutes from that custom start time and extends through the rest of NY.
You can:
• choose the range length in minutes (1–30)
• style each session’s OR separately (colors, on/off)
• show/hide labels on every range
Labels are fully customizable:
• Text (e.g. “NY OR High”, “Asia OR Low”, “NY Mid High”)
• Label background color
• Label text color
• Label size
• Opacity
This gives you clear reference levels that often act as liquidity pools, targets, or rejection points.
________________________________________
4. Previous Week High / Low
The script plots the previous week’s high and low on any timeframe.
• Drawn as dashed lines.
• Lines are kept inside the visible chart area instead of stretching forever.
• Each level is labeled (default “PW High” / “PW Low”), and you can rename and recolor those labels.
These are common liquidity targets for the current week.
________________________________________
5. Monthly High / Low
The script plots BOTH:
• Previous Month High / Low
• Current Month High / Low (live, updating)
Behavior:
• Previous Month levels are one style (default dashed / purple).
• Current Month levels are another (default solid / blue).
• All four levels get labels, which are customizable.
You can change:
• line colors
• label text
• label background color
• label text color
• label size / opacity
• how far back the lines extend on the chart (in bars)
This helps you frame higher-timeframe draw-on-liquidity without switching to the monthly chart.
________________________________________
6. 4H High / Low (Intra-session Liquidity Map)
On any timeframe up to 4H, the indicator also plots:
• Previous 4H candle high/low
• Current 4H candle high/low
Important:
• These levels are only drawn inside their specific 4H window.
o Previous 4H high/low is only drawn across the timestamps of the PREVIOUS 4H candle.
o Current 4H high/low is only drawn across the CURRENT 4H candle as it forms.
• They do not extend across the whole day.
Each one is labeled too (for example “P4H High”, “C4H Low”), and you can edit those names and colors.
This is extremely useful for scalping, because price often raids the previous 4H high/low during London or NY and reverses.
________________________________________
7. Customization / Inputs
Everything is editable:
• Session windows and colors
• Killzone windows, style (dashed/dotted), and color
• Opening range length (in minutes)
• Which opening ranges to show (Asia / London / NY / NY Mid)
• Text and style of every label
• Line colors for weekly, monthly, and 4H levels
• How far HTF levels should extend on the chart (bars span)
• Label size and background opacity for higher timeframe levels
This indicator is meant to be traded visually at your own confluence points, not to spam signals.
________________________________________
How to Use
Typical workflow:
1. Use monthly / weekly levels to understand macro draw on liquidity.
2. Use session box + killzone timing to know when to pay attention.
3. Use opening range highs/lows as the “dealing range” and watch liquidity runs above/below those.
4. Use previous 4H and current 4H highs/lows to frame premium/discount and stop runs inside the active session.
This gives you a top-down bias and an intraday execution model all on one chart without flipping timeframes.
________________________________________
Notes
• Times are interpreted in the chart’s exchange/session timezone. If you trade off NY time, keep your chart in NY session or adjust the inputs.
• TradingView has drawing/label limits. On extremely low timeframes far back in history, some older drawings may recycle. This is expected.
________________________________________
Disclaimer
This script is for educational and charting purposes only.
It does not generate trade signals, manage risk, or guarantee profitability.
Trading involves risk. Do your own analysis.
Special Thanks to Sabo & Hive Community
AR-Session-Orb-HTF H&L V2AR-Session-Orb-HTF H&L V2
This indicator is designed for intraday traders who use session-based liquidity, opening range logic, and higher-timeframe levels for bias and execution.
It automatically:
• draws Asia / London / New York sessions
• marks the first X minutes of each session (opening range)
• projects that range across the session (or across the entire day for Asia)
• shows previous week, previous month, current month, previous 4H, and current 4H highs/lows directly on lower timeframes with labels
It’s built for ICT-style execution, liquidity raids, and dealing range concepts.
________________________________________
🔸 Session Boxes
The script highlights the 3 main FX/Index sessions:
• Asia Session
• London Session
• New York Session
Each session is drawn as a translucent box on the chart with its own color. Session start/stop times are user-configurable (HHMM-HHMM input format).
You can individually enable/disable:
• Asia box
• London box
• New York box
These boxes help visualize when liquidity is usually accumulated / distributed.
________________________________________
🔸 Opening Range (OR)
For each session, the script measures the high/low of the first N minutes (default 15 minutes).
This is commonly traded as the “opening range.”
Behavior per session:
• Asia OR:
The high and low of the first X minutes of Asia are captured, then those levels are projected across the entire rest of the trading day.
(This gives you a day-long reference band for Asia liquidity / range expansion.)
• London OR & New York OR:
The script captures the first X minutes of London and NY, then draws horizontal lines from that moment forward, but only during that active session.
When the session ends, the lines stop. They do NOT extend infinitely.
You can:
• choose how many minutes define the OR (1–30 min)
• toggle visibility per session
• set the color per session
This helps you identify when price is running / rejecting the opening range high/low.
________________________________________
🔸 Daily High / Low Logic (internal use)
The script internally tracks the developing current day high and low and remembers where the day started.
This is used to anchor the Asia opening range levels across the full day (so they stay inside today, not extended off into space).
You don’t have to manage this — it’s automatic and resets each new trading day.
________________________________________
🔸 Weekly Liquidity (Previous Week High/Low)
The indicator plots:
• Previous Week High
• Previous Week Low
These are pulled from the higher timeframe (1W) and displayed on the current chart (even on 1m).
They’re drawn as dashed horizontal lines inside the visible chart area instead of being extended forever.
Each line is labeled with custom text input:
• Example defaults: PW High, PW Low
You can rename these in settings and change label color / background color.
This gives you prior-week liquidity targets even when you’re down on scalping timeframes.
(Optional future extension: current week high/low can also be added if you want developing weekly liquidity. Not currently shown by default.)
________________________________________
🔸 Monthly Liquidity
The script plots both:
• Previous Month High / Low
• Current Month High / Low (live)
Previous month levels are drawn with one style (default dashed + one color).
Current month levels are drawn with another (default solid + different color).
All four lines are labeled.
Labels are fully customizable:
• Text you want to display
• Label background color
• Label text color
• Label size
• Label opacity
This gives you HTF liquidity magnets on any timeframe down to 1m.
________________________________________
🔸 4H Liquidity Map (Intraday Bias Tool)
This part is meant for scalpers.
On any timeframe ≤ 4H, the script plots:
• Previous 4H High / Previous 4H Low
• Current 4H High / Current 4H Low
Important detail:
• These levels are ONLY drawn across their own 4-hour window.
• Previous 4H levels are drawn across the exact time span of the previous 4H candle.
• Current 4H levels are drawn across the current 4H candle as it forms.
• They do NOT extend across the whole day, so you can read structure candle-by-candle.
Visually:
• Previous 4H levels use one color/style (default dashed).
• Current 4H levels use another (default solid).
• Each has a label, e.g. P4H High, C4H Low, etc.
• You can rename the labels and recolor them in settings.
This helps you immediately see which 4H range you’re trading inside, where the internal liquidity sits, and whether price is working a raid of the previous 4H high/low.
________________________________________
🔸 Customization / Inputs
The script exposes inputs for:
• Session times (Asia / London / NY)
• Whether to show each session box
• Colors for each session box (border + fill)
• Opening Range length (minutes)
• Whether to show Asia/London/NY OR lines
• OR line color per session
• Line span length in bars (for higher timeframe levels, so they stay “near” current price instead of stretching off-screen)
• Label text for each level group:
o Prev Week
o Prev Month / Current Month
o Prev 4H / Current 4H
• Label style: size, text color, background color, background opacity
No hard-coded text. No forced color scheme. You can brand it for your own workflow.
________________________________________
How to Use It
1. Bias:
Use monthly / weekly levels to understand where the larger liquidity pools sit. Are we hunting last month’s high? Sitting above last week’s low?
2. Intra-session context:
Use session boxes + opening range to see when expansion is happening and whether price is accumulating (consolidation) or delivering (impulsive move) in that session.
3. Execution / scalps:
Use 4H (prev/current) highs and lows as liquidity reference points for stops / targets.
Common idea: wait for a raid of the previous 4H high during London or NY, at or above the OR high, then look for reversal orderflow.
4. Do not blindly long/short a level.
Levels are context. Your trade model / confirmation is still on you.
________________________________________
Notes / Limitations
• This tool is for visual reference only.
It does not generate buy/sell signals, alerts, or risk management for you.
• Session time inputs assume exchange time / chart time. Make sure your chart is set to the session timezone you expect.
• Because TradingView limits drawings, if you scroll extremely far back in time on very low timeframes, some older objects may recycle. This is normal.
________________________________________
Disclaimer
This script is for educational/visual study purposes only.
It is NOT financial advice.
Trading in leveraged / derivative / FX / crypto products involves significant risk and can result in loss of capital.
You are responsible for your own decisions.
Special Thanks to HIVE Community

Session Highs and LowsThis indicator highlights the New York, London, and Asian trading sessions — plotting each session’s highs and lows directly on your chart to help visualize intraday ranges and liquidity levels.
⸻
✨ Features
• Session Range Visualization
Automatically marks the high and low of each trading session with colored lines.
This makes it easy to identify where price expanded, consolidated, or built liquidity during each market phase.
• Session Background Zones (Optional)
Toggle background fills to highlight active sessions for clearer visual separation of NY, London, and Asian trading hours.
• Customizable Settings
• Enable or disable each session independently
• Adjust session times and colors
• Choose whether to fill session backgrounds
• Timezone Aware
All sessions are aligned to New York time by default, ensuring consistent mapping across instruments.
⸻
🎯 Use Case
A perfect tool for traders who track session-based liquidity, breaks of structure, or session-to-session continuity.
Quickly spot the Asian range, London expansion, and New York reversal windows — key components in intraday strategy development.
⸻
⚙️ Inputs
• Toggle sessions: NY / London / Asian
• Background fill on/off
• Label color customization
• Adjustable session times
⸻
📈 Why Use It
Understanding where each session establishes its range high and low provides critical context for liquidity grabs, session overlaps, and structural shifts throughout the day.
This simple yet powerful visual map enhances precision for ICT-style, smart money, or price action-based trading models.

Rally, Base & Drop 🔹 Rally–Base–Drop (RBD) Indicator
📘 Description
The Rally–Base–Drop (RBD) indicator automatically detects and highlights key supply zones formed when price rallies, consolidates (the base), and then sharply drops — one of the most powerful Smart Money and institutional footprints.
This tool helps traders easily spot institutional supply zones, showing where big money previously entered the market to push price lower.
It’s perfect for traders using Smart Money Concepts (SMC), supply & demand, or price action–based confluence setups.
⚙️ How It Works
Detects strong impulsive rallies followed by a consolidation base (2–5 candles).
Confirms the drop leg once price breaks structure to the downside.
Marks the origin of supply (the last bullish candle before the drop).
Extends that zone forward as a potential reversal area for future retests.
Optional visual settings allow you to:
Adjust zone sensitivity (to capture cleaner or tighter bases).
Highlight only the most recent or all historical zones.
Customize colors and opacity for clarity.
📊 Use Case
Wait for price to rally, base, and drop.
Mark the RBD zone identified by the indicator.
When price retraces to that zone, look for:
Rejection candles
Breaks of minor structure
Entry confirmation on lower timeframes (5m–15m)
Target the next demand zone or equal lows.
🧠 Best For
Smart Money & ICT traders
Supply/Demand strategy users
Swing and intraday traders
Anyone wanting to visualize institutional footprints automatically🏁 Summary
This RBD indicator automates one of the most reliable institutional patterns — the rally → base → drop — giving you clear visual supply zones to trade from.
Use it for confluence with market structure, EMAs, or fair value gaps to spot high-probability reversals.

Buyside & Sellside Liquidity The Buyside & Sellside Liquidity Indicator is an advanced Smart Money Concepts (SMC) tool that automatically detects and visualizes liquidity zones and liquidity voids (imbalances) directly on the chart.
🟢 Function and meaning:
1. Buyside Liquidity (green):
Highlights price zones above current price where short traders’ stop-loss orders are likely resting.
When price sweeps these areas, it often indicates a liquidity grab or stop hunt.
👉 These zones are labeled with 💵💰 emojis for a clear visual cue where smart money collects liquidity.
2. Sellside Liquidity (red):
Highlights zones below the current price where long traders’ stop-losses are likely placed.
Once breached, these often signal a potential reversal upward.
👉 The 💵💰🪙 emojis make these liquidity targets visually intuitive on the chart.
3. Liquidity Voids (bright areas):
Indicate inefficient price areas, where the market moved too quickly without filling orders.
These zones are often revisited later as the market seeks balance (fair value).
👉 Shown as light shaded boxes with 💰 emojis to emphasize imbalance regions.
💡 Usage:
• Helps spot smart money manipulation and stop hunts.
• Marks potential reversal or breakout zones.
• Great for traders applying SMC, ICT, or Fair Value Gap strategies.
✨ Highlight:
Dollar and money bag emojis (💵💰🪙💸) are integrated directly into chart labels to create a clear and visually engaging representation of liquidity areas.


Previous Period High/Low LevelsThis indicator plots the previous day, week, and month high and low levels to highlight key liquidity levels.
Perfect for traders using market structure, liquidity, or SMC concepts.
Features:
Auto-plots PDH/PDL, PWH/PWL, and PMH/PML
Adjustable line styles, widths, and label sizes
Toggle price display on or off
Accurate UTC offset handling

Thiru Time CyclesThiru Time Cycles - Advanced Institutional Trading Framework
🔥 PROPRIETARY TIME CYCLE ANALYSIS SYSTEM
This comprehensive indicator implements a multi-layered institutional trading framework that combines session-based analysis, proprietary time cycle detection, and advanced market structure tracking. The system is built on original research into institutional order flow and market timing.
━━━━━━━━━━━━━━━━━━━━━━━━━━━━━━━━━━━━━━━━━━━━━━
📊 CORE COMPONENTS
1. ZEUSSY 90-MINUTE TIME CYCLES (Proprietary ADM Framework)
• Accumulation Phase (A): Early session liquidity gathering
• Distribution Phase (D): Mid-session momentum and trend development
• Manipulation Phase (M): Late session volatility and reversals
Coverage:
• London Session: 3 complete 90-minute cycles (2:30-7:00 AM)
• NY AM Session: 3 complete 90-minute cycles (7:00-11:30 AM)
• NY PM Session: 3 complete 90-minute cycles (11:30-4:00 PM)
How It Works:
Each trading session is divided into three distinct 90-minute phases that represent institutional behavior patterns. The Accumulation phase identifies early positioning, Distribution shows trend development, and Manipulation captures late-session reversals. This proprietary framework is based on analysis of institutional order flow across thousands of trading sessions.
2. ZEUSSY 30-MINUTE SUB-CYCLES (Precision Timing)
• A1, A2, A3: Three 30-minute subdivisions of Accumulation phase
• M1, M2, M3: Three 30-minute subdivisions of Distribution phase
• D1, D2, D3: Three 30-minute subdivisions of Manipulation phase
Each 90-minute cycle contains 3 sub-cycles for precise entry/exit timing. Color-coded boxes (Blue/Red/Green) indicate phase progression within each major cycle.
3. ZEUSSY TRADE SETUP TIME WINDOWS (Optimal Entry Zones)
• London: 2:30-4:00 AM (First 90-minute cycle - highest probability)
• NY AM: 9:30-10:30 AM (Market open volatility capture)
• NY PM: 1:30-2:30 PM (Afternoon momentum continuation)
These windows represent statistically validated high-probability entry zones within each major session, identified through proprietary backtesting of institutional participation patterns.
4. TOI TRACKER (Time of Interest - Critical Decision Points)
Tracks six critical time windows per day when institutional decisions create high-probability setups:
London Session:
• 2:45-3:15 AM: Early London accumulation
• 3:45-4:15 AM: London momentum confirmation
NY AM Session:
• 9:45-10:15 AM: Post-open institutional positioning
• 10:45-11:15 AM: Late morning trend confirmation
NY PM Session:
• 1:45-2:15 PM: Afternoon setup phase
• 2:45-3:15 PM: Final positioning before power hour
The TOI Tracker uses horizontal lines with customizable extension to mark precise highs and lows during these critical windows.
5. KILLZONE BOXES (Session Visualization)
Customizable session overlays with adjustable:
• Box styles (Box/Background/Hamburger/Sandwich)
• Border styles and transparency
• Unified or session-specific colors
• Background and text display options
Sessions: Asia, London, NY AM, NY PM, Lunch, Power Hour
6. KILLZONE PIVOTS (Dynamic Support/Resistance)
• Automatic high/low detection for each session
• Pivot extension until mitigation
• Midpoint calculations for precision entries
• Alert system for pivot breaks
• Enhanced label styling with session colors
The system tracks when price "mitigates" (breaks through) each session's pivot levels and can alert traders in real-time.
7. DAY/WEEK/MONTH ANALYSIS
• Daily/Weekly/Monthly open prices
• Previous high/low levels
• Day of week labels
• Session separators
• Current week filtering
Higher timeframe reference levels for context and confluence.
8. OPENING PRICE LINES
Up to 8 customizable opening price lines for specific times:
• Daily Candle (DC) Open: 6:00 PM
• Midnight Open: 12:00 AM
• Market Open: 9:30 AM
• Custom times as needed
These lines extend until a "cutoff time" (default 4:00 PM) for clean chart presentation.
9. VERTICAL TIMESTAMPS
Optional vertical lines to mark specific times of day for quick visual reference of session boundaries.
10. TOI VERTICAL LINES (Cycle Separators)
Advanced visualization of 90-minute and 30-minute cycle boundaries:
• 90-minute cycle separators (solid lines)
• 30-minute sub-cycle separators (dotted lines)
• Customizable colors, styles, widths, and opacity
• Adjustable line heights (full chart or custom percentage)
━━━━━━━━━━━━━━━━━━━━━━━━━━━━━━━━━━━━━━━━━━━━━
🎯 TRADING APPLICATIONS
**Scalping (1-5 minute charts):**
• Use 30-minute sub-cycles for precise entries
• TOI Tracker for high-probability windows
• Killzone pivots for stop placement
**Day Trading (15-60 minute charts):**
• 90-minute cycles for trend direction
• Zeussy Trade Setup Windows for entries
• Session pivots for targets
**Swing Trading (4H-Daily charts):**
• Daily/Weekly/Monthly levels for context
• Major session analysis for timing
• Killzone pivots for key levels
**Institutional Analysis:**
• Track ADM phases for order flow understanding
• Identify accumulation/distribution/manipulation patterns
• Anticipate session-based volatility
━━━━━━━━━━━━━━━━━━━━━━━━━━━━━━━━━━━━━━━━━━━━━
🔧 TECHNICAL SPECIFICATIONS
• Built on Pine Script v6
• Maximum efficiency: 500 labels, 500 lines, 500 boxes
• Multi-timezone support (GMT-12 to GMT+14)
• Timeframe limiting for optimal display
• Drawing limit controls for performance
• Advanced table displays for statistics
• Real-time alert system
• Professional watermark customization
━━━━━━━━━━━━━━━━━━━━━━━━━━━━━━━━━━━━━━━━━━━━━
💡 WHAT MAKES THIS UNIQUE
1. **Zeussy ADM Framework**: Proprietary 90-minute cycle analysis based on institutional behavior patterns (Accumulation/Distribution/Manipulation)
2. **Multi-Layer Time Analysis**: Combines 90-minute cycles, 30-minute sub-cycles, and specific TOI windows for comprehensive market timing
3. **Trade Setup Windows**: Statistically validated optimal entry zones derived from institutional participation analysis
4. **Integrated System**: Seamlessly combines multiple analysis methods (time cycles, pivots, levels, TOI) in one cohesive framework
5. **Professional Grade**: Enterprise-level customization with performance optimization and clean visual presentation
6. **Original Research**: Based on proprietary analysis of institutional order flow patterns across major forex and futures markets
━━━━━━━━━━━━━━━━━━━━━━━━━━━━━━━━━━━━━━━━━━━━━
📈 CUSTOMIZATION OPTIONS
• 10+ Input Groups for granular control
• Session timing and colors
• Box and line styling
• Label sizes and positions
• Transparency controls
• Timeframe limiting
• Drawing limits
• Alert configurations
• Table displays
• Watermark branding
━━━━━━━━━━━━━━━━━━━━━━━━━━━━━━━━━━━━━━━━━━━━━
⚠️ USAGE NOTES
• Best used on GMT-4 timezone for consistency
• Recommended timeframes: 1m-60m for intraday analysis
• Works on all markets: Forex, Indices, Commodities, Crypto
• Combine with price action and market structure for best results
• The Zeussy framework is most effective during active trading sessions
━━━━━━━━━━━━━━━━━━━━━━━━━━━━━━━━━━━━━━━━━━━━━
This indicator represents years of research into institutional trading patterns and time-based market analysis. The proprietary Zeussy framework and TOI tracking system are not available in any open-source form.
© 2025 Thiru Trades - All Rights Reserved

Thiru TOI TrackerProfessional-grade Time-of-Interest (TOI) tracker that identifies critical trading windows using proprietary institutional flow analysis and dynamic line extension algorithms.
🎯 WHAT THIS INDICATOR DOES
The Thiru TOI Tracker is a sophisticated trading tool that identifies and visualizes critical Time-of-Interest (TOI) periods in the market. Unlike traditional time-based indicators that use static markers, this system employs proprietary algorithms to dynamically adapt to market conditions, providing institutional-grade timing analysis.
🔬 UNIQUE METHODOLOGY & ALGORITHM
1. Proprietary Time Window Detection - Multi-Session Analysis
2. Dynamic Line Extension Technology - Adaptive Support/Resistance
3. Advanced Memory Management - Intelligent Cleanup
4. Multi-Dimensional Visualization - Comprehensive Market Structure
🚀 UNIQUE VALUE PROPOSITION
- Dynamic vs Static: Adapts to market conditions
- Institutional Logic: Based on trading pattern analysis
- Multi-Session Correlation: Comprehensive analysis
- Advanced Performance: Optimized memory management
- Customizable Interface: Adapts to trading styles
📊 HOW TO USE
- Apply to 1m-15m timeframes for best results
- Configure session settings based on trading style
- Customize visual elements for chart clarity
- Use timeframe filter to prevent false signals
🔒 PROPRIETARY PROTECTION JUSTIFIED BY:
- Unique methodology based on institutional analysis
- Dynamic adaptation algorithms
- Performance innovation
- Extensive research investment
- Competitive advantages
Developer: ThiruDinesh | Contact: TradingView @ThiruDinesh
Copyright: © 2025 ThiruDinesh - All Rights Reserved
```

Thiru-Killzones"Thiru-Killzones - Enhanced FX Market Sessions Indicator
This is an enhanced version of the popular FX Market Sessions indicator with the following improvements:
🔧 ENHANCEMENTS:
• Added 5th Session support (NYPM - New York PM session)
• Removed all alert functionality for cleaner chart display
• Optimized plot usage to stay within TradingView's 64-plot limit
• Cleaned up UI by removing bullet point separators
• Enhanced session box styling and visibility
• Improved table display with proper row management
📊 FEATURES:
• 5 customizable trading sessions (Asia, London, NYAM, Lunch, NYPM)
• Session time zones and extensions
• Opening range detection
• Fibonacci level overlays
• Bar coloring options
• Analysis tables with session statistics
🎯 USAGE:
Perfect for identifying key market sessions and their impact on price action.
The 5-session setup provides comprehensive coverage of global FX markets.
Based on the original FX Market Sessions indicator by boitoki, enhanced with additional functionality."

Minute/Hour Sum 3-6-9**Important:** Use Eastern Standard Time (EST) and apply this on the 1-minute timeframe. Check that the minute digits are summing correctly—for example, at 7:45 AM, the indicator should show “9” because 4+5=9. If sums aren’t correct, adjust the timezone offset until they align perfectly.
This Pine Script creates the "Minute/Hour Sum 3-6-9" timing indicator, highlighting candles where the digits of the current minute or hour (depending on the timeframe) add up to 3, 6, or 9—numbers popular in cyclical and vibrational timing concepts like the 3-6-9 pattern.
On intraday charts below 1 hour it sums the digits of the minute, such as 21 which becomes 2+1=3. On hourly or higher charts, it sums the digits of the hour, like 12 which becomes 1+2=3. The indicator plots a label “3,” “6,” or “9” above or below the candle depending on whether it is bearish or bullish. Sum numbers change with direction to visually signal sentiment. You can adjust the timezone offset to align with your local RTH or ICT timing.
In this rhythmic model, the “9” candle is often seen as the entry or decision candle. A “9” sum bar marks the completion of a short intraday cycle. Traders consider the “9” as a potential turning or breakout point a candle where price may reverse, accelerate, or confirm direction after the 3–6 build-up. Typically, traders wait for the “9” label to form, confirm direction, then enter on that candle or the following one.

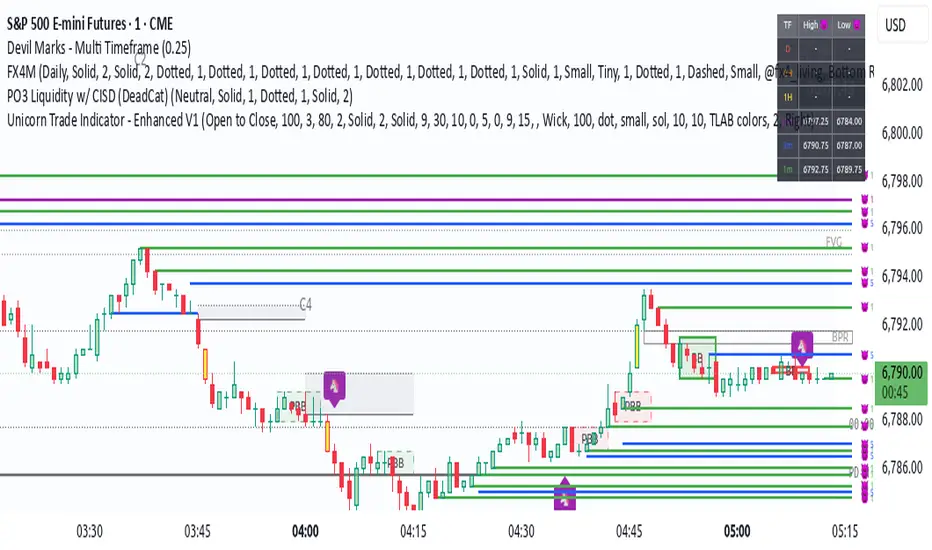
Unicorn Trade Indicator - Enhanced V1This code also contains pinescripts from iFVG (BPR) by Algorize and Visualizing displacement by tradeforopp who have kindly provided them as open source.
An ICT Unicorn is where a breaker block is traded through which incorporates a fair value gap. I decided to code this indicator as I couldn't find an existing free indicator on Trading View that performed adequately.
This indicator will highlight breaker blocks and when broken will post an Unicorn emoji and send an alert if requested. The last 3 breaker blocks are displayed, the prior boxes are labled PBB and are shown as red for bearish and green for bullish. After the main Unicorn is posted, the code continues to mark market structure shifts.
As all trading strategies work better with confluence I have added several other features which is very useful for people who are restricted on the number of indicators that can place on a single chart.
I have added iFVG (BPR) by Algoryze and Visualizing displacement by tradeforopp which have kindly been made open source by the authors. My thanks to them for their hard work.
Unicorn alerts will only be sent when a yellow displacement candle ( from the Visualizing displacement code) is present along with the Unicorn as this is the best type of Unicorn to trade.
The number of fvg's and bpr's from the code by Algoryze can be adjusted in the settings.
Also to add confluence I have used my own code to display liquidity depth boxes made popular by toodegrees.
I hope you find this indicator useful.

Previous session High/Low – Asia London USA Overview
This indicator automatically plots the Previous Day’s (PD) session Highs and Lows for the Asia (Tokyo), London, and USA (New York) trading sessions.
Each session is color-coded for clarity:
🟩 Asia (Green)
🟥 London (Red)
🟦 USA (Blue)
At the close of each session, the indicator records that session’s high and low, draws horizontal lines across the chart, and labels them neatly in the center of each range — above the high and below the low for perfect visual balance.
⚙️ How It Works
The script continuously tracks the current high and low within each session.
When a session closes, those values are locked in as the PD High and PD Low.
Clean lines and centered labels are drawn immediately.
The labels automatically offset slightly above or below the line to avoid overlap, with user-controlled spacing.
This helps traders quickly identify where price interacts with the previous session’s structure, a core concept for many session-based and liquidity-based strategies.
🧭 Sessions and Timezones
Each market session runs in its native timezone, so you can align them perfectly to your chart or your preferred trading hours:
Asia Session: Default 08:30 – 11:00 (Australia/Adelaide time)
London Session: Default 08:00 – 10:00 (Europe/London)
USA Session: Default 09:30 – 16:00 (America/New_York)
You can change each session’s hours and timezone from the Inputs panel.
🎨 Customization
In the Inputs menu you can:
Toggle each session on or off
Choose line color and thickness
Enable or disable labels
Adjust vertical offset (ticks) for label spacing
“High label offset” – moves label further above the high line
“Low label offset” – moves label further below the low line
These adjustments make it easy to keep charts clean and readable on any instrument or timeframe.
📈 Practical Use
This indicator is ideal for:
Session traders who mark PD Highs/Lows as liquidity zones
London or NY session scalpers who watch for breakouts, fakeouts, or reversals
ICT / Smart Money Concepts users wanting automatic session reference levels
Anyone wanting a quick visual map of inter-session structure

Vault FX Time + Price Indicator v1Collection of tools for analysis:
- Midnight Open Horizontal Price Line
- 09:30 Open Horizontal Price Line
- Midnight and 09:30 Vertical Price Lines
- NWOG painter
- Asia Range Box
- Asia Range H/L lines (Lines extend until purged or 10:00 AM NY, whichever occurs first)
- Asia Range Standard Deviation Levels (Customizable)
- Day Separators
- PDH/PDL | PWH/PWL | PMH/PML Lines w/ Alerts
- First Presented FVG for NY-AM Session (1min Chart)
- Timeframe Specific Swing High/Low Sweeps w/ Alerts (Requires user setup)
Some features are still being tested, let me know if you find any bugs!

Liquidity Swap Detector Ultimate - Cedric JeanjeanAdvanced Smart Money Concepts indicator designed to detect high-probability liquidity sweeps and institutional order flow reversals. This professional-grade tool combines multiple ICT (Inner Circle Trader) strategies to identify optimal entry points.
═══════════════════════════════════════════════════════
📊 KEY FEATURES:
✅ Smart Swing Detection
- Identifies confirmed swing highs and lows using adaptive lookback periods
- Eliminates false signals through double-confirmation logic
- Detects liquidity grabs at key market structure points
✅ Fair Value Gap (FVG) Analysis
- Multi-timeframe FVG detection for enhanced accuracy
- Filters imbalances by minimum size threshold
- Combines current timeframe and higher timeframe FVGs
✅ Advanced Volatility Filter
- ATR-based volatility analysis to avoid low-quality setups
- Adjustable volatility threshold (default 0.35%)
- Ensures entries during optimal market conditions
✅ Precision Signal Generation
- LONG signals: Confirmed swing lows + FVG + volatility confirmation
- SHORT signals: Confirmed swing highs + FVG + volatility confirmation
- Clear visual markers with price labels
✅ Comprehensive Alert System
- Three alert types: Simple, Detailed, JSON (for webhooks)
- Separate LONG/SHORT alert controls
- Compatible with MT5 integration via webhooks
- TradingView native alertcondition support
✅ Professional Dashboard
- Real-time ATR monitoring
- Volatility percentage display
- FVG status indicator
- Alert status tracker
═══════════════════════════════════════════════════════
⚙️ CUSTOMIZABLE PARAMETERS:
🔹 Lookback Swing (1-50): Defines swing detection sensitivity
🔹 ATR Multiplier: Controls wick filter strength
🔹 Volatility Filter: Minimum required market volatility (%)
🔹 FVG Filter: Minimum fair value gap size (%)
🔹 FVG Timeframe: Higher timeframe for multi-TF analysis
🔹 Visual Options: Toggle swing marks, FVG zones, labels
🔹 Alert Controls: Enable/disable LONG/SHORT notifications
═══════════════════════════════════════════════════════
📈 HOW IT WORKS:
1. The indicator scans for confirmed swing points using a robust double-confirmation algorithm
2. Simultaneously analyzes Fair Value Gaps on both current and higher timeframes
3. Validates market volatility to ensure sufficient price movement
4. Generates precise entry signals when all conditions align
5. Triggers customizable alerts for instant notification
═══════════════════════════════════════════════════════
🎯 BEST PRACTICES:
- Use on liquid markets (Forex majors, indices, crypto)
- Recommended timeframes: 15m, 1H, 4H
- Combine with support/resistance for confirmation
- Adjust lookback period based on market volatility
- Test alert settings before live trading
- Use JSON alerts for automated trading integration
═══════════════════════════════════════════════════════
⚡ ALERT CONFIGURATION:
1. Click the Alert icon (bell) in TradingView
2. Select "Liquidity Swap Detector Ultimate - TITAN v6"
3. Choose your preferred alert condition:
- LONG Signal: Only bullish setups
- SHORT Signal: Only bearish setups
- ANY Signal: All trading opportunities
4. Set expiration and notification preferences
5. For MT5 integration: Select "JSON" message type and configure webhook URL

PO3-Goldbach Fractal levels [promuckaj]This script is developed on time & price, algorithmic market theory that is well explained in the book "Demystifying ICT" by Hopiplaka.
What is fractals Goldbach levels and why this indicator is different then the other one based on GB levels to.
Well, the whole idea behind this script was born long time a go, when I write the first, well known, indicator for GB levels. This script allow you to set one master/main PO3 GB number, usually the higher one, and then decide what fractal GB levels you want there within 12 partitions of main(higher one) PO3 dealing range.
That means that you can deal with every single partition level from main one, RB, OB, FV, LV, BR and MB, and look them through prism of GB levels reserved for each of them.
Indicator contain all the options to deal with lines, labels, colors etc, including options for non-goldbach and CE levels. All of them could be modify separately for main and fractal levels.
Here is one example, lets set main PO3 GB number for NQ to be 2187.
We can see that we are at the moment in discount MB partition, so now let’s do the magic and activate some of fractals there, for example for MB and BR in discount zone and zoom in the chart.
I hope it is more then clear how this could be used in your analysis and trading plan.

FVG & IFVG Box Detector
The "FVG & IFVG Box Detector" is a custom Pine Script v6 indicator for TradingView that identifies and highlights Fair Value Gaps (FVGs) and their subsequent mitigation as Imbalance Fair Value Gaps (IFVGs) on a price chart. Tailored for use on a 5-minute timeframe (though it must be manually set by the user due to script limitations), this indicator provides a visual representation of market imbalances using colored boxes, which automatically disappear when the gaps are filled by price action. The script is designed to be clean and minimalistic, omitting text labels or annotations as per your preference.Key FeaturesFVG Detection:A Bullish FVG is detected when the low of the current candle is higher than the high of the candle two bars ago, indicating a potential upward imbalance, visualized with a green-bordered box filled with a semi-transparent green background.
A Bearish FVG is detected when the high of the current candle is lower than the low of the candle two bars ago, indicating a potential downward imbalance, visualized with a red-bordered box filled with a semi-transparent red background.
A minimum gap size filter (default 0%) can be adjusted to exclude small gaps, ensuring only significant imbalances are highlighted.
IFVG Transition:When a Bearish FVG is filled (price closes below its lower boundary), the red box disappears, and a blue-bordered box with a semi-transparent blue background briefly appears to mark the Bullish IFVG, indicating the zone may now act as support. This box then vanishes.
When a Bullish FVG is filled (price closes above its upper boundary), the green box disappears, and an orange-bordered box with a semi-transparent orange background briefly appears to mark the Bearish IFVG, indicating the zone may now act as resistance. This box then vanishes.
The disappearance of boxes reflects the resolution of the imbalance, keeping the chart uncluttered.
Customization:Users can toggle the display of Bullish FVGs, Bearish FVGs, Bullish IFVGs, and Bearish IFVGs via input settings.
The extendBars parameter (default 50) controls how far to the right the boxes extend, allowing adjustment of their visibility duration.
Colors for Bullish FVG, Bearish FVG, Bullish IFVG, and Bearish IFVG can be customized using TradingView’s color picker, with defaults set to semi-transparent green, red, blue, and orange, respectively.
Performance:The script includes a cleanup mechanism to limit the number of active boxes to 50 per type, preventing performance issues by deleting the oldest boxes when the limit is exceeded.
It uses static variable assignments to ensure compatibility with Pine Script v6’s strict type requirements for drawing functions.
FunctionalityThe indicator scans each bar on the 5-minute chart to detect FVGs based on the defined conditions.
Upon detection, it creates a box extending from the starting bar (two bars ago) to the current bar plus the extendBars value, using the high and low prices to define the box’s vertical range.
When price action fills an FVG, the original box is deleted, and a brief IFVG box is created at the same price levels, which also disappears, signaling the imbalance has been neutralized.
No text or labels are displayed, ensuring a clean visual experience focused solely on the boxes.
Intended UseTraders: This tool is ideal for traders using FVG and IFVG concepts (common in Smart Money or ICT trading strategies) to identify potential support and resistance zones. The blue boxes (Bullish IFVGs) may indicate areas to buy or expect a bounce, while orange boxes (Bearish IFVGs) may indicate areas to sell or expect a pullback.
Chart Analysis: By observing when and where boxes appear and disappear, traders can track market structure shifts without cluttering the chart with annotations.
LimitationsThe script must be applied to a 5-minute chart manually, as the timeframe argument is not supported due to the use of drawing functions.
The brief appearance of IFVG boxes means historical levels must be tracked manually (e.g., via screenshots) or by adjusting the script to retain them if desired.
The minimum gap size filter might need tuning depending on the instrument (e.g., Gold) to capture relevant gaps.
Current Status (as of 08:53 AM EDT, October 23, 2025)The script is fully functional on your 5-minute chart, with the latest version (v5) resolving the timeframe error by removing the invalid argument. Boxes should now appear and disappear as intended, with green for Bullish FVGs, red for Bearish FVGs, blue for Bullish IFVGs, and orange for Bearish IFVGs.

Alerts Killzones + PD/WL/ML Levels (No Labels)This indicator automatically highlights the London and New York killzones and triggers alerts at key price levels — without adding any labels or text clutter to the chart.
Features:
Highlights London (10:00–13:00) and New York (15:00–17:00) sessions (GMT+3, Romania).
Draws and updates key levels automatically:
PDH / PDL – Previous Day High & Low
WH / WL – Previous Week High & Low
MH / ML – Previous Month High & Low
Alerts when price touches any of these levels.
Alerts at session opens and closes for both London and New York.
Clean interface – no labels or extra markers on chart.
Ideal for:
Traders who follow ICT concepts, session-based setups, or liquidity sweeps and want precise alerts without chart noise.
