Premium/Discount Zones with Confirmation Signals📌 Indicator Description: Premium/Discount Zones with Confirmed Signals
This indicator identifies dynamic Premium, Discount, and Equilibrium zones based on recent swing highs and lows, helping traders visualize where price is considered expensive, cheap, or fair value. It’s designed for Smart Money Concepts (SMC), ICT-style trading, and anyone who values precision in zone-based analysis.
🔍 Key Features
Swing-Based Zones: Automatically detects swing highs/lows over a customizable lookback period (default: 48 bars — equivalent to 2 days on a 1-hour chart).
Premium & Discount Levels: Define overbought and oversold zones using percentage inputs (default: 25%).
Equilibrium Band (middle): Highlights the no-trade value zone with adjustable width (default: 5%).
Signal Engine: Generates trade signals based on two styles:
Bounce: Reversal signals when price reacts to a zone and confirms direction.
Breakout: Continuation signals when price breaks through a zone with momentum.
Trade Type Selector: Choose between Bounce, Breakout, or Both from the input menu.
Signal Filtering: Limits signals to one per direction at a time to reduce noise.
Visual Styling: Toggle between colored or monochrome themes for clean charting.
🧠 How It Works
Buy signals appear when price confirms strength from the discount zone or breaks above the premium zone.
Sell signals appear when price confirms weakness from the premium zone or breaks below the discount zone.
All signals include a built-in 3-bar confirmation delay to reduce false triggers.
🎯 Ideal For
Traders using SMC, ICT, or price action strategies
Zone-based scalping, swing trading, or intraday setups
Visualizing market structure and value areas with clarity
I hope you find this useful — and wish you Happy Trades!
"ict" için komut dosyalarını ara

量价策略信号+K线pinbar+波动率出场+市场结构【梦喂马】v3Part 1: Indicator Module Explained (Code Analysis and Function Description)
Module 1: Master Switches
This is your "dashboard master control." Due to the numerous indicator functions, charts can appear cluttered. Here, you can easily turn each major function module on or off, allowing you to focus on the information you need most.
- Suggested Usage: When using it for the first time, you can start by only turning on the Vegas Channel and Core Entry Signals to familiarize yourself with the system's main trend judgment and entry logic. Then gradually turn on other modules to experience how they work together.
Module 2: Core Entry Signals (Long/Short Signals)
This is the "engine" of the entire system, responsible for generating the highest quality trend-following trading signals. The appearance of a "long" or "short" signal represents the resonance of multiple indicators, satisfying extremely stringent filtering conditions:
- 1. Vegas Channel Filtering:
- When going long, the price must be above the slow channel (576/676 EMA) and the fast channel (21/55 EMA).
- When shorting, the price must break below both the slow and fast channels.
- Interpretation: This ensures your trading direction is perfectly aligned with the medium- to long-term macro trend.
- 2. Alligator Line Confirmation:
- When going long, the price must be above the alligator lines (lips, teeth, jaws), and the alligator lines must be in a bullish alignment (opening upwards).
- When shorting, the opposite applies.
- Interpretation: This confirms that short-term momentum aligns with the long-term trend, avoiding hasty entry at the start or end of a trend.
- 3. OBV (On-Balance Volume) Filter:
- When going long, the OBV value must be above its own moving average (default 34 periods).
- When shorting, the OBV value must be below its moving average.
- Interpretation: OBV is a key indicator measuring fund inflows and outflows. This condition ensures that trading volume (funds) is supporting your trading direction.
- 4. ADX Trend Strength Filter:
- Whether going long or short, the ADX value must be greater than the set threshold (default 20).
- Interpretation: This is a crucial "insurance" layer. It helps filter out volatile market conditions with no clear direction, prone to repeated "misjudgments." We only act in markets with clear and strong trends.
Core Usage: Once a "long"/"short" signal appears, it represents a high-certainty trend-following trading opportunity. Due to the very strict nature of the signals, they appear infrequently, but each one deserves your close attention.
Module Three: Vegas Channel & Alligator Line (Trend Judgment Tool)
- Vegas Channel: Composed of two sets of EMAs.
- Slow Channel (576/676): Your "bull/bear dividing line." Above this line, only consider going long; below this line, only consider going short. It is your strategic compass.
- Fast Channel (21/55): Your "short-term momentum line." In an uptrend, price pullbacks to the vicinity of the fast channel are potential areas for adding to positions or entering.
- Alligator Line:
- Widening divergence: Indicates that a trend is underway.
- Convergence/Entanglement: Indicates the market is dormant or consolidating.
- Interpretation: Alligator lines allow you to visually see whether the market is in a "trending" or "consolidating" state. We primarily trade when the alligator lines widen.
Module Four: R/C Volume-Price Signals (Refined Entry/Warning Signals)
This is the system's "special forces," specifically designed to identify abnormal volume and price movements on key candlesticks. It is divided into the R series (Reversal) and the C series (Continuation).
- Prerequisites: All signals are based on trading volume. A signal's appearance must be accompanied by a significantly higher-than-average trading volume (increased volume). This indicates large capital participation at that price level, making the signal more reliable.
- R Series - Trend Reversal Signals (Warning/Opportunity):
- R1 (Core Reversal): In a downtrend, a sudden increase in volume on a bullish candlestick; or in an uptrend, an increase in volume on a bearish candlestick.
- Interpretation: This is the most basic reversal warning signal. It tells you that counter-trend forces are emerging, but it doesn't mean the trend will immediately reverse. Confirmation needs to be combined with other signals.
- R2 (Pattern Confirmation): In addition to R1, this candlestick must also be a well-defined Pin Bar (a bullish Pin Bar with a long lower shadow, or a bearish Pin Bar with a long upper shadow).
- Interpretation: This is a more reliable reversal signal. The Pin Bar pattern represents a strong rejection of the price after an attempt to break through; combined with increased volume, this indicates strong reversal momentum.
- R3 (Top Momentum): In addition to R2, the trading volume reaches a "massive" level (default is more than 4 times the average volume).
- Interpretation: This is the highest level reversal signal. It usually appears at the end of a trend, representing the extreme struggle and conversion of bullish and bearish forces, and is a potential sign of a "V-shaped reversal" or a deep V-bottom/top.
- C Series - Trend Continuation/Termination Signals:
- C0 (Trend Continuation): In a clear uptrend, a bearish Pin Bar (long upper shadow) with increased volume appears during a price pullback; or in a downtrend, a bullish Pin Bar (long lower shadow) with increased volume appears during a rebound.
- Interpretation: This is a classic "buy on pullback/sell on rebound" signal. It indicates that the pullback/rebound attempt to counterattack is quickly suppressed by the strong main trend, making it an excellent entry point for adding to positions or following the trend.
- CX (Exhaustion Signal): A C-series signal that appears when the price has moved far away from the slow Vegas Channel (default more than 5 times the ATR distance).
- Interpretation: This is an advanced use of the C-series. After a trend has run for a long time, market sentiment may be overly enthusiastic. The high-volume PinBar appearing at this time, while trend-following in form, is more likely to represent the exhaustion or "final frenzy" of the trend. This is an alert that the trend may be running out of momentum, and you should consider taking profits in batches rather than adding to your position.
Signal Priority: This indicator has been internally optimized: CX/R3 > R2 > C0 > R1. Higher-level signals will override lower-level signals, ensuring you see the most important information at the moment.
Module 5: Chandelier Exit - Dynamic Risk Management
This is a dynamic stop-loss system based on ATR (Average True Range).
- How it works:
- In an uptrend, it subtracts N times the ATR from the recent high, forming a stepped upward stop-loss line.
- In a downtrend, it adds N times the ATR from the recent low, forming a stepped downward stop-loss line.
- Core advantages: It automatically adjusts the stop-loss distance based on market volatility. During periods of high market volatility, the stop-loss widens, giving you more room; during periods of market stability, the stop-loss tightens, locking in profits more quickly.
- Usage:
- As an initial stop-loss: After entering a position, the stop-loss can be set outside the Chandelier line.
- As a trailing stop: The position is held as long as the price does not fall below (uptrend) or rise above (downtrend) the Chandelier line. This is a powerful tool for "letting profits run."
- As an auxiliary trend indicator: The direction of the chandelier line (upward/downward) also provides a concise short-term trend perspective.
Module Six: Candlestick Coloring
This feature is very intuitive; it colors candlesticks based on volume:
- High Volume (Orange): Volume exceeds twice the average volume.
- Huge Volume (Red): Volume exceeds four times the average volume.
- Usage: Helps you identify key candlesticks indicating significant market events at a glance, typically the start, acceleration, reversal, or exhaustion points of a trend.
Module Seven: ICT Market Structure
This is an advanced price behavior analysis tool based on ICT (Inner Circle Trader) theory, helping you understand the market's "skeleton."
- Core Concepts:
- Swing High/Low: Local tops and bottoms in market prices.
- BOS (Break of Structure): In an uptrend, the price creates a higher high than the previous swing high; in a downtrend, it creates a lower low.
- Interpretation: BOS (Bullish Oscillator) is a confirmation signal of trend continuation. Consecutive upward BOS indicate a healthy bullish trend, and vice versa.
- MSS (Market Structure Shift, also often called CHOCH): In an uptrend, the price fails to make a new high and instead falls below the previous valid swing low.
- Interpretation: MSS is the first and most important signal of a potential trend reversal. It indicates that market forces are shifting from bullish to bearish (or vice versa).
- Period Settings (Short/Intermediate/Long Term):
- Short Term: Based on the most minute 3-bar swing points, very sensitive, suitable for short-term traders to observe subtle changes.
- Intermediate Term (Recommended): Based on higher-level swing points formed from short-term swing points, filtering out some noise, suitable for day and swing traders.
- Long Term: Based on swing points formed from intermediate-term swing points, reflecting a longer-term structure, suitable for swing and long-term traders.
- Usage: Combine market structure with your trading signals. For example, in an uptrend (price above the Vegas Channel), each upward BOS confirms the health of the trend. If a C0 pullback signal appears at this point, it would be an excellent entry point. Conversely, if an MSS appears, even with a strong buy signal, caution is advised, as the trend may be reversing.
Module Eight: Information Panel
This is your "cockpit dashboard," consolidating all key information in one place, giving you a clear overview of the current market state:
- Main Trend Direction: The final trend judgment given by multiple indicators.
- Alligator Line Pattern: Shows whether the current trend is trending or consolidating.
- OBV Status: Whether funds are flowing in or out.
- ADX Status: Whether the trend is strong or weak.
- Chandelier Stop-Loss Direction: Short-term trend direction.

FVG MagicFVG Magic — Fair Value Gaps with Smart Mitigation, Inversion & Auto-Clean-up
FVG Magic finds every tradable Fair Value Gap (FVG), shows who powered it, and then manages each gap intelligently as price interacts with it—so your chart stays actionable and clean.
Attribution
This tool is inspired by the idea popularized in “Volumatic Fair Value Gaps ” by BigBeluga (licensed CC BY-NC-SA 4.0). Credit to BigBeluga for advancing FVG visualization in the community.
Important: This is a from-scratch implementation—no code was copied from the original. I expanded the concept substantially with a different detection stack, a gap state machine (ACTIVE → 50% SQ → MITIGATED → INVERSED), auto-clean up rules, lookback/nearest-per-side pruning, zoom-proof volume meters, and timeframe auto-tuning for 15m/H1/H4.
What makes this version more accurate
Full-coverage detection (no “missed” gaps)
Default ICT-minimal rule (Bullish: low > high , Bearish: high < low ) catches all valid 3-candle FVGs.
Optional Strict filter (stricter structure checks) for traders who prefer only “clean” gaps.
Optional size percentile filter—off by default so nothing is hidden unless you choose to filter.
Correct handling of confirmations (wick vs close)
Mitigation Source is user-selectable: high/low (wick-based) or close (strict).
This avoids false “misses” when you expect wick confirmations (50% or full fill) but your logic required closes.
State-aware labelling to prevent misleading data
The Bull%/Bear% meter is shown only while a gap is ACTIVE.
As soon as a gap is 50% SQ, MITIGATED, or INVERSED, the meter is hidden and replaced with a clear tag—so you never read stale participation stats.
Robust zoom behaviour
The meter uses a fixed bar-width (not pixels), so it stays proportional and readable at any zoom level.
Deterministic lifecycle (no stale boxes)
Remove on 50% SQ (instant or delayed).
Inversion window after first entry: if price enters but doesn’t invert within N bars, the box auto-removes once fully filled.
Inversion clean up: after a confirmed flip, keep for N bars (context) then delete (or 0 = immediate).
Result: charts auto-maintain themselves and never “lie” about relevance.
Clarity near current price
Nearest-per-side (keep N closest bullish & bearish gaps by distance to the midpoint) focuses attention where it matters without altering detection accuracy.
Lookback (bars) ensures reproducible behaviour across accounts with different data history.
Timeframe-aware defaults
Sensible auto-tuning for 15m / H1 / H4 (right-extension length, meter width, inversion windows, clean up bars) to reduce setup friction and improve consistency.
What it does (under the hood)
Detects FVGs using ICT-minimal (default) or a stricter rule.
Samples volume from a 10× lower timeframe to split participation into Bull % / Bear % (sum = 100%).
Manages each gap through a state machine:
ACTIVE → 50% SQ (midline) → MITIGATED (full) → INVERSED (SR flip after fill).
Auto-clean up keeps only relevant levels, per your rules.
Dashboard (top-right) displays counts by side and the active state tags.
How to use it
First run (show everything)
Use Strict FVG Filter: OFF
Enable Size Filter (percentile): OFF
Mitigation Source: high/low (wick-based) or close (stricter), as you prefer.
Remove on 50% SQ: ON, Delay: 0
Read the context
While ACTIVE, use the Bull%/Bear% meter to gauge demand/supply behind the impulse that created the gap.
Confluence with your HTF structure, sessions, VWAP, OB/FVG, RSI/MACD, etc.
Trade interactions
50% SQ: often the highest-quality interaction; if removal is ON, the box clears = “job done.”
Full mitigation then rejection through the other side → tag changes to INVERSED (acts like SR). Keep for N bars, then auto-remove.
Keep the chart tidy (optional)
If too busy, enable Size Filter or set Nearest per side to 2–4.
Use Lookback (bars) to make behaviour consistent across symbols and histories.
Inputs (key ones)
Use Strict FVG Filter: OFF(default)/ON
Enable Size Filter (percentile): OFF(default)/ON + threshold
Mitigation Source: high/low or close
Remove on 50% SQ + Delay
Inversion window after entry (bars)
Remove inversed after (bars)
Lookback (bars), Nearest per side (N)
Right Extension Bars, Max FVGs, Meter width (bars)
Colours: Bullish, Bearish, Inversed fill
Suggested defaults (per TF)
15m: Extension 50, Max 12, Inversion window 8, Clean up 8, Meter width 20
H1: Extension 25, Max 10, Inversion window 6, Clean up 6, Meter width 15
H4: Extension 15, Max 8, Inversion window 5, Clean up 5, Meter width 10
Notes & edge cases
If a wick hits 50% or the far edge but state doesn’t change, you’re likely on close mode—switch to high/low for wick-based behaviour.
If a gap disappears, it likely met a clean up condition (50% removal, inversion window, inversion clean up, nearest-per-side, lookback, or max-cap).
Meters are hidden after ACTIVE to avoid stale percentages.

Idan Moskoבאי/סאייל - עידן מוסקו
אלגוריתם חכם לאיתותי BUY/SELL בלבד על הגרף ✅❌
משלב: ICT (BOS/CHOCH, Order Blocks, Liquidity), FVG/IFVG, Premium/Discount, EMA/MCB, תבניות נרות, וסינון תנודתיות.
איך זה עובד?
➡️ מזהה שבירת מבנה + דחיפה (Displacement)
➡️ בודק אזורי נזילות/OB + מיקום PD (Premium/Discount)
➡️ מאשר עם EMA/MCB/תבניות → מציג BUY או SELL בלבד
טיפים:
לטיימפריים מהירים → Profile: Aggressive
עובד על: 1m / 5m / 15m / 30m / 1H / 4H / 1D
התראות:
🔔 יש התראות מוכנות: “BUY v3” / “SELL v3”
הערה: אין ייעוץ השקעות. מומלץ לאשר עם ניהול סיכונים (SL/TP) 📉📈
Idan Mosko – BUY/SELL
Smart BUY/SELL only ✅❌ using ICT (BOS/CHOCH, OB, Liquidity) + FVG/IFVG, PD, EMA/MCB, and candle patterns.
Modes:
Close-confirmed ✔️ safer
Realtime ⚡ earlier entries
Tips:
Aggressive → more signals • Conservative → cleaner signals.
Works on 1m–1D. Alerts: “BUY v3” / “SELL v3”.
Not financial advice; use proper risk management.

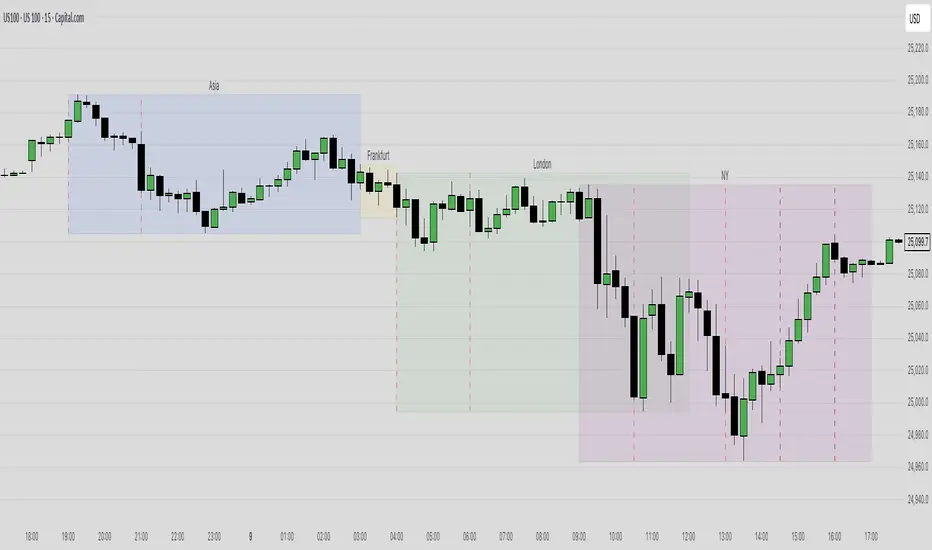
CPT - CRT Sessions🧭 CPT - CRT Sessions V3
Automated Killzones, CRT Ranges, FVGs, and Market Structure Anchors — built for precision intraday analysis.
🔹 Overview
CPT - CRT Sessions V3 is an advanced all-in-one price action indicator designed to simplify your intraday charting and speed up trade preparation.
It automatically plots key session killzones, Central Range Times (CRT), Fair Value Gaps (FVGs), and market structure anchors such as NDOG, NWOG, and PDH/PDL, allowing traders to identify premium and discount zones at a glance.
⚙️ Core Features
🕒 CRT Ranges (Central Range Time)
Automatically plots 1HR CRT (for futures) and 4HR CRT (for forex) sessions.
Includes color-coded high/low lines for instant visual reference.
Configurable hours (UTC-4 default) and adjustable forward projection.
📦 Killzones
Automatically draws Asian, London, and New York (AM, Lunch, PM) session boxes.
Each killzone features:
Adjustable start/end times
Independent color and transparency controls
Session labeling inside boxes
Uses the classic ICT-style session structure (Asia: 20:00–23:59 UTC-4 by default).
⚡ Fair Value Gaps (FVGs)
Detects both bullish and bearish FVGs automatically.
Displays each gap with:
Midpoint line
Label inside the box (e.g., “1HR FVG”, “4HR FVG”)
Auto-remove logic once price mitigates the gap.
Works on all timeframes.
🔰 Market Anchors
PDH / PDL — Previous Day High & Low
NDOG / NWOG — New Day & New Week Opening Gaps
Automatically drawn and color-coded for visual clarity.
🎨 Customization
Adjustable line styles, widths, and label sizes
Individual transparency sliders for each session box
Optional 24-hour display filtering
Fully timezone-aware (default: UTC-4, matching Exchange time)
💡 Ideal For
Traders following ICT, Smart Money Concepts, or Session Liquidity Models
Scalpers and intraday traders looking to automate manual markups
Multi-timeframe confluence mapping (FVGs + Killzones + CRTs)
🧠 Notes
This tool is for chart analysis only — not an entry or exit signal.
Always perform your own confluence checks before trading.

NWOG/NDOG + EHPDA🌐 ENGLISH DESCRIPTION
Hybrid NWOG/NDOG + EHPDA – Advanced Gaps & Event Horizon Indicator
(Enhanced with Real-Time Alerts and Info Table)
📊 Overview
This advanced indicator combines automatic detection of weekly gaps (NWOG) and daily gaps (NDOG) with the Event Horizon (EHPDA) concept, now featuring customizable alerts and a real-time info table for a more efficient trading experience. Designed for traders who operate based on institutional price structures, liquidity zones, and SMC/ICT confluences.
✨ Key Features
1. Gap Detection & Visualization
NWOG (New Week Opening Gap): Identifies and visualizes the gap between Friday’s close and Monday’s open.
NDOG (New Day Opening Gap): Detects daily gaps on intraday timeframes.
Enhanced visualization: Semi-transparent boxes, price levels (top, middle, bottom), and lines extended to the current bar.
Customizable labels: Display gap formation date and price levels (optional).
2. Event Horizon (EHPDA)
Automatically calculates the Event Horizon level between two non-overlapping gaps.
Dashed line marking the equilibrium zone between bullish and bearish gaps.
3. Advanced 5pm-6pm Mode
Special option to detect the Sunday-Monday gap using 4H bars.
4. Real-Time Alerts
New gaps (NWOG/NDOG): Immediate notification when a new gap forms.
Gap fill: Alert when price completely fills a gap.
Event Horizon active: Notification when the Event Horizon level is triggered.
5. Info Table
Real-time display: number of active gaps, Event Horizon status, time remaining until weekly/daily close.
Customizable: position, size, and style.
🎨 Customization
Configurable colors for bullish gaps, bearish gaps, and Event Horizon line.
Customizable price labels and date format.
📈 Use Cases
Reversal trading, price targets, liquidity zones, SMC/ICT confluences.
⚙️ Recommended Settings
Timeframes: Daily and intraday (15m, 1H, 4H, etc.).
NWOG: Enable on all timeframes.
NDOG: Enable only on intraday.
Max Gaps: 3-5 for clean charts, 10-15 for historical analysis.
📝 Important Notes
Works best on 24/5 markets (Forex, Crypto).
Gaps automatically close when filled.
Event Horizon only appears with at least 2 non-overlapping gaps.

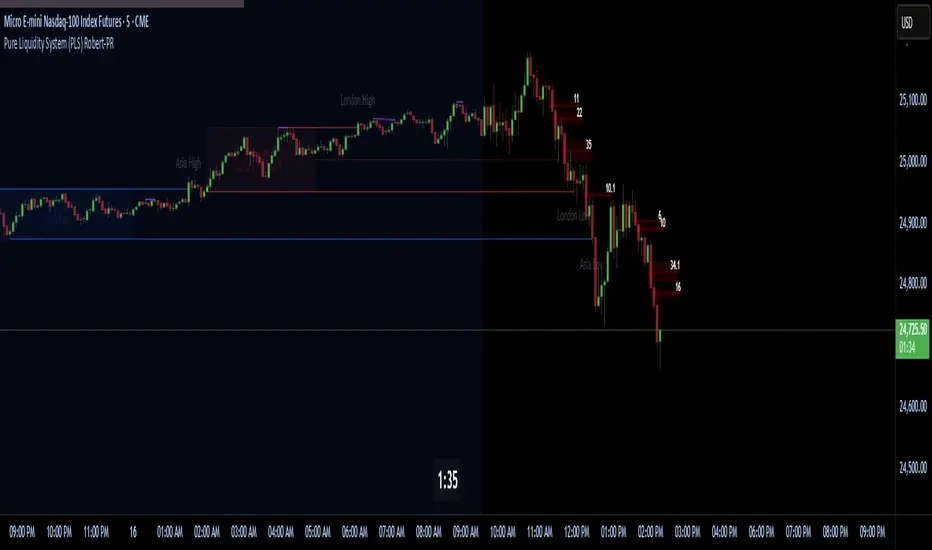
Pure Liquidity System (PLS) Robert-PRPure Liquidity System (PLS) Robert-PR
The PLS indicator is a comprehensive, advanced tool for tracking institutional liquidity across financial markets. It features:
Custom Day Ranges (6pm-6pm): Visualize daily ranges, midlines, and previous high/low levels with customizable tags and horizontal rays, helping you identify key price zones efficiently.
ICT Killzones: Automatically plots Asia, London, and New York (AM, Lunch, PM) sessions, highlighting peak volatility hours. Session pivots, labels, and middle lines offer fast context for intraday strategies.
Equal Highs/Lows Detection: Instantly marks significant equal highs and lows (double tops/bottoms) on any timeframe, making it easy to track liquidity pools and potential reversal points.
Fair Value Gaps (FVGs): Accurately detects and labels bullish/bearish fair value gaps, including gap size, mitigation status, and an optional consequent encroachment line for further analysis.
New York Session Markers: Quickly adds vertical lines for two critical NY session times (9:30 and 11:00 ET), perfect for time-based setups and correlation analysis.
Interactive Checklist & Timer: An intuitive panel for creating and marking off trading routines, complemented by a candle-close countdown timer to keep you focused and disciplined.
All core features are fully adjustable via the quick-access panel—enable or disable boxes, lines, labels, and levels with one click to match your workflow and visual preferences.
Perfect for traders who want to:
Trade alongside institutional “smart money” by focusing on liquidity zones, ICT concepts, and supply & demand mechanics.
Automatically streamline chart analysis while maintaining maximum flexibility, precision, and control over their trading environment.
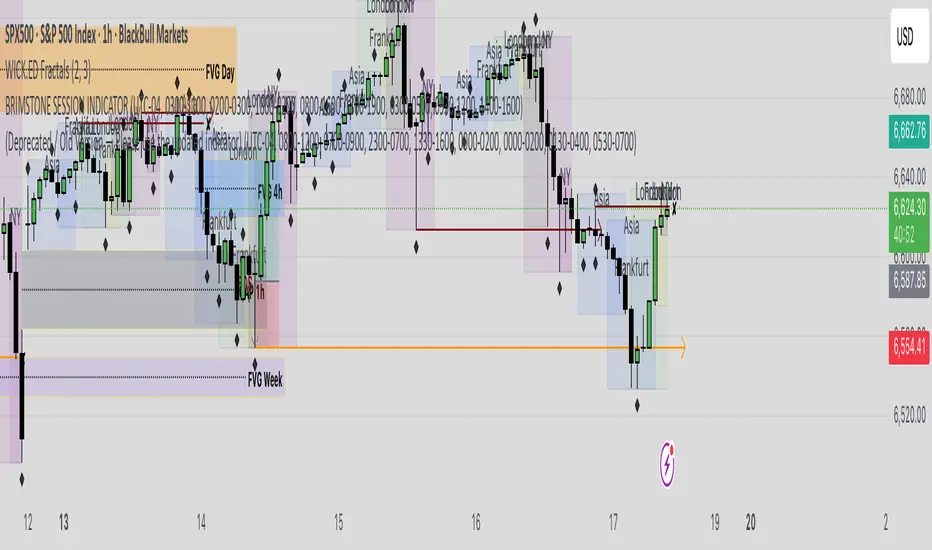
BRIMSTONE SESSION INDICATOR🧭 Brimstone Session Indicator
Brimstone Session Indicator highlights global trading sessions (Asia, London/Frankfurt, New York) and key Kill Zones, showing when real liquidity and volatility enter the market.
⸻
🔍 Why It’s Useful
Markets move in time cycles, not just price.
This tool makes institutional timing visible — so you instantly see:
• Session ranges & volatility shifts
• Liquidity grabs and reversals in Kill Zones
• Perfect timing for precision entries (ICT / SMC style)
⸻
⚔️ Kill Zones
Fully customizable timing windows for liquidity hunts, stop raids, and engineered moves — where the market is most likely to attack highs/lows.
⸻
🎯 Built For
• ICT / Smart Money Traders
• Intraday scalpers & bias traders
• Anyone who trades price + time, not price alone
iFVG Ultimate+ | DodgysDDOVERVIEW
iFVG Ultimate+ | DodgysDD is a professional-grade visualization framework that automates the identification and management of Inversion Fair Value Gaps (IFVGs)
It is designed for analysts and educators studying institutional price behavior, liquidity dynamics, and displacement-based imbalances.
This indicator does not provide trading signals or forecasts.
All logic serves educational and analytical purposes only.
A Fair Value Gap (FVG) appears when strong directional displacement prevents candle bodies from overlapping.When a liquidity sweep occurs and price later closes through that gap, the imbalance is considered inverted. This often marks a shift in order-flow.
iFVG Ultimate+ tracks these transitions using a rule-based sequence:
Liquidity Sweep – Price sweeps a previous swing high or low.
Displacement – Body-to-body gap forms as price accelerates away.
Inversion – Full candle body closes through the gap after raid.
Validation and Tracking – Confirmed inversions are stored and managed until completion or invalidation.
-----------------------------------------------------------------------------------------------
PURPOSE AND SCOPE
-----------------------------------------------------------------------------------------------
The framework serves as a research tool to document and analyze IFVG behavior within liquidity and session contexts.
It is commonly used to:
-Record and journal IFVG formations for back-testing and model study.
-Assess how often gaps complete or invalidate after sweeps.
-Evaluate session-based patterns (London, Asia, New York).
-Overlay HTF PD Arrays to observe inter-timeframe delivery.
-Receive custom alerts to your phone
-----------------------------------------------------------------------------------------------
LOGIC STRUCTURE
-----------------------------------------------------------------------------------------------
iFVG Ultimate+ runs a five-stage validation process to ensure sequential, non-repainting behavior.
Liquidity Framework:
• Detects swing highs and lows on aligned timeframes (automatic or manual selection).
• Logs session highs/lows for Asia (20:00–00:00 NY) and London (02:00–05:00 NY).
• Includes data wicks around 08:30 NY for event reference.
FVG Detection and Displacement Filter:
• Identifies body-based imbalances using ATR-scaled sensitivity modes (Sensitive / Normal / Strict).
• Supports “Single” or “Series” modes to merge adjacent gaps.
• Excludes weak displacements using minimum ATR thresholds.
Inversion Validation:
• Confirms only when a complete candle body closes through a qualifying FVG within a user-defined window (6 or 15 bars).
• Duplicate detections are ignored; mitigation states are recorded.
HTF Context Integration:
• Maps higher-time-frame PD Arrays and tracks their delivery status.
• Labels active zones (e.g. “H4 PDA”) and updates on HTF close.
Model Lifecycle and Limits:
• Plots the inversion line and derives educational limit levels: Break-Even and Stop-Loss.
• Tracks until opposing liquidity is swept (model complete) or an invalidation event occurs.
-----------------------------------------------------------------------------------------------
COMPONENTS AND VISUALS
-----------------------------------------------------------------------------------------------
-IFVG Line — Marks confirmed inversion at close.
-Break-Even / Stop-Loss Lines — Calculated retrospectively for journal grading.
-Session High/Low Markers — London and Asia reference levels.
-Data Wicks — 8:30 NY “DATA.H/L” labels for event volatility.
-SMTs — Compares current symbol to correlated instrument for divergence confirmation.
-Checklist Panel — Tracks liquidity, momentum, HTF delivery, and SMT conditions.
-Setup Grade Display — Computes qualitative score (A+ to C) based on met conditions.
-----------------------------------------------------------------------------------------------
INPUT CATEGORIES
-----------------------------------------------------------------------------------------------
General — Detection mode, ATR strictness, bias filter, long/short window.
Liquidity — Automatic or manual timeframe alignment, session visuals.
FVG — Color themes, label sizes, inversion color change, HTF inclusion.
Entry / Limits — Enable or hide Entry, Break-Even, and Stop-Loss levels.
Alerts — Individual toggles for IFVG formation, session sweeps, multi-TF inversions, and invalidations.
Display — Info Box, relationship table, and grade styling.
All alerts output plain text messages only and do not execute orders.
-----------------------------------------------------------------------------------------------
ALERT FRAMEWORK
-----------------------------------------------------------------------------------------------
When enabled, alerts may notify for:
-Potential inversion detected.
-Confirmed IFVG formation.
-Liquidity sweeps (high/low or session).
-Multi-time-frame inversion.
-Invalidation or close warning.
-Alerts serve as educational markers only, not trade triggers.
The user will have the ability to create custom messages for each of these alert events.
-----------------------------------------------------------------------------------------------
USAGE GUIDELINES
-----------------------------------------------------------------------------------------------
iFVG Ultimate+ is suited for review and documentation of displacement-based price behavior.
Recommended educational workflows:
-Annotate IFVG events and review delivery into PD Arrays.
-Analyze frequency by session or timeframe.
-Assess how often IFVGs complete versus invalidate.
-Teach ICT-style liquidity mechanics in mentorship or training contexts.
-The indicator works across forex, futures, and crypto markets.
-----------------------------------------------------------------------------------------------
OPERATIONAL NOTES AND LIMITATIONS
-----------------------------------------------------------------------------------------------
-HTF calculations finalize on bar close (no look-ahead).
-ATR filter strength affects small-gap visibility.
-Session windows use New York time.
-Break-Even and Stop-Loss lines are visual aids only.
-Performance depends on chart density and bar count.
-No strategy module or backtest engine is included.
-----------------------------------------------------------------------------------------------
ORIGINALITY AND PROTECTION
-----------------------------------------------------------------------------------------------
iFVG Ultimate+ | DodgysDD integrates multiple independent systems into a single engine:
-PD Array context alignment with liquidity tracking.
-Dynamic session detection and macro data integration.
-Sequential IFVG validation pipeline with grade assignment.
-Multi-time-frame SMT confirmation module.
-Structured alerts and mitigation tracking.
The logic is entirely original, written in Pine v6, and protected as invite-only to preserve methodology integrity.
-----------------------------------------------------------------------------------------------
ATTRIBUTION
-----------------------------------------------------------------------------------------------
Core concepts such as Fair Value Gaps, Liquidity Sweeps, PD Arrays, and SMT Divergence are publicly taught within ICT-style market education. This implementation was designed and engineered by TakingProphets as iFVG Ultimate+ | DodgysDD, authored for TradingView publication by TakingProphets.
-----------------------------------------------------------------------------------------------
TERMS AND DISCLAIMER
-----------------------------------------------------------------------------------------------
This indicator is for educational and informational use only. It does not provide financial advice or predictive output. Historical patterns do not guarantee future results. All users remain responsible for their own decisions.Use of this script implies agreement with TradingView’s Vendor Requirements and Terms of Use.
-----------------------------------------------------------------------------------------------
ACCESS INSTRUCTIONS
-----------------------------------------------------------------------------------------------
Access is managed through TradingView’s invite-only framework. Users request access via private message to TakingProphets or access link

Structure Pro+ 2.4 Structure Pro+ 2.4
Summary
Structure Pro+ 2.4 is a comprehensive, all-in-one indicator designed for traders who utilize Smart Money Concepts (SMC). It automates the detection of key market structure events, identifies high-probability trade signals, and incorporates time-based filters to focus on the most volatile trading sessions, helping you make informed decisions with precision and clarity.
This suite goes beyond simple lines on a chart by integrating Market Structure, Fair Value Gaps (FVGs), and institutional trading sessions into a single, powerful tool.
Core Features
📈 Automatic Market Structure
Break of Structure (BOS) & Change of Character (CHoCH): The indicator automatically identifies and labels significant breaks in market structure, allowing you to instantly recognize trend continuations (BOS) or potential reversals (CHoCH).
Customizable Pivot Detection: Fine-tune the sensitivity of the structure detection by adjusting the Left Bars and Right Bars settings to match your trading style and timeframe, from scalping to swing trading.
🎯 High-Probability Breakout Signals
Receive clear BUY and SELL signals based on a powerful confluence of events. A signal only appears when:
A BOS or CHoCH is confirmed.
The breakout move is validated by the creation of a recent Fair Value Gap (FVG), indicating strong momentum.
The signal occurs within a valid, high-volatility time session.
The breakout is confirmed on a closed candle to prevent fakeouts.
🔍 Key Liquidity & Imbalance Zones
Fair Value Gaps (FVGs): Automatically detects and displays FVG (Imbalance) zones on your chart, highlighting key areas of interest where the price may return.
Order Blocks (OBs): Optionally display the last order block before a structural break. The length of the OB box can be customized to keep your chart clean.
🕒 Time-Based Session Filters (Killzones)
Timing is everything. Structure Pro+ 2.4 provides fully customizable time filters to ensure you are only trading in optimal market conditions.
ICT Macro Sessions: Enable and customize standard ICT Macro "Killzone" sessions, which are displayed visually on your chart.
NASDAQ Open Session: A dedicated, customizable session filter for the high-volatility NASDAQ open.
Timezone Synchronization: Set your preferred timezone (America/New_York by default) to align all sessions perfectly, no matter where you are in the world.
⚙️ Full Customization & Alerts
Visuals: Take complete control over the look and feel of the indicator, including colors, line styles, and label sizes.
Alert System: A comprehensive alert system allows you to get notified for every key event:
Signal (BUY/SELL)
BOS or CHoCH
BOS/CHoCH with FVG Confluence
Start of a Macro Session
How to Use
Identify the Trend: Use the automatically plotted BOS and CHoCH labels to determine the current market bias on your chosen timeframe. An uptrend is defined by a series of bullish BOS, while a downtrend is defined by bearish BOS. A CHoCH signals a potential shift in this bias.
Wait for a Signal in a Valid Session: Be patient and wait for a BUY or SELL signal to appear on your chart. Ensure the signal occurs within one of the active, visually-drawn time sessions (Macros or NASDAQ Open) for the highest probability.
Confirm and Manage Risk: Use the signal as a primary point of confluence in your trading plan. For best results, combine it with your own analysis. Always practice proper risk management by setting a stop loss, typically below the low of the swing that caused a BUY signal or above the high of the swing that caused a SELL signal.
Disclaimer: This indicator is a tool designed to assist in trade analysis and should not be considered as financial advice. Trading involves substantial risk, and past performance is not indicative of future results. Always conduct your own research and risk assessment before entering any trade.

TLM HTF CandlesTLM HTF Candles
Higher timeframe candles displayed on your current chart, optimized for The Lab Model (TLM) trading methodology.
What It Does
Plots up to 6 HTF candles side-by-side on the right of your chart with automatic swing detection, expansion bias coloring, and a quick-reference info table. Watch multiple timeframes at once without switching charts.
Swing Detection - Solid lines for confirmed swings, dashed for potential swings. Detects when HTF levels get swept and rejected.
Expansion Bias - Candles colored green (bullish), red (bearish), or orange (conflicted) based on 3-candle patterns showing expected price expansion.
HTF Info Table - Compact dashboard showing time to close, active swings, and expansion direction for all timeframes. Toggle dark/light mode.
Equilibrium Lines - 50% midpoint from previous candle to current, great for mean reversion targets.
Based on "ICT HTF Candles" by @fadizeidan -
Heavily customized with swing analysis, expansion patterns, and info table for TLM trading concepts.

Smarter Money Concepts Dashboard [PhenLabs]📊Smarter Money Concepts Dashboard
Version: PineScript™v6
📌Description
The Smarter Money Concepts Dashboard is a comprehensive institutional trading analysis tool that combines six of our most powerful smarter money concepts indicators into one unified suite. This advanced system automatically detects and visualizes Fair Value Gaps, Inverted FVGs, Order Blocks, Wyckoff Springs/Upthrusts, Wick Rejection patterns, and ICT Market Structure analysis.
Built for serious traders who need institutional-grade market analysis, this dashboard eliminates subjective interpretation by automatically identifying where smart money is likely positioned. The integrated real-time dashboard provides instant status updates on all active patterns, making it easy to monitor market conditions at a glance.
🚀Points of Innovation
● Multi-Module Integration: Six different SMC concepts unified in one comprehensive system
● Real-Time Dashboard Display: Live tracking of all active patterns with customizable positioning
● Advanced Volume Filtering: Institutional volume confirmation across all pattern types
● Automated Pattern Management: Smart memory system prevents chart clutter while maintaining relevant zones
● Probability-Based Wyckoff Detection: Mathematical probability calculations for spring/upthrust patterns
● Dual FVG System: Both standard and inverted Fair Value Gap detection with equilibrium analysis
🔧Core Components
● Fair Value Gap Engine: Detects standard FVGs with volume confirmation and equilibrium line analysis
● Inverted FVG Module: Advanced IFVG detection using RVI momentum filtering for inversion confirmation
● Order Block System: Institutional order block identification with customizable mitigation methods
● Wyckoff Pattern Recognition: Automated spring and upthrust detection with probability scoring
● Wick Rejection Analysis: High-probability reversal patterns based on wick-to-body ratios
● ICT Market Structure: Simplified institutional concepts with commitment tracking
🔥Key Features
● Comprehensive Pattern Detection: All major SMC concepts in one indicator with automatic identification
● Volume-Confirmed Signals: Multiple volume filters ensure only institutional-grade patterns are highlighted
● Interactive Dashboard: Real-time status display with active pattern counts and module status
● Smart Memory Management: Automatic cleanup of old patterns while preserving relevant market zones
● Full Alert System: Complete notification coverage for all pattern types and signal generations
● Customizable Display Options: Adjustable colors, transparency, and positioning for all visual elements
🎨Visualization
● Color-Coded Zones: Distinct color schemes for bullish/bearish patterns across all modules
● Dynamic Box Extensions: Automatically extending zones until mitigation or invalidation
● Equilibrium Lines: Fair Value Gap midpoint analysis with dotted line visualization
● Signal Markers: Clear spring/upthrust signals with directional arrows and probability indicators
● Dashboard Table: Professional-grade status panel with module activation and pattern counts
● Candle Coloring: Wick rejection highlighting with transparency-based visual emphasis
📖Usage Guidelines
Fair Value Gap Settings
● Days to Analyze: Default 15, Range 1-100 - Controls historical FVG detection period
● Volume Filter: Enables institutional volume confirmation for gap validity
● Min Volume Ratio: Default 1.5 - Minimum volume spike required for gap recognition
● Show Equilibrium Lines: Displays FVG midpoint analysis for precise entry targeting
Order Block Configuration
● Scan Range: Default 25 bars - Lookback period for structure break identification
● Volume Filter: Institutional volume confirmation for order block validation
● Mitigation Method: Wick or Close-based invalidation for different trading styles
● Min Volume Ratio: Default 1.5 - Volume threshold for significant order block formation
Wyckoff Analysis Parameters
● S/R Lookback: Default 20 - Support/resistance calculation period for spring/upthrust detection
● Volume Spike Multiplier: Default 1.5 - Required volume increase for pattern confirmation
● Probability Threshold: Default 0.7 - Minimum probability score for signal generation
● ATR Recovery Period: Default 5 - Price recovery calculation for pattern strength assessment
Market Structure Settings
● Auto-Detect Zones: Automatic identification of high-volume thin zones
● Proximity Threshold: Default 0.20% - Price proximity requirements for zone interaction
● Test Window: Default 20 bars - Time period for zone commitment calculation
Display Customization
● Dashboard Position: Four corner options for optimal chart layout
● Text Size: Scalable from Tiny to Large for different screen configurations
● Pattern Colors: Full customization of all bullish and bearish zone colors
✅Best Use Cases
● Swing Trading: Identify major institutional zones for multi-day position entries
● Day Trading: Precise intraday entries at Fair Value Gaps and Order Block boundaries
● Trend Analysis: Market structure confirmation for directional bias establishment
● Risk Management: Clear invalidation levels provided by all pattern boundaries
● Multi-Timeframe Analysis: Works across all timeframes from 1-minute to monthly charts
⚠️Limitations
● Market Condition Dependency: Performance varies between trending and ranging market environments
● Volume Data Requirements: Requires accurate volume data for optimal pattern confirmation
● Lagging Nature: Some patterns confirmed after initial price movement has begun
● Pattern Density: High-volatility markets may generate excessive pattern signals
● Educational Tool: Requires understanding of smart money concepts for effective application
💡What Makes This Unique
● Complete SMC Integration: First indicator to combine all major smart money concepts comprehensively
● Real-Time Dashboard: Instant visual feedback on all active institutional patterns
● Advanced Volume Analysis: Multi-layered volume confirmation across all detection modules
● Probability-Based Signals: Mathematical approach to Wyckoff pattern recognition accuracy
● Professional Memory Management: Sophisticated pattern cleanup without losing market relevance
🔬How It Works
1. Pattern Detection Phase:
● Multi-timeframe scanning for institutional footprints across all enabled modules
● Volume analysis integration confirms patterns meet institutional trading criteria
● Real-time pattern validation ensures only high-probability setups are displayed
2. Signal Generation Process:
● Automated zone creation with precise boundary definitions for each pattern type
● Dynamic extension system maintains relevance until mitigation or invalidation occurs
● Alert system activation provides immediate notification of new pattern formations
3. Dashboard Update Cycle:
● Live status monitoring tracks all active patterns and module states continuously
● Pattern count updates provide instant feedback on current market condition density
● Commitment tracking for market structure analysis shows institutional engagement levels
💡Note:
This indicator represents institutional trading concepts and should be used as part of a comprehensive trading strategy. Pattern recognition accuracy improves with understanding of smart money principles. Combine with proper risk management and multiple confirmation methods for optimal results.

NQ Bias — Fixed Session (6PM & Midnight Opens)📰 Script Summary — NQ Bias (Fixed Session)
📌 Purpose:
This Pine Script helps traders track bias shifts on Nasdaq futures (NQ) using ICT-style reference points like the 6PM open, Midnight open, and 4PM close.
⚙️ How It Works:
Plots session opens (6PM, Midnight) as bias reference lines.
Highlights when price is trading above or below the 4PM New York Close → tells you if the market is leaning bullish or bearish.
Uses background coloring (green/red) to visually show bias.
Lets you filter by specific trading dates for focused backtesting.
Designed with ICT principles → focus on daily opens, session shifts, and premium/discount logic.
📈 Trader Benefit:
Quickly see if NQ is in bullish or bearish context relative to key opens.
Simplifies daily bias framework into an easy chart overlay.
Helps align trades with the higher-probability side of the market.

TF ZONES VIPTF Zones is a session and higher-timeframe reference tool for intraday and swing traders (ICT / SMC concepts).
🔹 Features
Killzones (Sessions):
Automatically draws Asia, London, New York AM, New York Lunch, and New York PM ranges.
• Customizable box colors, transparency, and labels
• High/Low pivot lines with optional midpoints
• Alerts when pivots are broken
Day / Week / Month Levels:
• Daily / Weekly / Monthly Opens
• Daily / Weekly / Monthly Highs & Lows
• Alerts on High/Low breaks
Day-of-Week Zones:
Color-coded boxes for each weekday (Mon–Sun) to track daily ranges.
Previous Year High/Low:
Plots prior year’s H/L with labels (PY.H / PY.L).
🔧 Customization
Session drawing limits (max days stored)
Timezone selection (GMT offsets or New York)
Label size, text color, and line style
Box transparency and text display options
Optional alerts on key level breaks
📌 Use Case
Perfect for traders who want to:
Track session ranges (ICT Killzones)
Visualize intraday structure clearly
Use Daily / Weekly / Monthly opens and ranges as confluence
Monitor higher-timeframe and yearly reference levels

TF ZonesTF Zones is a session and higher-timeframe reference tool for intraday and swing traders (ICT / SMC concepts).
🔹 Features
Killzones (Sessions):
Automatically draws Asia, London, New York AM, New York Lunch, and New York PM ranges.
• Customizable box colors, transparency, and labels
• High/Low pivot lines with optional midpoints
• Alerts when pivots are broken
Day / Week / Month Levels:
• Daily / Weekly / Monthly Opens
• Daily / Weekly / Monthly Highs & Lows
• Alerts on High/Low breaks
Day-of-Week Zones:
Color-coded boxes for each weekday (Mon–Sun) to track daily ranges.
Previous Year High/Low:
Plots prior year’s H/L with labels (PY.H / PY.L).
🔧 Customization
Session drawing limits (max days stored)
Timezone selection (GMT offsets or New York)
Label size, text color, and line style
Box transparency and text display options
Optional alerts on key level breaks
📌 Use Case
Perfect for traders who want to:
Track session ranges (ICT Killzones)
Visualize intraday structure clearly
Use Daily / Weekly / Monthly opens and ranges as confluence
Monitor higher-timeframe and yearly reference levels

Trading Sessions (L3J) Trading Sessions Indicator (L3J)
Overview
This Pine Script indicator displays precise trading session boxes for the three major global trading sessions: Asia, London, and US (Cash). Unlike traditional session indicators that show continuous background colors, this script creates rectangular boxes that precisely delimit each session from start to finish.
Features
🌍 Global Timezone Support
- 39 timezone options covering all major financial centers
- Automatic daylight saving time adjustments for named timezones
- Universal compatibility with all TradingView charts
📦 Session Boxes
- Precise delimitation: Each session is contained within a rectangular box
- Dynamic sizing: Boxes automatically adjust to session high/low prices
- Visual distinction: Completed sessions (solid borders) vs ongoing sessions (dashed borders)
- Customizable borders: Toggle on/off with adjustable thickness (0-5px)
🎨 Visual Customization
- Individual session colors: Fully customizable for Asia, London, and US sessions
- Border matching: Border colors automatically match session box colors
- Transparency control: Built-in opacity settings for each session
- Clean interface: Minimal visual clutter with maximum information
⚙️ Management Options
- Box limit control: Set maximum number of historical boxes per session (1-50)
- Automatic cleanup: Old boxes are automatically removed to maintain performance
- Memory efficient: Optimized for long-term chart analysis
Default Session Times (EDT - Etc/GMT+4)
| Session | Default Hours | Markets Covered |
|---------|---------------|-----------------|
| Asia | 18:00 - 02:00 | Tokyo, Sydney, Hong Kong |
| London | 02:00 - 11:00 | London, Frankfurt, European markets |
| US Cash | 09:30 - 16:00 | NYSE, NASDAQ |
> Note: Default times are in EDT (Eastern Daylight Time). Adjust session hours according to your selected timezone.
Timezone Conversion Examples
For UTC Users:
- Asia: 22:00 - 06:00
- London: 06:00 - 15:00
- US: 13:30 - 20:00
For Europe/London Users:
- Asia: 23:00 - 07:00
- London: 07:00 - 16:00
- US: 14:30 - 21:00
Usage Instructions
1. Add to chart: Apply the indicator to any timeframe
2. Select timezone: Choose your local timezone from the dropdown
3. Adjust session hours: Modify session times if needed for your timezone
4. Customize appearance: Set colors, borders, and box limits
5. Enable/disable sessions: Toggle individual sessions on/off as needed
Technical Specifications
- Pine Script Version: v6
- Chart Type: Overlay indicator
- Maximum Objects: 150 boxes, 500 lines, 200 labels
- Performance: Optimized for real-time updates
- Compatibility: All TradingView chart types and timeframes
Integration with Other Scripts
This indicator is designed to work seamlessly with other L3J trading scripts:
- ICT Levels Indicators: Provides session context for key levels
- Market Structure Scripts: Session boxes help identify structural breaks
- Volume Profile Tools: Session delimitation for volume analysis
- Support/Resistance Scripts: Session-based level identification
> Recommended: Use this as a base layer with other L3J indicators for comprehensive market analysis.
Key Benefits
🎯 Precision Trading
- Exact session boundaries: No guesswork about session start/end times
- Clean visual reference: Clear session delimitation for strategy execution
- Multi-timeframe compatibility: Works on all chart timeframes
📊 Professional Analysis
- Institution-grade accuracy: Matches professional trading platforms
- Customizable for any strategy: Adaptable to various trading approaches
- Performance optimized: Minimal impact on chart loading times
🔄 Real-time Updates
- Live session tracking: Ongoing sessions update in real-time
- Automatic management: Old sessions are cleaned up automatically
- Memory efficient: Optimized for extended trading sessions
Author Information
Created by: L3J
Version: 1.0
Category: Session Analysis / Market Hours
License: For use with L3J trading script ecosystem
---
Support & Integration
This indicator is part of the L3J Trading Script Collection. For optimal results, combine with other L3J indicators:
- ICT Key Levels
- Market Structure Analysis
- Volume Profile Tools
- Support/Resistance Scripts
Note: This script is specifically designed to complement and enhance other L3J trading tools. Individual use is supported, but maximum effectiveness is achieved when used as part of the complete L3J trading system.
---
For technical support or integration questions, refer to the L3J script documentation or community resources.

HSM KILLZONE Basic v2This Killzones indicator was designed to simplify ICT-based execution by focusing only on the three main windows (Asia, London, and New York), removing clutter and unnecessary sessions from other versions, and providing full customization of times, colors, and visibility by timeframe.
The ICT Killzones indicator allows you to track the main trading windows: London, Asia, and New York.
You can use these windows as time-based liquidity zones, or wait for them as operational ranges to look for false breakouts and then apply your trading triggers.
Once added to your chart, the three zones will be automatically plotted for you.
Give priority to USD pairs during the New York Killzone.
Focus on EUR and GBP pairs during the London Killzone.
For the Asian Killzone, use pairs such as JPY, NZD, or AUD.
The indicator is fully customizable: you can modify the start and end times of each window, change colors according to your preference, and adjust visibility by timeframe.

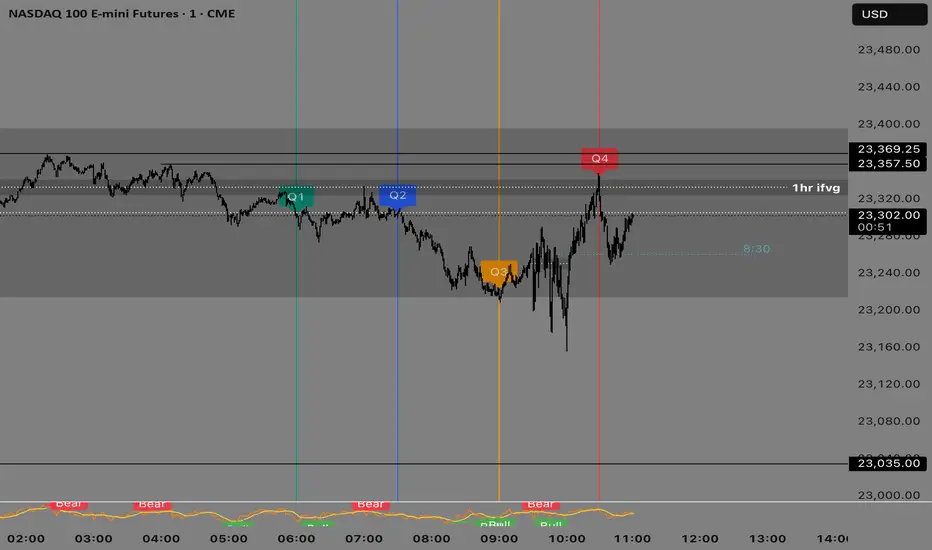
Quarterly Theory —Q1,Q2,Q3,Q4The Quarterly Theory Indicator is a trading tool designed to visualize the natural time-based cycles of the market, based on the principles of Quarterly Theory, popularized by the Inner Circle Trader (ICT). The indicator divides market sessions into four equal “quarters” to help traders identify potential accumulation, manipulation, and distribution phases (AMD model) and improve the timing of entries and exits.
Key Features:
Quarter Divisions (Q1–Q4):
Each market session (e.g., NY AM, London, Asia) is divided into four quarters.
Vertical lines mark the beginning of each quarter, making it easy to track session structure.
Optional labels show Q1, Q2, Q3, and Q4 directly on the chart.
True Open (Q2 Open):
The True Open is the opening price of Q2, considered a key reference point in Quarterly Theory.
A horizontal red line is drawn at the True Open price with a label showing the exact value.
This line helps traders filter bullish and bearish setups:
Buy below the True Open if the market is bullish.
Sell above the True Open if the market is bearish.
Session Awareness:
The indicator can automatically detect market sessions and reset lines and labels for each new session.
Ensures that only the current session’s True Open and quarter lines are displayed, reducing chart clutter.
Timeframe Flexibility:
Works on any chart timeframe (1-minute to daily).
Maintains accurate alignment of quarters and True Open regardless of the timeframe used.
Purpose of Quarterly Theory:
Quarterly Theory is based on the idea that market behavior is fractal and time-driven. By dividing sessions into four quarters, traders can anticipate potential market phases:
Q1: Initial price discovery and setup for the session.
Q2: Accumulation or manipulation phase, where the True Open is established.
Q3: Manipulation or Judas Swing phase designed to trap traders.
Q4: Distribution or trend continuation/reversal.
By visualizing these quarters and the True Open, traders can reduce ambiguity, identify high-probability setups, and improve their timing in line with the ICT AMD (Accumulation, Manipulation, Distribution) framework.
ACR(Average Candle Range) With TargetsWhat is ACR?
The Average Candle Range (ACR) is a custom volatility metric that calculates the mean distance between the high and low of a set number of past candles. ACR focuses only on the actual candle range (high - low) of specific past candles on a chosen timeframe.
This script calculates and visualizes the Average Candle Range (ACR) over a user-defined number of candles on a custom timeframe. It displays a table of recent range values, plots dynamic bullish and bearish target levels, and marks the start of each new candle with a vertical line. All calculations update in real time as price action develops. This script was inspired by the “ICT ADR Levels - Judas x Daily Range Meter°” by toodegrees.
Key Features
Custom Timeframe Selection: Choose any timeframe (e.g., 1D, 4H, 15m) for analysis.
User-Defined Lookback: Calculate the average range across 1 to 10 previous candles.
Dynamic Targets:
Bullish Target: Current candle low + ACR.
Bearish Target: Current candle high – ACR.
Live Updates: Targets adjust intrabar as highs or lows change during the current candle.
Candle Start Markers: Vertical lines denote the open of each new candle on the selected timeframe.
Floating Range Table:
Displays the current ACR value.
Lists individual ranges for the previous five candles.
Extend Target Lines: Choose to extend bullish and bearish target levels fully across the screen.
Global Visibility Controls: Toggle on/off all visual elements (targets, vertical lines, and table) for a cleaner view.
How It Works
At each new candle on the user-selected timeframe, the script:
Draws a vertical line at the candle’s open.
Recalculates the ACR based on the inputted previous number of candles.
Plots target levels using the current candle's developing high and low values.
Limitation
Once the price has already moved a full ACR in the opposite direction from your intended trade, the associated target loses its practical value. For example, if you intended to trade long but the bearish ACR target is hit first, the bullish target is no longer a reliable reference for that session.
Use Case
This tool is designed for traders who:
Want to visualize the average movement range of candles over time.
Use higher or lower timeframe candles as structural anchors.
Require real-time range-based price levels for intraday or swing decision-making.
This script does not generate entry or exit signals. Instead, it supports range awareness and target projection based on historical candle behavior.
Key Difference from Similar Tools
While this script was inspired by “ICT ADR Levels - Judas x Daily Range Meter°” by toodegrees, it introduces a major enhancement: the ability to customize the timeframe used for calculating the range. Most ADR or candle-range tools are locked to a single timeframe (e.g., daily), but this version gives traders full control over the analysis window. This makes it adaptable to a wide range of strategies, including intraday and swing trading, across any market or asset.

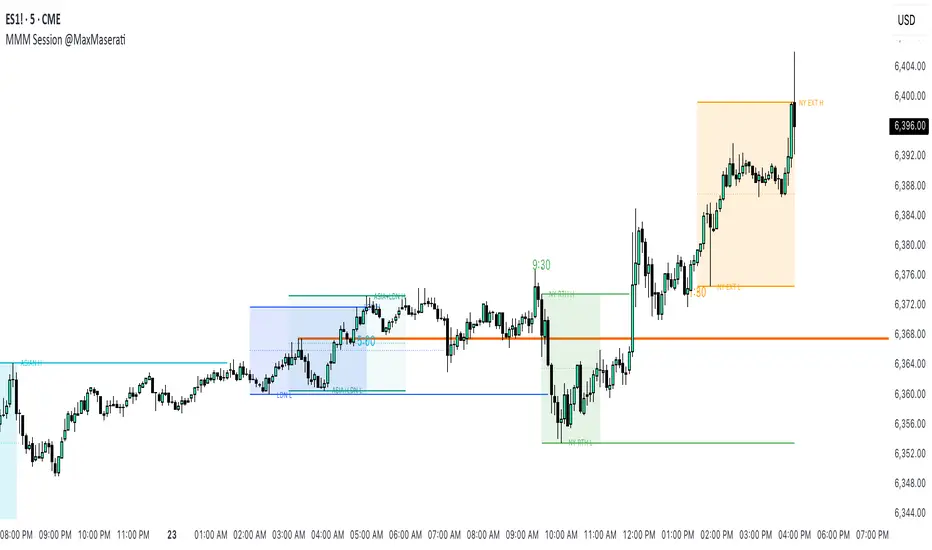
Session Overlaps & KZ's @MaxMaseratiSession Overlap & KZ's @MaxMaserati - Indicator Explanation
This comprehensive trading session indicator specializes in identifying critical market overlap periods and key session levels with two main operating modes: Normal Sessions and ICT KZ's
Dual Session Modes:
- Normal Sessions: Extended timeframes (Asia 9PM-6AM, London 3AM-12PM, NY AM 8AM-5PM, NY PM 1-7PM)
- ICT Killzones: Focused timeframes (Asia 6-8PM, London 2-5AM, NY AM 9:30-11AM, NY PM 1:30-4PM)
Primary Focus - Market Overlap Sessions:
- Asian + London Overlap (3-6AM ET): The most volatile early morning period when Asian and London markets intersect, creating significant liquidity and price movement opportunities.
- London + NY Overlap (8AM-12PM ET): The highest volume trading window of the day when London and New York markets are simultaneously active, offering maximum institutional activity and trend continuation.
- London Solo (6-8AM ET): Pure London trading period after Asian close but before NY open, often used for trend establishment and key level testing.
- NY Solo (12-5PM ET): Isolated New York session after London close, typically showing strong directional moves and institutional positioning.
- NY AM + PM Overlap (1:30-4PM ET): Critical afternoon overlap period when morning and afternoon NY sessions intersect, often marking significant reversal or continuation points.
Session Level Analysis:
Tracks High, Low, and Midpoint levels for each active session and overlap period
Smart line extension that continues levels until price interaction
Visual session boxes with customizable transparency
Show Only Overlaps mode to focus purely on market intersection periods
Critical Time Markers:
9:30 AM: NY AM Open (green dot)
5:00 AM: MMM Foundational time for MMM trading strategies (blue dot)
1:30 PM: NY PM Open (orange dot)
Additional Features:
Previous Day High/Low (PDH/PDL) levels
Multi-timezone support
Session limit control (last 3 sets by default)
Optimized for 15-minute and lower timeframes
Full customization of colors, labels, and styles
This indicator is essential for overlap-based trading strategies, providing clear visual identification of high-probability windows when multiple markets create enhanced liquidity and institutional activity.
Order-Flow Market StructureOrder-Flow Market Structure by The_Forex_Steward
A precision tool for visualizing internal shifts, swing structure, BOS events, Fibonacci levels, and multi-timeframe alerts.
What It Does
The Order-Flow Market Structure indicator intelligently tracks and visualizes price structure using higher timeframe candles. It automatically detects:
• Internal bullish and bearish structure shifts
• Swing highs and lows (HH, HL, LH, LL)
• Break of Structure (BoS) confirmations
• Fibonacci retracement levels from recent swing moves
• Real-time alerts across LTF, MTF, and HTF modes
It’s a complete tool for traders who follow Smart Money Concepts, ICT, or institutional price action strategies.
How It Works
• You select a Higher Timeframe (HTF) to set the structural context
• Internal shifts are identified using HTF candle closes
• The indicator scans for swing highs/lows after each internal shift
• Breaks of previous swing points confirm BoS and plot horizontal lines
• Zigzag lines visually connect structural points (swings and BoS)
• Fibonacci levels are drawn between the latest swings
• Alerts can be configured for structure shifts, BoS events, and fib level breaks
How to Use It
Set your preferred HTF (e.g., 1H while trading on 5-minute)
Enable Fibonacci levels to visualize retracement zones
Watch for:
• Bullish internal shifts → HL to HH
• Bearish internal shifts → LH to LL
• BOS → Breakout confirmation
Enable alerts to catch structural events in real-time
Adjust the "Safe History Offset" if working with long lookbacks or volatile assets
Who It's For
• Traders using Smart Money, ICT, or market structure-based systems
• Scalpers, day traders, and swing traders
• Anyone needing precise structural insight across multiple timeframes
Features
• BoS detection with custom line styles and width
• HH, HL, LH, LL label plotting
• Optional Fibonacci retracement zones
• Custom alerts for swing shifts and fib level breaks
• LTF, MTF, and HTF alert modes
Stay aligned with structure, trade with precision, and get alerted to key shifts in real time.

Mohammad - OBs, BOS, S/R, Elliott Waves & Trend LinesProfessional Trading Indicator System - Technical Analysis Suite
Overview
Advanced technical analysis system integrating ICT/SMC methodologies with classical analysis tools. Features seven analytical components for comprehensive market structure analysis.
Components
1. Order Blocks (ICT/SMC)
Identifies institutional accumulation/distribution zones acting as future support/resistance.
Detection: Automatic identification based on price rejection patterns
Management: Dynamic updates and removal of invalidated blocks
Configuration: Sensitivity levels (High/Medium/Low), ATR-based parameters
Visual: Green support, red resistance with transparency
2. Break of Structure (BOS)
Detects significant structural breaks indicating trend changes.
Method: 5-bar swing point formation
Display: White horizontal lines with labels
Range: 50-bar maximum lookback
3. Support & Resistance
Classical horizontal levels from significant price pivots.
Analysis: 300-bar historical scan
Filter: 10-point duplicate tolerance
Display: Maximum 15 levels within 5% of current price
4. Fair Value Gaps (FVG)
Price inefficiencies that often get filled on return.
Types: Bullish gaps (up) and bearish gaps (down)
Size: Minimum 0.1 ATR or 5 points
Management: Auto-removal when filled
5. Elliott Wave Analysis
Advanced pattern recognition for impulse and corrective waves.
Patterns: 5-wave impulse (1-2-3-4-5), 3-wave corrective (A-B-C)
Adaptive: Auto-adjusts to timeframe (3-10 depth range)
Display: Small dots with large numbers, starts from hidden point 0
6. 45-Degree Momentum Lines
Revolutionary projection system based on consecutive candle sequences.
Bearish Lines (Red):
Trigger: 5+ consecutive red candles
Start: HIGH of first red candle
Labels: B1-B5
Bullish Lines (Green):
Trigger: 5+ consecutive green candles
Start: LOW of first green candle
Labels: T1-T5
Specifications:
Angle: 45° using ATR * 0.15
Extension: 30 bars forward
Display: 5 most recent patterns
7. Classical Trend Lines
Multi-touch diagonal support/resistance detection.
Validation: Minimum touch requirements
Tolerance: ATR-based touch detection
Display: Blue lines with optional labels
Configuration Summary
Global Settings:
Show/hide each component individually
Customizable colors and line widths
Label size options
Performance:
50-bar periodic cleanup
Maximum object limits (500 each)
Conditional processing on bar close
Trading Applications
Scalping: Order Blocks + FVGs + 45° Lines
Day Trading: All components with BOS emphasis
Swing Trading: Elliott Waves + Trend Lines
Position Trading: Major levels + Elliott Waves
Key Strategies:
Use 45° line bounces for entries
Combine Order Blocks with 45° lines for confluence
Confirm BOS breaks with 45° line violations
Place stops beyond projection lines
Technical Requirements
Platform: TradingView Pine Script v5
Minimum: 300 historical bars
Optimal: 15m-4H timeframes
Performance: Moderate CPU usage
Color Scheme
Green: Bullish/Support (#26a69a)
Red: Bearish/Resistance (#ef5350)
White: BOS/S&R lines
Blue: Elliott Waves/Trend Lines
Customizable: 45° projection lines
Risk Disclaimer
Educational tool only. Not financial advice. Combine with risk management and personal analysis. Past performance doesn't guarantee future results. Trading involves substantial risk.
