Improved ICT MultiTF A+ IndicatorThis indicator provides ICT-style multi time frame fair value gaps with a 4-hour moving average bias. It prioritizes 15-minute gaps and falls back to 5-minute and 1-minute gaps when none are present. It also includes alert conditions for long and short signals based on session filters and bias.
"ict" için komut dosyalarını ara

Deyler IndicatorMerge indicators:
Nwog
ICT Killzones and Pivots
BTC Keylevels
9h30 First FVG
Round Number

Advanced ICT ADR Projections [bilal]📊 Overview
Professional ADR indicator designed specifically for index futures traders. Calculate and visualize Average Daily Range with multiple session options, fractional levels, and higher timeframe context.
✨ Key Features
🎯 Multiple Session Types
Full Day: Standard calendar day calculation
Midnight: Anchored to 00:00 NY time open
RTH (Regular Trading Hours): 09:30-16:00 NY session
Custom: Define your own session hours and anchor point
📐 Projection Levels
100% ADR Levels: Upper and lower range targets from anchor
Fractional Levels: 33% and 66% zones for partial targets
Custom Mirrored Levels: Set any percentage (0-200%) with automatic mirroring
Example: 25% shows both 25% and 75%
Example: 111% shows both 111% and -11%
📅 Higher Timeframe Context (Optional)
AWR: Average Weekly Range overlay
AMR: Average Monthly Range overlay
AYR: Average Yearly Range overlay
All HTF ranges use same anchor as daily session
📊 Information Table
Current session type and anchor time
ADR value for selected period
Current range and percentage used
Distance remaining to ADR targets (up/down)
Color-coded range percentage (green/orange/red)
🎨 Fully Customizable
Line colors, styles (solid/dashed/dotted), and widths
Toggle labels on/off
Adjustable ADR lookback period (1-100 days)
All HTF periods customizable
⚡ Smart Features
Lines start at actual session open (not fixed lookback)
Works on any timeframe
Real-time range tracking
Alert conditions when ADR reached or exceeded
🎯 Use Cases
For Day Traders:
Set profit targets at ADR extremes
Identify range expansion vs rotation days
Know when you've used 75%+ of daily range (possible reversal)
Compare RTH vs full day ranges
For Swing Traders:
Use AWR/AMR for weekly/monthly targets
Understand if today's move is significant in weekly context
Multi-timeframe confluence
Risk Management:
Size positions based on % of ADR remaining
Avoid trading when ADR exhausted (>100%)
Better stop placement using fractional levels
💡 Trading Tips
<50% ADR used = Room to run (continuation trades)
50-75% ADR used = Getting extended (scale out)
75-100% ADR used = Near extremes (reversal setups)
>100% ADR = Expansion day (trend day or volatility spike)
Use fractional levels (33%, 66%) as:
Partial profit targets
Re-entry zones on pullbacks
Confluence with other support/resistance
Compare RTH vs Full Day ADR to see if overnight or day session drives volatility.
⚙️ Settings Guide
ADR Period: 5 days is standard, adjust for different market regimes
Session Types:
Use Midnight for crypto or 24hr markets
Use RTH for pure day session analysis
Use Custom for specific session times (London, Asia, etc.)
Custom Levels:
Set 25% for quartile levels
Set 111% for extended targets beyond ADR
Experiment with 50%, 75%, 80% for your strategy
Perfect for ES, NQ, YM, RTY futures traders who need precise intraday range analysis with higher timeframe context!

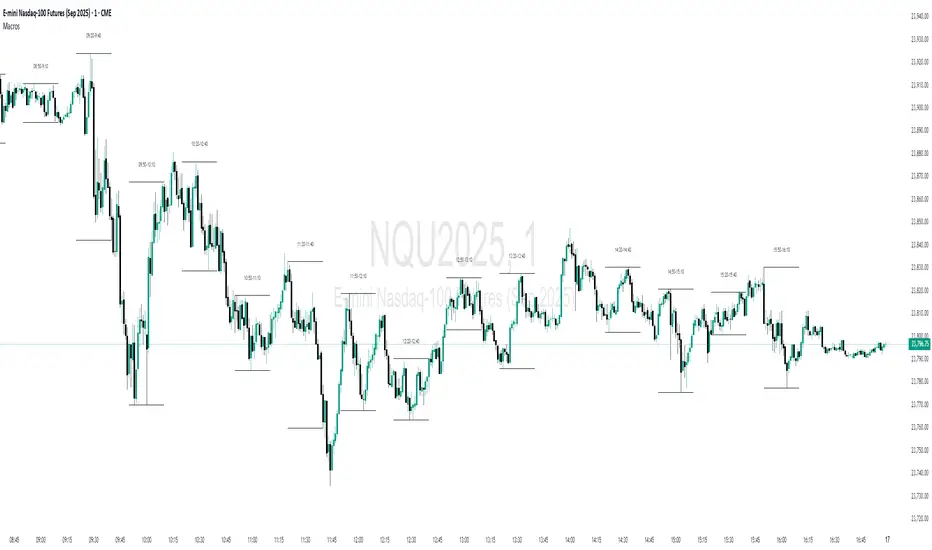
No FOMO! Trade only during ICT Macros**🚫 Crush FOMO. Trade ONLY during ICT's macro windows**
Tired of jumping into impulsive trades the moment price twitches? **No FOMO** paints your chart **blood-red** and slams a **giant 🚫 countdown** the instant you drift outside the **42-15 minute sweet spot** (or any custom intrahour rule you set).
- **Instant visual lockdown** – entire chart turns crimson between 16–41 min.
- **Loud alert on open/close** – push + sound so you never miss the gate.
- **One-click timezone picker** – EST, GMT, Tokyo… works globally.
- **Zero lag, lightweight** – runs on 1-min charts without slowing you down.
**Proven to kill revenge trades & over-trading in <7 days.**
Add to chart → watch discipline skyrocket.
*Free | Open-source | Works on every plan*
👉 **Tag a friend who needs this.**

Custom Time Separators + Hourly Open LinesThis Indicator is for those who wants to keep the chart clean and Study 1HR Profile.
best USE is : 1HR line Projected and 1 HR separator is plotted on the chart
i Use 4 Hrs. plotted and using for CRT Method to identify
SWEEP of C1 by C2 and, Entering ON C2 when its Trading back up,
or on your comfort of confirmation with MSS + FVG / OB
Lot of ICT Model can be traded and used with this including
PO3
Lumi trades : 1HR PO3
Ttrades CRT and Many more,
let me know if want to add anything if i think its useful we can add.
cheers

2-Stage PSP with SMT [Pogiest]General
Precision Swing Point (PSP) is a concept derived from Quarterly Theory concepts originating from ICT methodologies. The concept typically uses a 3-candle swing formation in which candle 2 has a divergence in the closing price with one asset compared to the other two assets in a correlated asset triad (i.e. one closes bullish and other two closes bearish, vice-versa). A Terminus Price Divergence (TPD) is an additional divergence between candle 1’s closing price and candle 3’s opening price (i.e. one asset’s candle 3 opening price opens below candle 1 closing price while the other two assets’ candle 3 opening price opens above candle 1 closing price, vice-versa). The candle 3 divergence and candle 2 divergence put together is what defines a TPD. Additionally, consecutive candle SMT (Smart Money Technique) are divergences between Candle 1/Candle 2 highs/lows or Candle 2/Candle 3 high/lows. There are different types of cracks in correlation. A crack in correlation can be defined as a precision swing point, a terminus price divergence, SMT, etc. A “2-Stage PSP” can be defined as a confirmed PSP with consecutive candle SMT. Several cracks in correlation can signify a potential reversal, retracement, or continuation.
What makes this indicator unique:
This indicator is designed to track PSP and TPDs in real time as they are forming. It first displays the current state of the current candle’s price action whether bullish or bearish and highlights when a PSP is about to form. Once the PSP is confirmed, the indicator looks for a second crack in correlation between candle 1’s closing price and candle 3’s opening price to confirm a TPD is active. Once the TPD is active, it looks for a crack in correlation via SMT between Candle 1 and Candle 2’s highs/lows or between Candle 2 and Candle 3’s high/lows. The PSP w/ TPD confirmation and SMT divergence would be deemed a “2-Stage PSP” which is all highlighted in the indicator table. Several cracks in correlation can signify a potential reversal, retracement, or continuation.
Note: Credit of concepts/ideas goes to TraderDaye, JacobSpeculates, The Market Lens Team, Afyz, and ICT.
How the Indicator Table Works
Timeframe Column:
1. Displays up to four different timeframes to monitor.
Asset Columns:
1. Cells display “Bull” in green background color or “Bear” in red background color showing the current state of each candle and updates in real-time tick by tick.
-2. Up and Down arrows are fixed in the cells when the TPD status is “Active” (See below) indicating the final print of the PSP candle (candle 2) closing bullish (up arrow) or bearish (down arrow). The arrows will be cleared once the TPD status is either in an “Inactive” or “Pending” state.
TPD Status Column (see defined divergences in General section above):
1. “Inactive” indicates no divergence in all assets (i.e. all three assets in a triad are all printing bullish or bearish candles)
2. “Pending” indicates a potential divergence in candle 2’s closing price (i.e. one asset’s current state in candle 2 is bearish while the others are bullish, vice versa). This updates in real-time tick by tick and continues to monitor each candle as they form for a candle 2 divergence.
3. “Active” indicates a confirmed TPD in which both a candle 2 divergence and candle 3 divergence (i.e. divergence between candle 3 opening price and candle 1 closing price) exists.
Note 1: If candle 2 has an asset in a correlated triad close as a doji candle (opening price and closing price are exactly the same) while the other two assets close bullish or bearish, the indicator will not deem candle 2 as a valid PSP candle. There has to be a divergence in the opening/closing price on at least two assets to be valid.
Note 2: Any historical TPDs will not be displayed in the table as this indicator only tracks TPDs in real time and continuously monitors for potential TPDs and confirmed TPDs.
Added Feature (2 Stage PSP)
SMT 1: Displays an SMT consecutive candle divergence between candle 1 and candle 2’s highs and lows. This is displayed once a TPD is in “Active” status while candle 3 is printing. Therefore, the label in the table cell displays past data (Candle 1 and Candle 2 high/low SMTs).
1. “Inactive” indicates there were no SMT divergences.
2. “Asset symbol names” are displayed with a corresponding up arrow or down arrow. Cell background color is red for SMT Divergence at the highs and green for SMT Divergence at the lows. For example, if there was a bearish SMT at the highs of candle 1/candle 2 and one asset made the higher high in candle 2, then that asset would have the up arrow indicating it swept candle 1’s high while the other assets have the down arrow as they did not sweep candle 1’s high. This works vice versa for bullish scenario.
3. “Both” indicates there are SMT divergences at both the highs and lows of candle 1 and candle 2.
SMT 2: Displays an SMT consecutive candle divergence between candle 2 and candle 3’s highs and lows. This is displayed while a TPD is in “Active” status and updates in real-time tick by tick during candle 3’s price action.
1. “Inactive” indicates there are no current SMT divergences.
2. “Asset symbol names” are displayed with a corresponding up arrow or down arrow. Cell background color is red for SMT Divergence at the highs and green for SMT Divergence at the lows. For example, if there was a bearish SMT at the highs of candle 2/candle 3 and one asset made the higher high in candle 3, then that asset would have the up arrow indicating it swept candle 2’s high while the other assets have the down arrow as they did not sweep candle 2’s high. If one of the assets that did not sweep candle 2’s high ends up sweeping the high, then that asset will dynamically move to the left of the cell next to the asset that swept candle 2’s high with an up arrow leaving only one asset with the down arrow. If the last asset ends up sweeping candle 2’s high, then the cell would change to “Inactive”. This works vice versa for bullish scenario.
3. “Both” indicates there are SMT divergences at both the highs and lows of candle 2 and candle 3. If an SMT on one side gets deleted, then the cell will automatically update to display the SMT that is still intact.
Note: Equal lows/highs are considered to be a failure swing since it did not sweep the previous candle low/high.
Settings
1. Choose up to three different assets to monitor.
Note: If only two are selected, the indicator will only display the two selected and compare the two assets for divergences. If one is selected, a warning sign will be displayed to select at least two assets.
2. Choose up to four different timeframes. Option to deselect timeframes.
3. Option to enable all alerts or active alerts. Alerts include the different status changes in the table (i.e. Pending, Active, Bullish SMT, Bearish SMT, etc for each or all timeframes).
4. Toggle option to show/hide the table. Toggle option to show/hide the “Title Row” which is the first row at the top of the table.
5. Adjust the table positioning to be displayed on the chart.
6. Option to change text size in the table cells. This will also increase/decrease the size of the table.
Unique User Experience:
1. Track current PSP/TPD status in real-time tick by tick as candles form in multiple timeframes.
2. Track consecutive candle SMT in a 3-candle swing formation in real-time in multiple timeframes.
3. Instead of switching through timeframes to check for PSPs/TPDs, they are consolidated in one table.
4. Once there is a confirmed consecutive candle SMT indicated on the table, there are several cracks in correlation (PSP, TPD, and SMT).
Risk Disclaimer
This indicator is for educational and informational purposes only and does not constitute financial advice. All trading and investment decisions remain solely the responsibility of the user.
Trading involves a high degree of risk, and past performance is not indicative of future results.
Always conduct your own research and consult with a qualified financial professional before making any trading decisions.
By using this indicator, users acknowledge they understand these risks and accept full responsibility for their trading decisions and outcomes.

IPDA Ranges – ProIPDA Ranges – Pro
This indicator plots Institutional Price Delivery Algorithm (IPDA) ranges based on lookback periods of 20, 40, and 60 days, as taught by ICT (Inner Circle Trader). It visualizes premium and discount zones, equilibrium levels, quadrants, and sub-quadrants to help traders identify key price areas and potential market biases.
Key Features:
- Displays IPDA ranges as boxes or lines, with customizable colors for discount, equilibrium, and premium zones.
- Optionally shades the 25%-75% mid-zone for each range.
- Supports quadrants (25% steps) and sub-quadrants with lines and labels for detailed price segmentation.
- Includes a table displaying either discount/premium status or percentage from equilibrium for each range.
- Configurable alerts for entry/exit into the mid-zone.
- Visual options include line styles, label sizes, price display on labels, and buffers for zone extension.
Settings Overview:
- IPDA Intervals: Enable/disable IPDA20, IPDA40, IPDA60; toggle quadrants, sub-quadrants, mid-zone shading, and drawing with lines vs. boxes.
- Colors and Styles: Customize colors for zones, lines, labels; select solid/dotted/dashed styles for borders and lines.
- Appearance: Adjust label and table sizes, table position, and background opacity.
- Labels: Show/hide per-range labels and include prices.
- Alerts: Enable mid-zone entry/exit alerts.
Usage:
Add the indicator to your chart and select the desired IPDA intervals. The ranges update dynamically based on daily highs and lows. Use the table for quick reference to current positioning (discount/premium or percentage). The mid-zone shading helps identify consolidation areas, while quadrants and sub-quadrants assist in pinpointing potential support/resistance levels.
© MadMonkTrading

Timeframe LiquidityTimeframe Liquidity – Multi-Timeframe Highs & Lows by
Timeframe Liquidity automatically plots previous day, week, month, and year highs and lows, key liquidity zones used by smart money and price-action traders. These levels extend into the future and can automatically stop once price wicks through, showing clear liquidity sweeps and tested zones.
Perfect for traders using ICT / SMC concepts, liquidity theory, or market structure analysis. Instantly see where liquidity rests, where it’s been taken, and how price reacts at major support and resistance.
Features:
Auto-plots PDH/PDL, PWH/PWL, PMH/PML, PYH/PYL
Custom line styles, colors, and label sizes
Option to stop line on wick (liquidity sweep)
Smart timeframe visibility (hides same-TF levels)
Accurate UTC offset handling
Identify liquidity pools fast, trade cleaner charts, and track where smart money hunts liquidity.
Built for precision, clarity, and confluence.

SMC FVG/IFVG (Multi-TF x 4) [ZAUTEC]SMC FVG/IFVG (Multi-TF x 4): Multi-Timeframe Fair Value Gap with Inversed FVG Detection
This powerful Pine Script indicator is designed to help traders identify, track, and manage Fair Value Gaps (FVGs) and their respective Inversed Fair Value Gaps (IFVGs) across up to four different timeframes simultaneously.
Key Features
Multi-Timeframe Analysis (4x): Analyze and display FVGs from four distinct timeframes alongside your current chart, offering a comprehensive view of market imbalances across various scales.
Fair Value Gap (FVG) Detection: Automatically identifies classic three-candle FVGs (market inefficiencies).
Customizable FVG Length: Set how many bars the FVG boxes should initially extend for.
Minimum Gap Size: Filter out minor, insignificant gaps using a tick-based minimum size threshold.
Optional Box Extension: Dynamically extend FVG boxes to the current bar index or use a fixed extension for a cleaner chart.
Inversed FVG (IFVG) Logic: Detects a high-probability reversal pattern where a previously filled FVG zone is immediately followed by the formation of a new, opposite FVG within or adjacent to the same area. This confirms the old FVG has "flipped roles" (e.g., from support to resistance).
Lookback Period: Defines how long the indicator searches for a corresponding FVG breach to confirm the IFVG.
IFVG Minimum Size: Customizable minimum size threshold for the IFVG.
Dynamic Box Management:
Automatic Fill Deletion: FVGs are automatically removed from the chart when price action fully trades through the gap, signifying the imbalance has been "filled."
IFVG Tracking: IFVGs are tracked and removed from the chart after the configurable lookback period.
Full Customization: Control the visibility, colors, border styles (solid, dashed, dotted), and width for FVG, Bearish FVG, Bullish FVG, and IFVG boxes independently for each of the four timeframes.
How to Use
Select Timeframes: Choose up to four desired timeframes in the settings (e.g., "15" for 15-minute, "4H" for 4-hour, "D" for Daily). Leave the field empty to use the chart's current timeframe.
Toggle Visibility: Use the Show FVG and Show IFVG toggles to focus on the imbalances you wish to see.
Adjust Extension: Set Extend Boxes to bar index to true to keep all open FVG boxes drawn all the way to the current live price bar.
Interpret the Gaps:
FVG (Bullish/Bearish): Potential areas for price to return to and find support/resistance.
IFVG (Inverse FVG): Stronger signals that a previous zone of imbalance has been violated and is likely to act as a significant flip zone for future price movements.
This indicator is an essential tool for traders utilizing concepts like ICT (Inner Circle Trader) and SMC (Smart Money Concepts), providing a clear visual representation of market structure and liquidity voids.

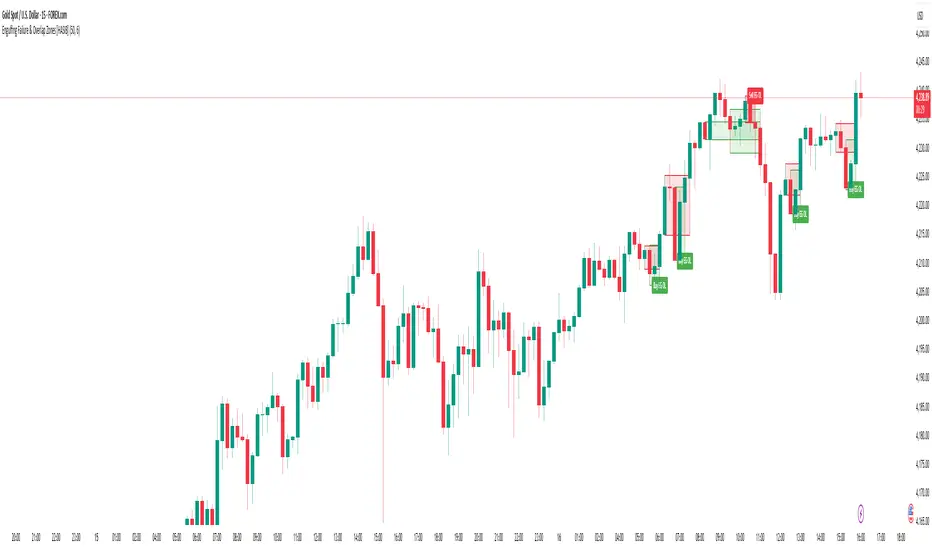
Engulfing Failure & Overlap Zones [HASIB]🧭 Overview
Engulfing Failure & Overlap Zones is a smart price action–based indicator that detects failed engulfing patterns and overlapping zones where potential liquidity traps or reversal setups often occur.
It’s designed to visually highlight both bullish and bearish failed engulfing areas with clean labels and zone markings, making it ideal for traders who follow Smart Money Concepts (SMC) or price action–driven trading.
⚙️ Core Concept
Engulfing patterns are powerful reversal signals — but not all of them succeed.
This indicator identifies:
When a Buy Engulfing setup fails and overlaps with a Sell Engulfing zone, and
When a Sell Engulfing setup fails and overlaps with a Buy Engulfing zone.
These overlapping areas often represent liquidity grab zones, reversal points, or Smart Money manipulation levels.
🎯 Key Features
✅ Detects both Buy and Sell Engulfing Failures
✅ Highlights Overlapping (OL) zones with colored rectangles
✅ Marks Buy EG OL / Sell EG OL labels automatically
✅ Fully customizable visuals — colors, padding, and zone styles
✅ Optimized for both scalping and swing trading
✅ Works on any timeframe and any instrument
⚡ How It Helps
Identify liquidity traps before reversals happen
Visually see Smart Money overlap zones between opposing engulfing structures
Strengthen your entry timing and confirmation zones
Combine with your own SMC or ICT-based trading setups for higher accuracy
📊 Recommended Use
Use on higher timeframes (e.g., M15, H1, H4) to confirm major liquidity zones.
Use on lower timeframes (e.g., M1–M5) for precision entries inside the detected zones.
Combine with tools like Order Blocks, Break of Structure (BOS), or Fair Value Gaps (FVG).
🧠 Pro Tip
When a failed engulfing overlaps with an opposite engulfing zone, it often signals market maker intent to reverse price direction after liquidity has been taken. Watch these zones closely for strong reaction candles.
FVG +Displcement/ATR/3thClosedBody [hatefbw]Overview
This indicator is a modified version of the LuxAlgo group’s FVG indicator. It now includes three advanced optional filters that help traders identify only the strongest and most reliable Fair Value Gaps (FVGs), aligned with Smart Money Concepts (SMC) and ICT methodology.
How it works
We’ve added the following new configurable options to the indicator:
✅ Confirm Third Closed Body
When enabled, ensures the third candle (right after the gap) closes beyond the wick of the second candle.
✔️ Adds extra validation to price direction and filters out weaker FVGs.
✅ Confirm Displacement Candle
Validates that the second candle (the one forming the FVG) is a strong displacement candle. This condition checks for:
📏 Large body relative to total range (customizable %, default: 70%)
📈 High volume above 20-period moving average
🔺 Break of Structure (BOS) in the direction of the FVG
Bullish FVG: breaks above recent highs
Bearish FVG: breaks below recent lows
✅ ATR-Based Validation (optional)
Adds an additional filter where the second candle’s body or range must exceed the ATR (default: ATR 14, configurable).
✔️ Further confirms that the displacement candle has significant market movement.
Usage
All features are 100% optional and can be toggled in the settings.
Use them to filter out weak FVGs and align trades with institutional-grade setups.

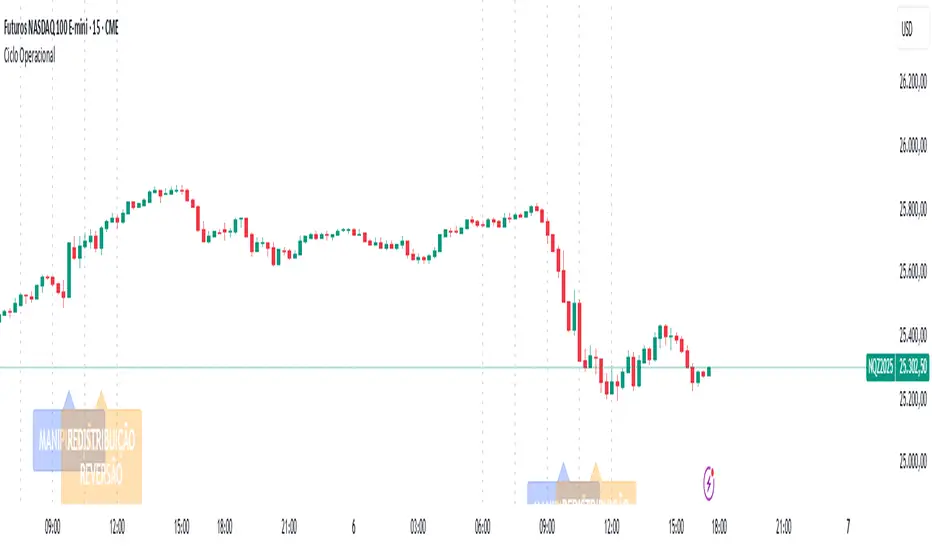
Quarterly Theory [@kaleboraciy]🧠 Daye Quarterly Theory is based on the idea that markets often move in repeating cycles. Each part of the cycle reflects a stage of the market
Consolidation
Manipulation
Distribution
Reversal/Continuation
This is a classic AMD-X pattern, which is widely used in SMC & ICT concepts. By spotting these phases, traders can better understand where the market might be heading next.
⭐ An important feature of this indicator is the Fibonacci levels, which are calculated in a clever way on the Q1 part of each cycle. You can use this levels for precise entries on manipulation in Q2
📖 Now I want to give brief description of each cycle:
Daily Cycle - the day can be broken down into 6 hour quarters
Q1 - 18:00 - 00:00 Asia.
Q2 - 00:00 - 06:00 London (True Open).
Q3 - 06:00 - 12:00 NY AM.
Q4 - 12:00 - 18:00 NY PM.
Pro tips:
Q2 often lines up with the session’s True Open - a key reference for directional bias.
Q3 tends to show the most directional momentum during the trading day.
Q4 is a critical zone for judging whether the day will extend the move or retrace.
Weekly Cycle - Daye determined that although the trading week is composed of 5 trading days, we should ignore Friday, and the small portion of Sunday’s price action:
Q1 - Monday
Q2 - Tuesday (True Open, Daily Candle Open Price).
Q3 - Wednesday.
Q4 - Thursday.
Pro tips:
Wednesday (Q3) often provides the week’s strongest directional movement - many trades target this zone.
Tuesday’s manipulation (Q2) may shake out weak positions or set up the directional swing - be careful
Thursday (Q4) helps confirm whether the weekly trend continues or reverses.
Monthly Cycle - considering that we have four weeks in a month, we start the cycle on the first Monday of the month (regardless of the calendar Day):
Q1 - Week 1: first Monday of the month.
Q2 - Week 2: second Monday of the month (True Open, Daily Candle Open Price).
Q3 - Week 3: third Monday of the month.
Q4 - Week 4: fourth Monday of the month.
I hope, that this awesome tool will boost your trading 💰

Basic ICT PD Array MarkerIt focuses on OBs and FVGs on your chosen timeframe (e.g., H1 for /NQ). This is open-source friendly and based on ICT logic from community scripts.

ShadowCorp ICT Extended Macros (Original by toodegrees)Based on “ICT Algorithmic Macro Tracker° (Open-Source) by toodegrees” (MPL-2.0), this version simply extends the original macro logic: it keeps the same left/right verticals and dynamic horizontal cap. In short, it’s just an extended macro compared to TooDegree’s

Multi Timeframe BOS & rBOSThis is the same Multi-Timeframe Break of Structure and Market Structure Shift posted by Lenny_Kiruthu. However, the only difference is the naming of Market Structure Shift to rBOS (Break of Structure Reverse). To me, they are all break of structures when previous peaks or valleys are violated. The only difference is in sequence. Once a sequence of BOS reverses, then a new sequence begins. To me, this simplifies the various terminology incorporated by different systems such as ICT or SMT which adds unnecessary complexity.
eT

Opening Range Gaps [LEG]📌 Opening Range Gaps
Are you tired of indicators that don’t show the correct opening price on CFDs, or that fail to capture the true 09:30 open or the 16:14 on Nasdaq futures?
Or worse… tools that only work on the 1-minute chart?
👉 This script was built to fix that.
🔑 Why this indicator?
Unlike most gap tools, Opening Range Gaps :
Works seamlessly on both CFDs and Futures for Nasdaq.
Captures the exact 16:14 close (the CFD session end) and the true 09:30 open using M1 data aggregation, even if you’re on a higher timeframe.
Works reliably on any intraday timeframe — not just the 1-minute chart, but all the way up to the timeframe you set in the Timeframe Limit (default: 30m).
⚙️ Features:
Gap Detection with Precision
Uses the close of the 16:14 bar (last CFD session minute) as the reference.
Captures the specific open at 09:30 (not approximated by session).
Plots the gap as a shaded box with customizable colors.
Quarter Levels Inside the Gap
Automatically divides the gap into 25%, 50%, and 75% levels for precision trading.
Customization
Show/hide vertical session delimitations.
Choose whether to track the reference price throughout the session.
Extend boxes to the right for context.
Keep only the last “n” gaps on your chart (default: 10).
Works Across Timeframes
Thanks to request.security_lower_tf, all logic is based on 1-minute data, so even if you’re on 5m, 15m, or 30m, the gap will always plot with exact levels.
🧭 Use Cases
Spot the true overnight gap between CFD close (16:14) and futures open (09:30).
Track how Nasdaq fills (or fails to fill) gaps during the day.
Use quarter levels for partial fills, rejection points, or continuation setups.
Combine with ICT concepts or price action strategies to identify liquidity-driven moves.

TDT Candle CounterThis indicator allows you to count candles inside a custom date range and display labels directly on the chart.
It supports three different counting modes:
🔢 Modes
Every Candle → Marks every bar sequentially (1, 2, 3, 4, …).
Alternative Sequence → Marks bars that match the sequence 1, 5, 9, 17, 25, 37, ….
Special Sequence (default) → Marks bars that match the sequence 1, 3, 7, 13, 21, 31, ….
Each mode has its own color so you can quickly distinguish which cycle is active.
⚙️ Features
Custom start and end date for the counting period.
Option to highlight the active period with a background color.
Labels are positioned above or below candles depending on the initial direction.
Alerts when:
Counting starts
Counting ends
🎯 Use Cases
Visualize candle sequences for cycle analysis.
Track market structure with custom numerical references.
Combine with other tools to study periodic behavior.
Inspired by Time Dilation Theory (TDT)
This counting approach is inspired by the Time Dilation Theory (TDT) methodology created by ICT Morpheus. According to TDT, markets unfold in cycles of 1, 3, 7, 13, 21… etc., reflecting natural rhythms of expansion, contraction, and distortion—an idea grounded in fractal time behavior across multi-timeframe analysis
Incorporating TDT principles into this tool helps visualize and align potential turning points and momentum shifts across different timeframes.

High Time Frame FVG [TakingProphets]HTF FVG
The HTF FVG indicator is built for traders who want a clean, multi-timeframe view of Fair Value Gaps (FVGs) without manually flipping charts. It automatically detects unmitigated FVGs across up to five higher timeframes and overlays them directly on your active chart, keeping your execution bias aligned with higher-timeframe liquidity.
✨ What it does
📌 Multi-timeframe mapping – Detects and plots bullish/bearish FVGs across up to 5 custom HTFs + your current chart.
🧩 Auto-labeling – Each gap is tagged with its originating timeframe (e.g., M5, H1, D1).
🔄 Live updates – FVGs extend forward in time and are automatically removed once mitigated based on your plan.
🟢 Inverse FVGs (optional) – Highlight “inverse gaps” for traders who utilize them in reversal models.
🎯 Consequent Encroachment lines – Enable mid-gap CE levels for precision-based trade management.
⚡ Optimized performance – Built with array management, capped lookback periods, and per-timeframe limits for smooth charting.
🛠️ How it works
Fair Value Gaps are detected using a 3-candle structure:
Bullish FVG → the high of two candles ago is below the low of the prior candle.
Bearish FVG → the low of two candles ago is above the high of the prior candle.
For each selected timeframe:
When an FVG forms, a box is drawn from the gap boundaries and extended forward by a configurable number of bars.
If price closes into the gap on its originating timeframe, the box is automatically removed.
If Consequent Encroachment is enabled, a mid-gap line is plotted for refined targeting.
When multiple gaps exist per side, only the closest unmitigated one remains highlighted for clarity.
⚙️ Inputs & customization
Detection Sensitivity → High / Medium / Low
Lookback Period → 1 Day / 1 Week / 1 Month / Max
Extend Gaps → Add extra forward bars beyond the originating candle.
Show Consequent Encroachment → Toggle CE midlines on/off.
Show Inverse FVGs → Mark inverted gaps for advanced models.
Custom HTFs → Choose up to 5 timeframes to map onto your execution chart.
Appearance Settings → Configure colors, transparency, label size, and gap boundary styles.
📈 Practical tips
Use smaller execution timeframes (e.g., 1m–5m) and overlay multiple HTFs (e.g., M15, H1, H4, D1).
Watch for stacked HTF FVGs in the same price zone — these often create higher-probability draw areas.
Pair CE midlines with session timing, PD arrays, and liquidity concepts to refine entries.
Limit your lookback period and max stored FVGs for better performance during volatile sessions.
📌 Notes
This tool does not generate buy/sell signals. It’s a context mapping utility to help align your trading plan with higher-timeframe structure.
Weekend gaps are automatically filtered out to reduce false positives.
🏷️ Credits & disclaimer
Concepts: ICT / Smart Money methodologies around imbalances and liquidity gaps.
Disclaimer: This script is for educational purposes only and should not be considered financial advice. Always test on demo and trade your own plan.

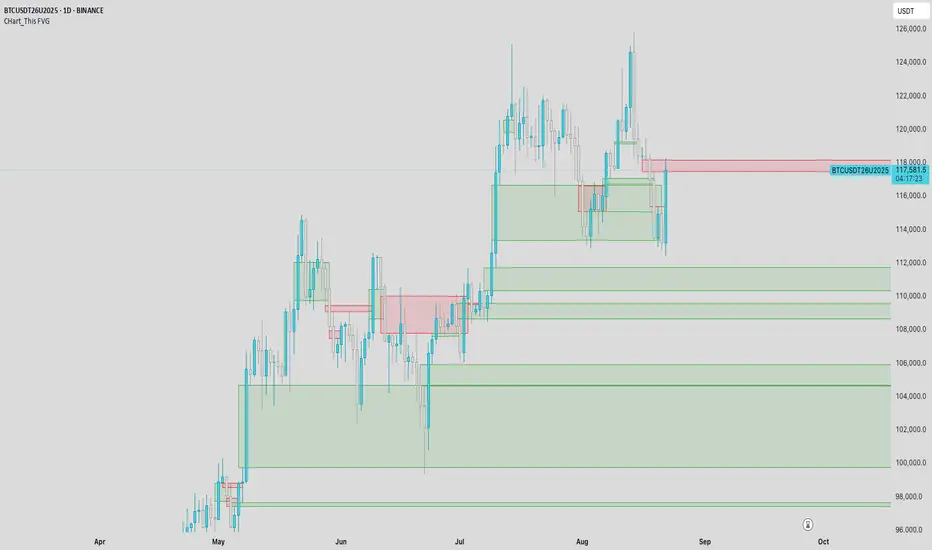
CHart_This FVGThis script will work on any time frame, and auto plots the classic ICT "fair value gaps", or imbalances, that result from a three candle formation wherein the middle candle body extends beyond the highs and lows of the end candles, leaving no overlap of the first and last candle wicks. Bullish imbalances are green, and bearish are red. Plotted zones will automatically close once a candle closure fully violates the imbalance zone with a close beyond its borders.
Advanced Price Ranges ICTThis indicator automatically divides price into fixed ranges (configurable in points or pips) and plots important reference levels such as the high, low, 50% midpoint, and 25%/75% quarters. It is designed to help traders visualize structured price movement, spot confluence zones, and frame their trading bias around clean range-based levels.
🔹 Key Features
Custom Range Size: Define ranges in points (e.g., 100, 50, 25, 10) or in Forex pips.
Forex Mode: Automatically adapts pip size (0.0001 or 0.01 for JPY pairs).
Dynamic Anchoring: Price ranges automatically align to the current price, snapping into blocks.
Multiple Ranges: Option to extend visualization above and below the current active block for a complete grid.
Level Types:
High / Low of the range
50% midpoint
25% and 75% quarters
Custom Styling: Adjustable line colors and widths for each level type.
Labels: Optional right-edge labels showing level type and exact price.
Alerts: Built-in alerts for when price crosses the range high, low, or 50% midpoint.
🔹 Use Cases
Quickly map out 100/50/25/10 point structures like Zeussy’s advanced price range method.
Identify key reaction levels where liquidity is often built or swept.
Support ICT-style concepts like range-based bias, fair value gaps, and liquidity pools.
Works for indices, futures, crypto, and forex.
🔹 Customization
Range increments can be set to any size (default 100).
Toggle which levels are shown (High/Low, Midpoint, Quarters).
Adjustable line widths, colors, and label visibility.
Extend ranges above and below for broader market context.

IFVG by Toño# IFVG by Toño - Pine Script Indicator
## Overview
This Pine Script indicator identifies and visualizes **Fair Value Gaps (FVG)** and **Inverted Fair Value Gaps (IFVG)** on trading charts. It provides advanced analysis of price inefficiencies and their subsequent inversions when mitigated.
## Key Features
### 1. Fair Value Gap (FVG) Detection
- **Bullish FVG**: Detected when `low > high ` (gap between current low and high of 2 bars ago)
- **Bearish FVG**: Detected when `high < low ` (gap between current high and low of 2 bars ago)
- Visual representation using colored rectangles (green for bullish, red for bearish)
### 2. Inverted Fair Value Gap (IFVG) Creation
- **IFVG Formation**: When a FVG gets mitigated (price fills the gap with candle body), an IFVG is created
- **Color Inversion**: The IFVG takes the opposite color of the original FVG
- Mitigated bullish FVG → Creates red (bearish) IFVG
- Mitigated bearish FVG → Creates green (bullish) IFVG
- **Mitigation Logic**: Uses only candle body (not wicks) to determine when a FVG is filled
### 3. Customizable Display Options
- **Show Normal FVG**: Toggle visibility of regular Fair Value Gaps
- **Show IFVG**: Toggle visibility of Inverted Fair Value Gaps
- **Smart FVG Display**: Even when "Show Normal FVG" is disabled, FVGs that are part of IFVGs remain visible
- **Extension Control**: Option to extend FVGs until they are mitigated
### 4. IFVG Extension Methods
- **Full Cross Method**: IFVG remains active until price completely crosses through it (including wicks)
- **Number of Bars Method**: IFVG remains active for a specified number of bars (1-100)
### 5. Visual Mitigation Signals
- **Cross Markers**: Shows X-shaped markers when IFVGs are mitigated
- Green cross above bar: Bearish IFVG mitigated
- Red cross below bar: Bullish IFVG mitigated
### 6. Comprehensive Alert System
- **IFVG Formation Alerts**: Notifications when new IFVGs are created
- **IFVG Mitigation Alerts**: Notifications when IFVGs are filled/mitigated
- **Separate Controls**: Individual toggles for bullish and bearish IFVG alerts
## How It Works
### Step-by-Step Process:
1. **FVG Detection**: Script continuously scans for 3-bar patterns that create price gaps
2. **FVG Tracking**: Each FVG is stored with its coordinates, type, and status
3. **Mitigation Monitoring**: Script watches for candle bodies that fill the FVG
4. **IFVG Creation**: Upon mitigation, creates an IFVG with opposite polarity at the same location
5. **IFVG Management**: Tracks and extends IFVGs according to chosen method
6. **Visual Updates**: Dynamically updates colors and visibility based on user settings
## Use Cases
- **Support/Resistance Analysis**: IFVGs often act as strong support/resistance levels
- **Market Structure Understanding**: Helps identify how market inefficiencies get filled and reversed
- **Entry/Exit Timing**: Can be used to time entries around IFVG formations or mitigations
- **Confluence Analysis**: Combine with other technical analysis tools for stronger signals
## Configuration Parameters
- **Colors**: Customizable colors for bullish/bearish FVGs and IFVGs
- **Extension**: Choose how long to display gaps on the chart
- **Alerts**: Full control over notification preferences
- **Visual Clarity**: Options to show/hide different gap types for cleaner charts
## Technical Specifications
- **Pine Script Version**: 5
- **Overlay**: True (displays directly on price chart)
- **Max Boxes**: 500 (supports up to 500 simultaneous gaps)
- **Performance**: Optimized array management for smooth operation
This indicator is particularly valuable for traders who use **Smart Money Concepts (SMC)** and **Inner Circle Trader (ICT)** methodologies, as it provides clear visualization of how institutional order flow creates and fills market inefficiencies.

Macro Times by OutOfOptionsThis indicator highlights macro times on the chart and provides visual and system alerts before a macro begins.
Unlike other macro indicators, this one supports unlimited macro configurations using the format 'HH:mm-HH:mm : Description' . By default, it includes a mix of ICT and Hydra macro times. Incorrect formatting in settings triggers an error, and clicking the "!" error message identifies the problematic configuration line.
You can customize all visual elements, including whether to display Top, Bottom, or 50% lines, highlight the macro zone, or label the macro.
To reduce chart clutter, you can also limit the number of past macros displayed.
For alerts, you can set the advance warning time in minutes and customize the visual alert style (e.g., a vertical line) if enabled.
The indicator is compatible with timeframes of 5 minutes or less; higher timeframes will generate an error.