Ichimoku [Gu5]Original Ichimoku Kinko Hyo created by Goichi Hosoda 1930
Knowing how to interpret the Ichimoku indicator can be complicated. I hope this version is more intuitive
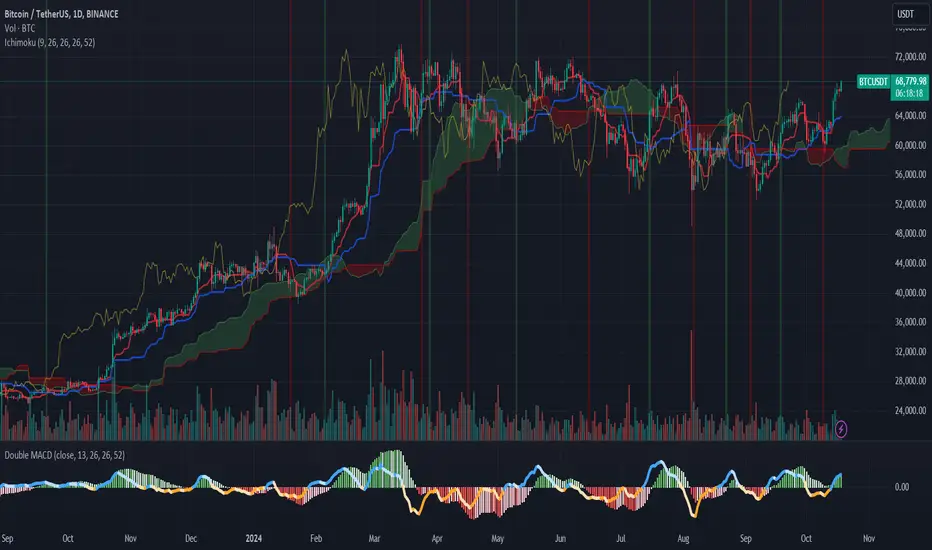
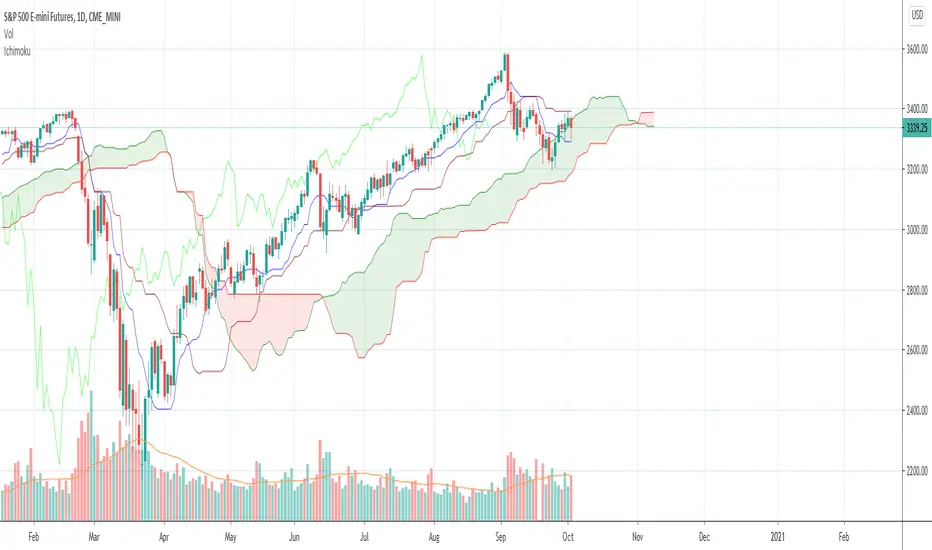
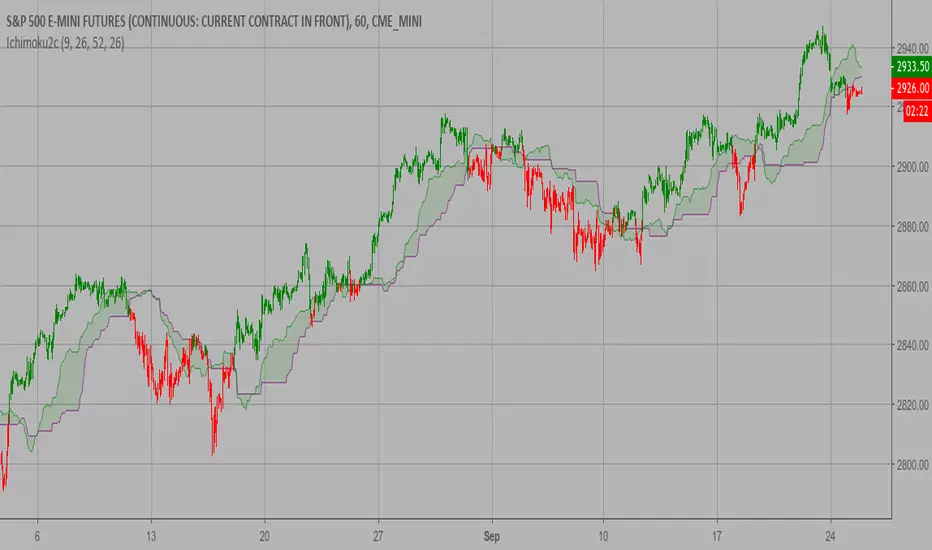
Use Ichimoku to determine the trend of the day
When the market is above the cloud, and Tenkan (green line) crosses over Kijun (red Line), there is a Bullish Trend . When Tenkan crosses under Kijun, the trend ends.
When the market is under the cloud, and Tenkan crosses under Kijun; There is a Bearish Trend . When Tenkan crosses over Kijun, the trend ends.
When the market crosses the cloud (orange bars), there is no trend
The default setting is 9, 26 and 52. For cryptocurrencies (24/7 market), you can change it to 10, 30 and 60 periods.
///
Ichimoku Kinko Hyo fue creado por Goichi Hosoda en 1930
Saber interpretar al indicador Ichimoku puede ser complicado. Espero esta version sea mas intuitiva
Use Ichimoku para determinar la tendencia del día, y operar solo a favor de la misma
Cuando el mercado esta sobre la nube y Tenkan (linea verde) cruza sobre Kijun (linea roja), la tendencia es alcista. Cuando Tenkan cruza bajo Kijun, termina la tendencia.
Cuando el mercado esta bajo la nube y Tenkan cruza bajo Kijun, la tendencia es bajista. Cuando Tenkan cruza sobre Kijun, termina la tendencia.
Cuando el mercado atraviesa la nube (barras naranjas), no hay tendencia
Por defecto, el seteo es 9, 26 y 52. Para criptomonedas, puede cambiarlo a 10, 30 y 60 períodos
"ichimoku" için komut dosyalarını ara

Ichimoku ACE ClubA. Overview:
This script is a custom implementation of the Ichimoku Cloud indicator for the TradingView platform, built using Pine Script version 4. It adds additional features like custom "Knife" lines and circle markers for specific data points. The indicator overlays on the chart and plots various elements of the Ichimoku system, including the Tenkan, Kijun, Chikou, and Kumo Cloud.
B. Inputs:
1. Tenkan (TS): This is the short-term moving average line (default period: 9).
2. Kijun (KJ): This is the medium-term moving average line (default period: 17).
3. Knife1 (K1): This line is based on a longer-term moving average (default period: 65).
4. Knife2 (K2): Another long-term moving average line (default period: 129).
5. Chikou Displacement (Chikou_Disp): The Chikou Span is plotted with a delay of 26 periods by default.
6. Displacement (disp): Determines the horizontal shift of the Kumo cloud.
C. Functions:
- `donchian(len)`: This function calculates the Donchian channel, which is the average of the highest high and the lowest low over the given period (len).
- `mf(len, offset)`: This function calculates the highest high and the lowest low over the given period, with an offset applied.
D. Plots:
1. Tenkan, Kijun, Knife1, and Knife2: These are plotted as lines with different colors and thicknesses.
- Tenkan is blue.
- Kijun is red.
- Knife1 is yellow.
- Knife2 is orange.
2. Chikou Span: This is plotted with a displacement and shown in purple.
3. Kumo Cloud: The cloud is formed by plotting two lines, Span A (green) and Span B (magenta), which represent the top and bottom of the cloud, respectively. The space between these lines is filled with a semi-transparent color, either green or magenta, depending on the relative position of the two spans.
E. Circle Markers:
- Additional circle markers are plotted for each of the Tenkan, Kijun, Knife1, and Knife2 lines at various offsets, helping to visualize the historical data points for each of these indicators. These circles are color-coded according to the line they correspond to.
F. Customization:
- The indicator allows customization of the lengths (periods) for Tenkan, Kijun, Knife1, Knife2, and other components via the script's input fields.
G. Conclusion:
This Ichimoku-based indicator provides a detailed view of the market's trend strength and direction. It offers a unique addition with the Knife lines and visual aids like circle markers for specific periods, which helps traders make better-informed decisions based on Ichimoku analysis.
---
You can modify the parameters such as `TS`, `KJ`, `K1`, `K2`, and `disp` according to your trading preferences. The colors and line thicknesses can also be adjusted for better visual representation.

Ichimoku MA Up & DownIchimoku and MA use the default.
It is repainted because it uses a moving average line.
A marker is only true if it was created after the candle closed.
The principle is too simple.
Please enjoy using it.
- Up : Conversion Line > MA #1 and Base Line > MA #2
It is an uptrend. The short-term moving average should be above the conversion line. And the long-term should be above the Base Line.
- Down : Conversion Line < MA #1 and Base Line < MA #2
It's a downtrend. The short-term moving average should be below the conversion line. And the long-term should be below the Base Line.
You can get better results if you use a momentum indicator like RSI.
Thank you.

Ichimoku ImbalanceYou may have heard the word balance or imbalance
This indicator is designed based on Ichimoku periods to display imbalances in each period
When you see a black mark, it means that one of the Ichimoku periods is saturated or unbalanced
If the current candle was equal to the lowest price on 9/26/52 of the last period and the highest price was equal to the last candle from left on 9/26/52 of the last period
If the current candle was equal to the highest price on 9/26/52 of the last period and the lowest price was equal to the last candle from right on 9/26/52 of the last period
This indicator is a useful and powerful tool for Ichimoku traders to understand overbought and oversold points in different time periods.
Note: This is an auxiliary tool and does not issue buy and sell signals

Ichimoku ScreenerChecks the status of Ichimoku Cloud for 30 coins/stocks.
It may take several seconds ( around 30 sec ) to load.

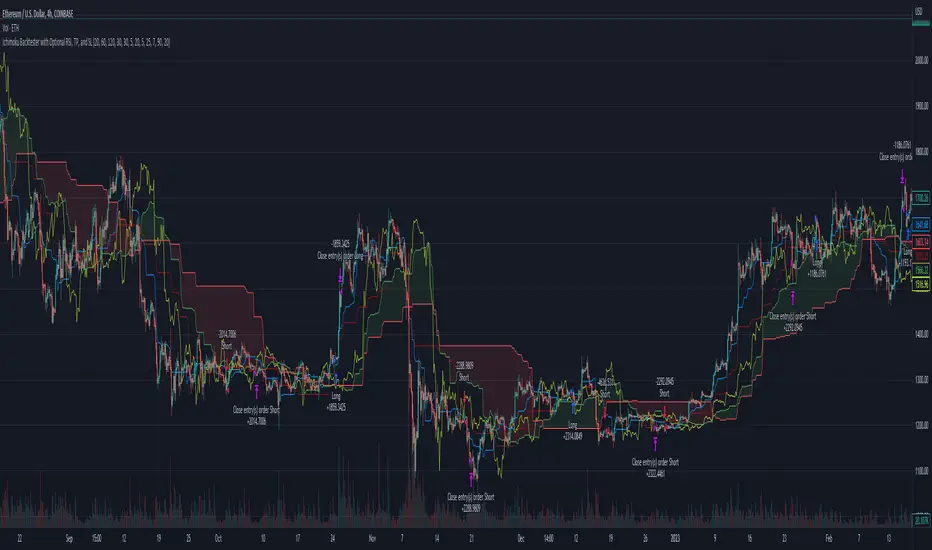
Ichimoku Market Scanner - AdvancedThis is an Advanced and Fully customizable version of Ichimoku Indicator.
Disclamer:
IMS - Advanced will NOT trade for you. In order to get profitable you need to have good Tecnichal Analisys Skills and a solid strategy to apply.
How does it works?
IMS read istantly and objectively the most important Ichimoku signals and give you visual feedback of the market in the INFO PANEL.
You will be able too spot the best setups for your trades, increasing you edge against the market and decreasing the time passed staring at the screen. All you need to do is just scrolling your charts and timeframes to spot what do you want.
Features:
-Fully customizable Indicator.
-Allert for each market condition in case you are waiting for a specific setup.
-Instant Market conditions Scan, just scroll charts and get instant visual feedback.
-Sellitti rating for each parameter according with his solid Ichimoku Advanced Strategy.
-KijunSen momentum detection mode Instant/Trend Based - (fits your trading style).
-Highlight Market Conditions, see the market like you never done before.
-Infopanel now can be moved away from prices without hide it with the offset option.
-Custom color/thickness/form for each component related to market condition. For example: you can decide to make Kijun change color/thickness/form if bullish/bearish/neutral.
-Market condition highlight. Bars can change color depending the status of your market condition you want to highlight.
-IMS fits any trading style and level, you can apply and improve on it any Ichimoku based strategy.

Ichimoku [2022] [v5] [keivanipchihagh]A more personalized ichimoki indicator with more configurations.
This indicator is exactly like the original ichimoku indicator, but with 104 Line (x4 timeframe) , 208 Line (x8 timeframe) , Quality Line and Tenken-sen & Kijun-sen crossovers added as well. The extras added to the indicator can simply be hidden in order to make the chart look less full.
104 Line : The formula is to average the highest and lowest point of the last 104 candles. This is to see the x4 time-frame as well, which shows a strong support and resistance line.
208 Line : The formula is to average the highest and lowest point of the last 208 candles. This is to see the 84 time-frame as well, which shows even a stronger support and resistance line.
Quality Line : It's exactly the same the Kijun-sen but with a positive offset of 26.
Tenken-sen & Kijun-sen Crossoveers : Just to make it easier to see the crossovers.
In future updates, I'm going to add more components and make it more insightful than it currently is. Ideas would be appreciated (:
Ichimoku Kinko Hyo [+Conditions]version 5 script - Future Cloud visible at real-time
This Ichimoku Indicator has 30 conditions identified for usage such:
Thick cloud identification (relative to the historic cloud thickness), Chikou in open area, Thin cloud identification (Relative to %), Price movements near Tenkan and Kijun and many more.
p.s. use 'calc_on_every_tick=false' in strategies to avoid repainting

Ichimoku [xdecow]The Ichimoku Kinko Hyo (Ichimoku Cloud) is a popular indicator / system.
In this version you will have a panel that shows the main signs of this system.
Each signal can have its status as bullish (weak, neutral or strong), consolidation and bearish (weak, neutral or strong).
Signals
Kijun-Sen Cross
Occurs when the price closes above/below the Kijun-sen.
Weak Bullish: Occurs below the Kumo.
Weak Bearish: Occurs above the Kumo.
Bullish/Bearish Neutral: Occurs inside the Kumo.
Strong Bullish: Occurs above the Kumo.
Strong Bearish: Occurs below the Kumo.
TK Cross
Occurs when the Tenkan-sen crosses the Kijun-sen.
Weak Bullish: Occurs when the crossing is below the Kumo.
Weak Bearish: Occurs when the crossing is above the Kumo.
Bullish/Bearish Neutral: Occurs when the crossing is inside the Kumo.
Strong Bullish: Occurs when the crossing is above the Kumo.
Strong Bearish: Occurs when the crossing is below the Kumo.
Chikou Span Cross
Occurs when the Chikou Span crosses the price.
Weak Bullish: Occurs when current price is below the Kumo.
Weak Bearish: Occurs when current price is above the Kumo.
Bullish/Bearish Neutral: Occurs when current price is inside the Kumo.
Strong Bullish: Occurs when current price is above the Kumo.
Strong Bearish: Occurs when current price is below the Kumo.
Kumo Breakout
Occurs when the price closes above/below the Kumo.
Kumo Twist
Occurs when the Senkou Span A crosses the Senkou Span B ahead.
Weak Bullish: Occurs when current price is below the Kumo.
Weak Bearish: Occurs when current price is above the Kumo.
Bullish/Bearish Neutral: Occurs when current price is inside the Kumo.
Strong Bullish: Occurs when current price is above the Kumo.
Strong Bearish: Occurs when current price is below the Kumo.
In addition, Senkou Span B turns golden when it is flat and the cloud is lighter when it is thin (default is half the average of the last 610).

Ichimoku Basic AlertsStarted with Ichimoku Kinko Hyo by Mizuki32. Converted to study and added alerting and cloud confirmation.
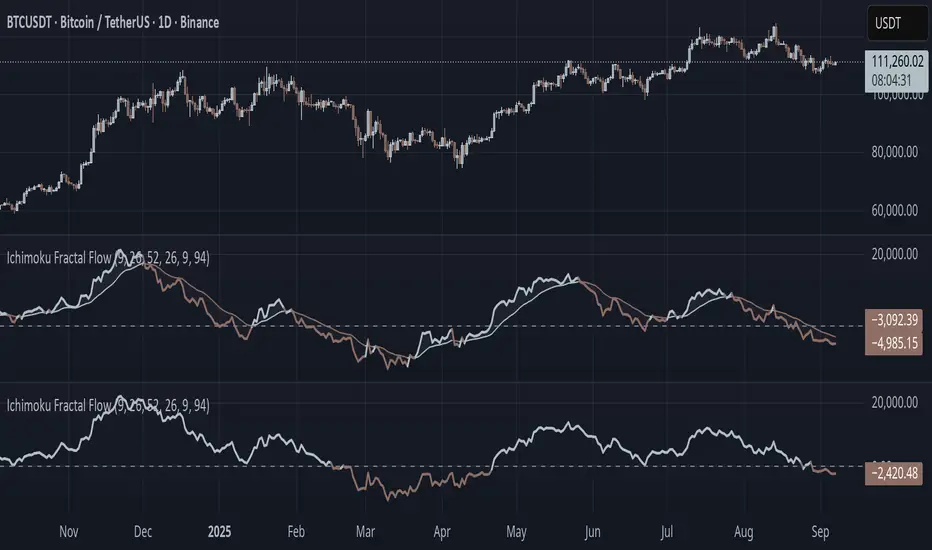
Ichimoku Fractal Flow### Ichimoku Fractal Flow (IFF)
By Gurjit Singh
Ichimoku Fractal Flow (IFF) distills the Ichimoku system into a single oscillator by merging fractal echoes of price and cloud dynamics into one flow signal. Instead of static Ichimoku lines, it measures the "flow" between Conversion/Base, Span A/B, price echoes, and cloud echoes. The result is a multidimensional oscillator that reveals hidden rhythm, momentum shifts, and trend bias.
#### 📌 Key Features
1. Fourfold Fusion – The oscillator blends:
* Phase: Tenkan vs. Kijun spread (short vs. medium trend).
* Kumo Phase: Span A vs. Span B spread (cloud thickness).
* Echo: Price vs lagged reflection.
* Cloud Echo: Price vs. projected cloud center.
2. Oscillator Output – A unified flow line oscillating around zero.
3. Dual Calculation Modes – Oscillator can be built using:
* High-Low Midpoint (classic Ichimoku-style averaging).
* Wilder’s RMA (smoother, less noisy averaging averaging).
4. Optional Smoothing – EMA or Wilder’s RMA creates a trend line, enabling MACD-style crossovers.
5. Dynamic Coloring – Bullish/Bearish color shifts for quick bias recognition.
6. Fill Styling – Highlighted regions between oscillator & smoothing line.
7. Zero Line Reference – Acts as a structural pivot (bull vs. bear).
#### 🔑 How to Use
1. Add to Chart: Works across all assets and timeframes.
2. Flow Bias (Zero Line):
* Above 0 → Bullish flow 🐂
* Below 0 → Bearish flow 🐻
3. With Signal Line:
* Oscillator above smoothing line → Possible upward trend shift.
* Oscillator below smoothing line → Possible downward trend shift.
4. Strength:
* Wide separation from smoothing = strong trend.
* Flat, tight clustering = indecision/range.
5. Contextual Edge: Combine signals with Ichimoku Cloud analysis for stronger confluence.
#### ⚙️ Inputs & Options
* Conversion Line (Tenkan, default 9)
* Base Line (Kijun, default 26)
* Leading Span B (default 52)
* Lag/Lead Shift (default 26)
* Oscillator Mode: High-Low Midpoint vs Wilder’s RMA
* Use Smoothing (toggle on/off)
* Signal Smoothing: Wilder/EMA option
* Smoothing Length (default 9)
* Bullish/Bearish Colors + Transparency
#### 💡 Tips
* Wilder’s RMA (both oscillator & smoothing) is gentler, reducing whipsaws in sideways markets.
* High-Low Mid captures pure Ichimoku-style ranges, good for structure-based traders.
* EMA reacts faster than RMA; use if you want early momentum signals.
* Zero-line flips act like momentum pivots—watch them near cloud boundaries.
* Signal line crossovers behave like MACD-style triggers.
* Strongest signals appear when oscillator, signal line, and Ichimoku Cloud all align.
👉 In short: Ichimoku Fractal Flow compresses multi-layered Ichimoku system into a single fractal oscillator that detects flow, pivotal shifts, and momentum with clarity—bridging price, cloud, and echoes into one signal. Where the cloud shows structure, IFF reveals the underlying flow. Together, they offer a fractal lens into market rhythm.
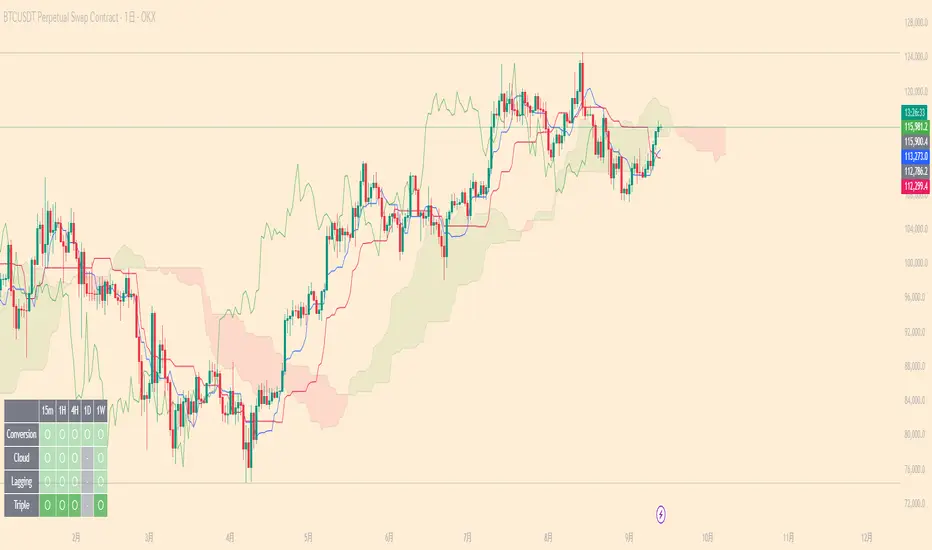
Ichimoku Multi-Timeframe Status[nakano]### Ichimoku Multi-Timeframe Status
---
#### Overview
This indicator is a sophisticated multi-timeframe analysis tool specializing in the "Sanyaku Kouten" (Three Bullish Signals) and "Sanyaku Gyakuten" (Three Bearish Signals) of the Ichimoku Kinko Hyo.
The status panel, displayed in the bottom-right corner of the screen, allows you to simultaneously monitor the Ichimoku conditions across up to eight different timeframes. This enables you to grasp the trend direction from short-term to long-term at a glance and helps you not to miss entry opportunities.
Through extensive trial, error, and debugging, the signal determination logic has been crafted to achieve a high degree of precision.
---
#### Key Features
1. **Multi-Timeframe Status Panel**
* **Monitor Multiple Timeframes at Once**: Displays the status of up to seven different timeframes (defaulting to 1m, 5m, 15m, 1h, 4h, 1D, and 1W) in a single list, in addition to the current chart's timeframe.
* **Detailed Status Display**: For each timeframe, it clearly displays whether the "Tenkan-sen," "Kumo (Cloud)," and "Chikou Span" components are in a "Bullish," "Bearish," or "— (Neutral)" state, color-coded for intuitive understanding.
* **Overall Judgment**: It comprehensively evaluates the state of each component to display a final signal of "Sanyaku Kouten" or "Sanyaku Gyakuten" in the panel.
2. **High-Precision Signal Logic**
* **Cloud Breakout**: Adopts a stricter logic, judging "Bullish" or "Bearish" breakouts only when the **real body** of the candlestick has completely broken out of the Kumo, not just the wicks.
* **Lagging Span (Chikou Span)**: Determines if the Chikou Span has clearly broken above/below the **real body** of the past candlestick. By consistently comparing it to the top/bottom of the real body, regardless of whether the candle is bullish or bearish, it captures more accurate signals.
* **Display Accuracy**: The common one-period display lag seen in many Ichimoku indicators for the Chikou Span and Kumo has been precisely corrected in both calculation and plotting.
3. **Alert Functionality**
* You can create TradingView alerts that trigger the moment a "Sanyaku Kouten" or "Sanyaku Gyakuten" is confirmed on the current timeframe. This allows you to receive notifications of opportunities without being tied to your chart.
4. **High Customizability**
* **Toggle Displays**: The status panel and the "Bullish"/"Bearish" labels on the chart can be easily toggled on or off from the settings menu. (Signal labels are off by default).
* **Complete Color Settings**: You can freely set the colors for all plotted elements, including the Tenkan-sen, Kijun-sen, Chikou Span, Kumo border lines, and Kumo background (for up and down clouds), allowing you to match your personal chart theme.
---
#### How to Use
1. **Add the indicator to your chart.**
2. **Open the settings menu.**
* **Display Settings**: Toggle the visibility of the on-chart signal labels and the status panel.
* **Timeframe Settings**: Freely configure up to seven timeframes you wish to monitor in the status panel.
* **Ichimoku Parameters**: Adjust the periods for the Tenkan-sen, Kijun-sen, etc., to fit your analysis.
* **Line Color Settings**: Customize the colors of the Ichimoku lines and the Kumo to your preference.
3. **Setting Up Alerts**
* Open the TradingView alert creation dialog.
* For "Condition," select this indicator (`Ichimoku Multi-Timeframe Status `).
* Choose either the "Sanyaku Kouten" or "Sanyaku Gyakuten" alert condition and configure your notification settings.
I hope this tool serves as a valuable aid in your market analysis and trading.
---
---
---
### Ichimoku Multi-Timeframe Status
---
#### 概要
このインジケーターは、一目均衡表の「三役好転・三役逆転」に特化した高機能なマルチタイムフレーム分析ツールです。
画面の右下に表示されるステータスパネルにより、最大8つの異なる時間足における一目均衡表の状況を同時に監視できます。これにより、短期から長期までのトレンドの方向性を一目で把握し、エントリーチャンスを逃しません。
多くの試行錯誤とデバッグを経て、シグナル判定のロジックは高い精度を持つように作り込まれています。
---
#### 主な機能
1. **マルチタイムフレーム・ステータスパネル**
* **複数時間足の一括監視**: 現在のチャートの足に加えて、最大7つの異なる時間足(デフォルトでは1分、5分、15分、1時間、4時間、日足、週足)の状況を一覧表示します。
* **詳細な状態表示**: 各時間足について、「転換線」「雲」「遅行スパン」の各要素が「好転」「逆転」「−(どちらでもない)」のいずれの状態にあるかを色付きで分かりやすく表示します。
* **総合判断**: 各要素の状態を総合的に判断し、最終的なシグナルとして「三役好転」または「三役逆転」をパネルに表示します。
2. **精度の高いシグナル判定ロジック**
* **雲抜け**: ローソク足のヒゲではなく、**実体が完全に雲を抜けた**場合のみ「好転」「逆転」と判定する、より厳密なロジックを採用しています。
* **遅行スパン**: 遅行スパンが、過去のローソク足の**実体**を明確に上抜け/下抜けしたかを判定します。陰線・陽線に関わらず、常に実体の上限/下限と比較するため、より正確なシグナルを捉えます。
* **表示の正確性**: 多くのインジケーターで見られる遅行スパンや雲の1期間の表示ズレを、計算と描画の両面で正確に補正しています。
3. **アラート機能**
* 現在のチャートの時間足で「三役好転」または「三役逆転」が成立した瞬間に、TradingViewのアラートを発生させることができます。これにより、チャンスを逃さず通知を受け取ることが可能です。
4. **高いカスタマイズ性**
* **表示の切り替え**: ステータスパネルや、チャート上に表示される「好転」「逆転」のラベルは、設定画面から表示/非表示を簡単に切り替えられます。(シグナルラベルはデフォルトで非表示)
* **完全なカラー設定**: 転換線、基準線、遅行スパン、雲の縁取り線、雲の背景色(上昇/下降)など、描画されるすべての要素の色を自由に設定でき、ご自身のチャートテーマに合わせることが可能です。
---
#### 使い方
1. **インジケーターをチャートに追加します。**
2. **設定画面を開きます。**
* **表示設定**: チャート上のシグナルラベルや、ステータスパネルの表示/非表示を切り替えます。
* **時間足設定**: ステータスパネルで監視したい時間足を最大7つまで自由に設定します。
* **一目均衡表パラメータ**: ご自身の分析に合わせて、転換線や基準線などの期間設定を変更できます。
* **ラインカラー設定**: チャートに表示される一目均衡表の各ラインや雲の色を、お好みの色にカスタマイズします。
3. **アラートの設定**
* TradingViewのアラート作成画面を開きます。
* 「条件」でこのインジケーター(`Ichimoku Multi-Timeframe Status `)を選択します。
* 「三役好転」または「三役逆転」のいずれかのアラート条件を選択し、通知設定を行ってください。
環境認識の補助ツールとして、皆様のトレードの一助となれば幸いです。
Ichimoku Cloud Crosses_AITIchimoku Cloud Crosser_AIT
The "Ichimoku Cloud Crosses_AIT" indicator is designed to leverage the Ichimoku Cloud components, focusing on the crossovers between the Tenkan-sen and Kijun-sen lines. This indicator visually displays these crossovers on the price chart to help traders identify potential long and short trading opportunities.
1. Indicator Components
Ichimoku Cloud Elements
Tenkan-sen (Conversion Line): A short-term trend indicator. It is the midpoint of the highest high and the lowest low over a specified period (tenkanLength). In this indicator, the default period is set to 21.
Kijun-sen (Base Line): A medium-term trend indicator. It is the midpoint of the highest high and the lowest low over the specified period (kijunLength). In this indicator, the default period is set to 120.
Senkou Span A and B: These components are part of the traditional Ichimoku Cloud, but they are not directly plotted in this version of the indicator.
Chikou Span (Lagging Span): This component is included in the calculation but is not plotted in this indicator version.
2. Signal Conditions
Long Signal
Condition: A long signal is generated when the Tenkan-sen crosses above the Kijun-sen.
Visual Representation: Displayed as a yellow triangle below the price bar.
Short Signal
Condition: A short signal is generated when the Tenkan-sen crosses below the Kijun-sen.
Visual Representation: Displayed as a fuchsia triangle above the price bar.
3. How to Use the Indicator
Add the Indicator: Apply the "Ichimoku Cloud Crosses_AIT" indicator to your chart in TradingView.
Adjust Parameters: You can customize the periods for the Tenkan-sen, Kijun-sen, Senkou Span A, Senkou Span B, and Chikou Span in the indicator's settings.
Interpret the Signals:
Long Signal: Look for a yellow triangle below the bar, indicating a potential bullish crossover (Tenkan-sen crossing above Kijun-sen).
Short Signal: Look for a fuchsia triangle above the bar, indicating a potential bearish crossover (Tenkan-sen crossing below Kijun-sen).
Conclusion
The "Ichimoku Cloud Crosses_AIT" indicator provides a clear visualization of the crossovers between the Tenkan-sen and Kijun-sen lines on the price chart. This tool helps traders quickly identify potential bullish and bearish signals, making it a valuable addition to any trading strategy. Adjust the settings and parameters as needed to fit your specific trading style and market conditions.

Ichimoku DoubleTF overlay
Hello guys, this code allow to overlay a second ichimoku over the first one loaded on the used time-frame.
It's simple.
Choose your preferred Time-frame.
Set the Time-frame for the second Ichimoku in the settings menu .
Now you can see two Ichimoku clouds based on two different time-frame.
It can be very usefull and more ordered of a multi-windows layout.
On second Ichimoku the Chikou-span is omitted 'cause i think that is useless and cumbersome.
To help to reading the graph i set two labels to identify the "2nds" tenkan and kijun.
Tell me if this script was useful and remember to follow me and adding a like.
Available combinations:
DAILY: WEEKLY AND MONTLY
4H: WEEKLY, DAILY
1H: WEEKLY, DAILY, 4H
30m: DAILY, 4H, 1H
15m: DAILY, 4H, 1H, 30m
5m: DAILY, 4H, 1H, 30m, 15m
3m: 1H, 30m, 15m
1m: 1H, 30m, 15m,5m,3min
Thanks, bhutano
*****************************************************************************************************
Ciao ragazzi, questo codice permette di sovrapporre un secondo Ichimoku a quello del time-frame utilizzato.
Scegliete il vostro time-frame preferito.
Impostate il time-frame del secondo Ichimoku dalle impostazioni dello script .
Adesso vedrete due Nuvole Ichimoku basati su due time-frame diversi.
Può essere davvero utile e più ordinato di un layout multi-window.
Sul secondo Ichimoku la Chickou è stata omessa perchè penso che sia inutile e ingombrante.
Per aiutare la lettura del grafico ho impostato due etichette per identificare le seconde tenkan e kijun.
Ditemi se questo script vi è stato utile e ricordatevi di seguirmi e aggiungere un mi piace.
Combinazioni possibili:
DAILY: WEEKLY AND MONTLY
4H: WEEKLY, DAILY
1H: WEEKLY, DAILY, 4H
30m: DAILY, 4H, 1H
15m: DAILY, 4H, 1H, 30m
5m: DAILY, 4H, 1H, 30m, 15m
3m: 1H, 30m, 15m
1m: 1H, 30m, 15m,5m,3min
Grazie, bhutano

Ichimoku RONIN [Lite]This Ichimoku is a Lite Edition of Ichimoku RONIN
Features :
- Ichimoku Default Lines
- Settings for Shift all of Lines
- Two Custom Periods Lines
- 9/26/52 Cycle Counter
- Optimized for Pine Script 5
- No Shifted Senko Span A Line
- New Cloud Alert
- KijunSen & TenkanSen Lines Crossed Alert
Good Trading to All ...

Ichimoku RONINA Full version of Ichimoku Kinko Hyo with many features ...
Features :
- Ichimoku Default Lines
- Settings for Shift all of Ichimoku Lines
- 52, 103, 108, 216 Periods Line
- Future TenkanSen, Kijunsen & Kumo Clouds
- 9/26/52 Cycle Counter
- Optimized for Pine Script 5

Ichimoku + 2 base linesIchimoku + 2 base line
This indicator is a combination of Ichimoku cloud indicator with two base lines.
The first base line is the same as the Ichimoku default settings but the baseline 2 indicates an average of 108 candles in the past and it acts as a strong support and resistance level.
How to use this indicator?
You can use this indicator to see if a break out is true or is a false break. For example if the price broke up the Ichimoku cloud and base line 2 is above the price, it will probably react to that area but if it's below the price, it is a good opportunity to buy. (for sell/short position it is in the opposite way the base line 2 should be above the price)
If you want to trade in support zones base line 2 (108) is a very good area that you can wait for a good candlestick pattern to enter a position.
Caution: before using this indicator please back test it and if the results were good enough, use it as a confirmation.

Ichimoku LiteIchimoku Kinko Hyo (often called Ichimoku Cloud) is a technical analysis method and trading system developed by Hosoda Goichi in 1935 and first published in 1975 under the pen-name Ichimoku Sanjin. The indicator shows the overall market state and reveals the equilibrium point of the price movement. The key idea of developing this indicator is to know the presence of the market. However, most of the default setting of this indicator is difficult to its elaborate visual presentation. Here, I modify the indicator by removing the lagging span and applying a lower color contrast of the cloud. This indicator can be combined with the turbulence indicator to provide a better confirmation of breakout signals.

Ichimoku ECC-11 As an IndicatorThis indicator is based on the famous ECC-11 strategy discussed on the Internet. It can be used on any timeframe, but ECC-11 is better suited for intraday 15min charts.
The various colour lines represent:
Black - Price
Orange - Chikou
Blue - Senkou A
Red - Senkou B
Green/Red - The Clouds
More information on how to follow the Ichimoku strategy can be found here:
www.investopedia.com
The main difference between the normal Ichimoku settings and ECC-11 are these ones are more sensitive by splitting them in half. Therefore beware sudden price change can be over amplified if you're used to the normal settings.
If you wish to have any changes, modifications or add some alerts please do not hesitate to message me.

Ichimoku with offset includedBased on the idea that some Donchian Channels in trading books have a lookback or offset of 1 in order to use it as a sort of trailing stop or so that the channels don't adjust. Ichimoku's Tenkan and Kijun lines have a very similar formula to Donchian Channels. In case anyone wants to use those lines as a sort of more fixed trailing stop, offset the Kijun, Tenkan, Span B, and/or treat it like Donchian Channels and such in the Ichimoku system, I included an offset of 1 as the default. To change this indicator to a standard regular looking Ichimoku, just change the offset value to 0.
The formula seems a bit different to what Tradingview has for their own version of Ichimoku but it's the same as many other programmers here. I made the colors as close to the traditional colors seen in books and other places and Tradingview as much as I could think of. Ichimoku has many different variations out there and to add the the confusion can have many different strategies to go with it. If you have any suggestions or tips, please let me know.
Ichimoku Cloud - AlertsIchimoku cloud
IC is a trend - following system with an indicator similar to moving averages
It predicts price movements
Offers a unique perspective of support and resistance levels.
Conversion Line (Turning Line)
- Measures Short Term Trend
- SIgnals an area of minor support and resistance
Base Line (Confirmation Line)
Measures Medium term trend
Used as Trailing Stop Level.
Lagging Span (Lagging Line)
Used for Confirmation of signals
Can also serve as Support and Resistance Level
Kumo Cloud
Formed of two lines: Span A (Green Line) and Span B (Red Line)
Dynamic Support and Resistance .
HOW TO READ ICHIMOKU INDICATOR
Conversion Line
If the Market Price is above the Conversion Line = Short Term Upward Movement
If the Market Price is below the Conversion Line = Short Term Downward Movement
Increasing Conversion Line = Upward Short Term Trend
Decreasing Conversion Line = Downward Short Term Trend
Base Line
If the Market Price is above the baseline = Medium - term upward trend
If the Market price is below the baseline = Medium - Term downward Trend
Increasing Base Line = Upward Medium term trend
Decreasing Base Line = Downward Medium Term Trend
Lagging Span
The Evolution of the current price action in relation to previous price action
If the Lagging span is above the current price = Bullish Bias
If the Lagging span is below the current price = Bearish Bias
Lagging span near the current price = Trading range
Kumo Cloud
Dynamic Support and Resistance based upon price action.
The longer the price stays below/above the Kumo cloud, the STRONGER the trend is.
When the cloud is wide, the expected support or resistance is strong
When the cloud is thin, the expected support or resistance is weak
Never trade inside the KUMO CLOUD.
HOW TO TRADE WITH ICHIMOKU CLOUD
Baseline and conversion Line crossover (Lagging Span as a Filter)
crossover(conversion line, baseline) = Buy
crossunder(conversion line, baseline) = Sell
FILTER
crossover(conversion line, baseline) and lagging span is Bullish (i.e above the price) = Buy
Crossunder(conversion line, baseline) and lagging span is Bearish (i.e below the price) = Sell
2. Baseline - Conversion line crossover (Kumo cloud Filter)
crossover(conversion line, baseline) above the Kumo Cloud = Strong Buy
crossover(conversion line, baseline) below the Kumo cloud = Weak Buy
crossunder(conversion line, baseline) below the Kumo Cloud = Strong Sell
crossunder(conversion line, baseline) above the Kumo Cloud = Weak Sell
3. Kumo Cloud Breakout
When the price enters the Kumo Cloud, and breaks its Upper wall upward = Bullish Signal
When the price enters the Kumo Cloud, and breaks its Lower wall downward = Bearish Signal
4. Kumo Cloud Crossover
When Span A cuts the Span B from below to the upside and prices are positioned above the Kumo Cloud = Strong Buy Signal
When Span A cuts the Span B from upside to the bottom and the prices are positioned below the Kumo Cloud = Strong Sell
When Span A cuts Span B from bottom to the upside and prices are positioned below the Kumo Cloud = Weak Buy Signal
When Span A cuts Span B from the upside to the bottom and the prices are positioned above the Kumo Cloud = Weak Sell Signal.
NOTE:- Some of the signals collide with each other, but they collide for the same call, so shouldn't really be a problem overall. Let me know if you have any suggestions to nullify the trading Range. Though I do plan on adding my Renko code to it for filtering out Trading Range.

Ichimoku ATR Oscillator// An oscillator that visualizes Ichimoku trend line distances in terms of ATR.
// Public Domain
// By JollyWizard
