"ichimoku" için komut dosyalarını ara
Ichimoku Cloud OscillatorThe script looks at how far the price is below or above the ichimoku cloud, and publishes an oscillator.
Low or high oscillator values are indicative of reversals, to assist with long or short entry decisions.

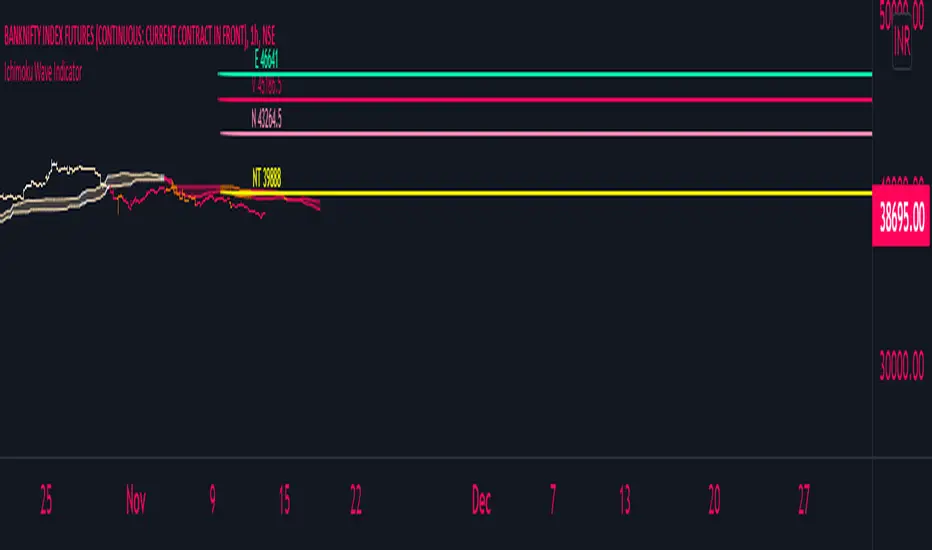
Ichimoku with Waves Created in 1940's by Goichi Hosoda withe the help of University students in Japan.
Ichimoku is one of the best trend following indicators that works nearly perfect in all markets and time frames.
Fill price in setup of indicator and you will find potential target zone of the wave
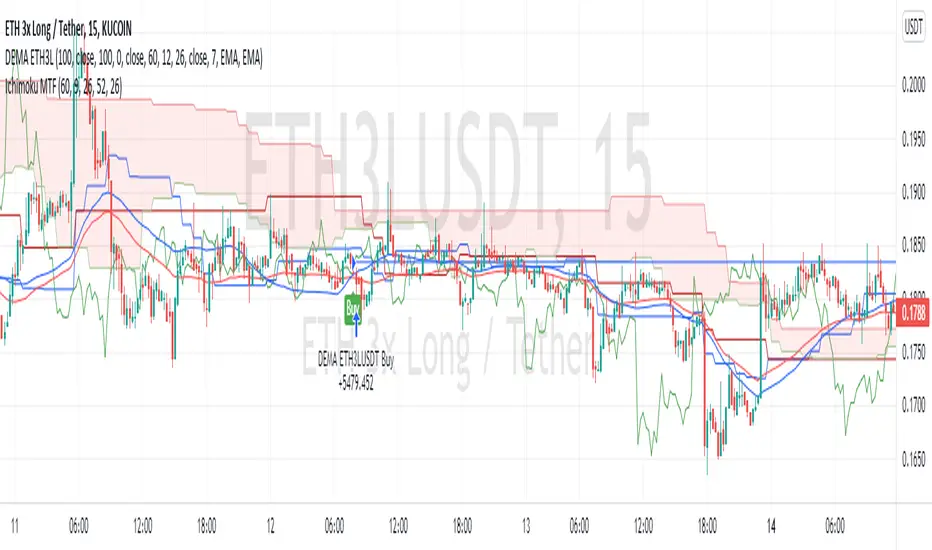
Ichimoku by TESA script created to indentify all the trading signals for Ichimoku cloud trading.
You can trade the following:
- Kumo breakout
- LONG positions, shown by "L" in 3 different signal strengths. Red = weak, Yellow = medium and Green = Strong trade
- SHORT positions, shown by "S" in 3 different signal strengths. Red = weak, Yellow = medium and Green = Strong trade
Happy trading

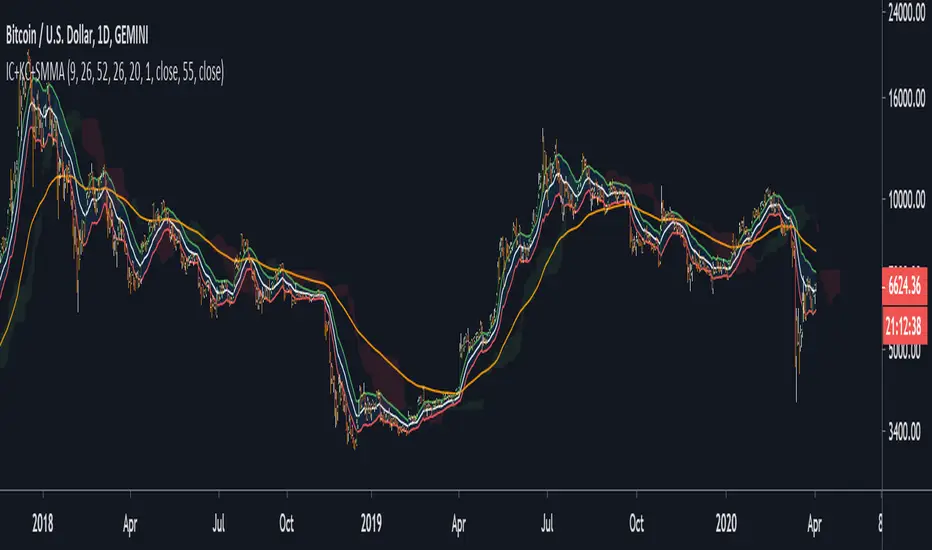
Ichimoku Cloud + keltner channel + SMMAa combo of
Ichimoku Cloud + keltner channel + SMMA
have fun, come up with your strategy
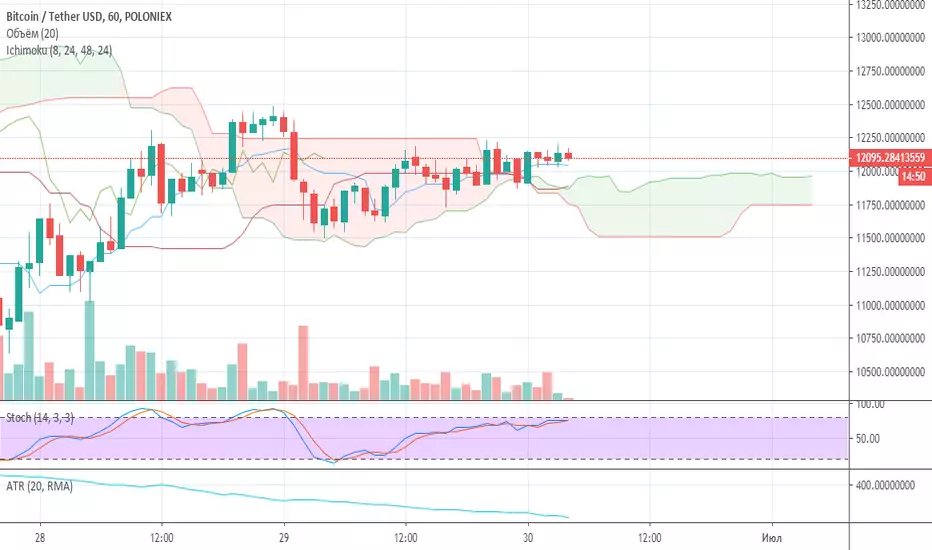
Ichimoku Cloud (for 1 hour period)Simple modification of standart Ichimoku Cloud indicator. Special for 1 hour period.
ICHimoku with ema cross and mostthis is for free users, ichi and most and 20-55 volumeweighted ma
//ichimoku
doubled original one for better results, only use cloud and kijun, unclick others
//most
its a good trailing stop loss indicator, please select 8 to 1 in settings for good results and vwma
how to use it: when most is green buy slowly
when most is fuschia sell and wait untill turn to green
its very useful indicator all time frames
//ema cross
i always use ema 20 and ema 55 for godd results
please use 4h or 8h not to have too mant entry and exit otherwise u can miss the trends

Ichimoku OverlaysHello!
Here is a script I wrote awhile ago. Basically the Ichmoku Overlays script takes the Ichimoku Cloud indicator and adds 4 timeframes to it.
Timeframes include multiples of 1, 3, 5, 10, 15. So basically if your interval timeframe is set to 1D you will see 1D, 3D, 5D, 10D, and 15D clouds. If you TF is set to 1m you will see 1m, 3m, 5m, 10m, 15m, etc.
The specific timeframe visibility can be set on/off in settings.
The purpose of this script is to show support/resistance zones in areas you might not see if you don't have the correct timeframe on.
Please feel free to PM me if you have any questions or suggestions!
Tips are welcome and can be sent to:
- BTC : 34dGv2EAxJ7HVpoAZHXg8RDKaX7KGCVUUW
- EOS : jwlondon1234
Enjoy!


Ichimoku & 2 BB & Multi MA (Ribbon) by Theo ParkThis indicator contains :
Ichimoku
2 Bollinger Bands
6 Moving Averages
and multiple Ribbon MAs.

Ichimoku + Death/Golden Cross + MAsSwiss-army knife indicator for traders. Renders Ichimoku and MAs (short term and long term). Also points Death Cross and Golden Cross formations on 5/10 MA.


Ichimoku Signal + Candle Color + Candle Pattern1. Ichimoku Signal:
Bullish Signal:
- UP-S: A strong bullish signal occurs when the Tenkan Sen crosses from below to above the Kijun Sen and the cross is above the Kumo.
- UP: An neutral bullish signal occurs when the Tenkan Sen crosses from below to above the Kijun Sen and the cross is in the Kumo.
- UP-W: A weak bullish signal occurs when the Tenkan Sen crosses from below to above the Kijun Sen and the cross is bellow the Kumo.
- Fly: A strong bullish signal when Chikou Span raise above the Kumo.
Bearish Signal:
- DN-S: A strong bearish signal occurs when the Tenkan Sen crosses from above to bellow the Kijun Sen and the cross is bellow the Kumo.
- DN: An neutral bearish signal occurs when the Tenkan Sen crosses from above to bellow the Kijun Sen and the cross is in the Kumo.
- DN-W: A weak bearish signal occurs when the Tenkan Sen crosses from above to bellow the Kijun Sen and the cross is above the Kumo.
- Dig: A strong bearish signal when Chikou Span fall bellow the Kumo.
2. Candle Color based on RSI (from NazcaProjections)
- Yellow represents Super OverBought
- Lime Green represents OverBought
- Green represents Slightly OverBought
- Red represents Slightly OverSold
- Dark Red represents OverSold
- Gray White represents Super OverSold
3. Candlestick Patterns Identified: Doji , Evening Star , Morning Star , Shooting Star , Hammer , Inverted Hammer , Bearish Harami, Bullish Harami, Bearish Engulfing , Bullish Engulfing


Ichimoku Cloud with Josh Olszewicz Crpyto Adjusted SettingsThis Ichimoku Cloud has the settings adjusted as described in Josh Olszewicz's Video here: www.youtube.com

Divergence-Weighted clouds V 1.0Comprehensive Introduction to Divergence-Weighted Clouds V 1.0 (DW)
In financial markets, the analysis of volume and price plays a fundamental role in identifying trends, reversals, and making trading decisions. Volume indicates the level of market interest and liquidity focused on an asset, while price reflects changes in supply and demand. Alongside these two elements, market volatility, support and resistance levels, and cash flow are also critical factors that help analysts form a comprehensive view of the market. The Divergence-Weighted Clouds V 1.0 (DW) indicator is designed to simultaneously analyze these fundamental elements and other important market dynamics. To achieve this, it utilizes data generated from 13 distinct indicators, each measuring specific aspects of the market:
Trend and Momentum: Analyzing the direction and strength of price movements.
Volume and Cash Flow: Understanding the inflow and outflow of capital in the market.
Oscillators: Identifying overbought and oversold conditions.
Support and Resistance Levels: Highlighting key price levels.
The Core Challenge: Standardizing Diverse Data
The primary challenge lies in the fact that the outputs of these indicators differ significantly in scale and meaning. For example:
Volume often generates very large values (e.g., millions of shares).
Oscillators provide data within fixed ranges (e.g., 0 to 100).
Price-based metrics may vary in entirely different scales (e.g., tens or hundreds of units).
These differences make direct comparison of the data impractical. The DW indicator resolves this challenge through an advanced mathematical methodology:
Normalization and Hierarchical Evaluation:
To standardize the data, a process called hierarchical EMA evaluation is employed. Initially, the raw outputs of each indicator are computed over different timeframes using Exponential Moving Averages (EMA) based on prime-number intervals.
Hierarchical Scoring:
A pyramid-like structure is used to evaluate the performance of each indicator. This method examines the relationships and distances between EMAs for each indicator and assigns a numerical score.
Final Integration and Aggregation:
The scores of all 13 indicators are then mathematically aggregated into a single number. This final value represents the overall market performance at that moment, enabling a unified interpretation of volume, price, and volatility.
-------------------------------------------------------------------------------------------------
Indicators Used in DW
To achieve this comprehensive analysis, DW leverages 13 carefully selected indicators, each offering unique insights into market dynamics:
Trend and Momentum
- ALMA (Arnaud Legoux Moving Average): Reduces lag for faster trend identification.
- Aroon Up: Analyzes the stability of uptrends.
- ADX (Average Directional Index): Measures the strength of a trend.
Volume and Cash Flow
- CMF (Chaikin Money Flow): Identifies cash flow based on price and volume.
- EFI (Elder’s Force Index): Evaluates the strength of price changes alongside volume.
- Volume Delta: Tracks the balance between buying and selling pressure.
- Raw Volume: Analyzes unprocessed volume data.
Oscillators
- Fisher Transform: Normalizes data to detect price reversals.
- MFI (Money Flow Index): Identifies overbought and oversold levels.
Support, Resistance, and Price Dynamics
- Ichimoku Lines (Tenkan-sen & Kijun-sen): Analyzes support and resistance levels.
- McGinley Dynamic: Minimizes errors caused by rapid price movements.
- Price Hierarchy: Evaluates the relative position of prices across timeframes.
-------------------------------------------------------------------------------------------------
Example: Hierarchical Scoring for Price Analysis
To illustrate how the DW indicator processes data, let’s take the price as an example and analyze it using the first four prime numbers (2, 3, 5, and 7) as intervals for Exponential Moving Averages (EMAs). This example will demonstrate how the indicator evaluates price relationships and assigns a hierarchical score.
Step-by-Step Calculation:
1. Raw Data:
Let’s assume the closing prices for a specific asset over recent days are as follows:
Day 1: 100
Day 2: 102
Day 3: 101
Day 4: 104
Day 5: 103
Day 6: 105
Day 7: 106
2. Calculate EMAs for Prime Number Intervals:
Using the prime-number intervals (2, 3, 5, 7), we calculate the EMAs for these timeframes:
EMA(2): Averages the last 2 closing prices equal to 105.33
EMA(3): Averages the last 3 closing prices equal to 104.25
EMA(5): Averages the last 5 closing prices equal to 103.17
EMA(7): Averages the last 7 closing prices equal to 102.67
3. Compare EMAs Hierarchically:
To assign a score, the relationships between the EMAs are analyzed hierarchically. We evaluate whether each smaller EMA is greater or less than the larger ones:
Compare EMA(2) to EMA(3), EMA(5), and EMA(7):
EMA(2) > EMA(3):105.33>104.25 => +1
EMA(2) > EMA(5): 105.33>103.17 => +1
EMA(2) > EMA(7): 105.33 > 102.67 => +1
Compare EMA(3) to EMA(5) and EMA(7):
EMA(3) > EMA(5) : 104.25>103.17 => +1
EMA(3) > EMA(7):104.25 >102.67 => +1
Compare EMA(5) to EMA(7):
EMA(5) > EMA(7):103.17>102.67 => +1
Assign a Score:
Each positive comparison adds +1 to the score. In this example:
Total Score for Price = 1+1+1+1+1+1+1=6
-------------------------------------------------------------------------------------------------
Logic Behind Scoring:
The score reflects the "steepness" or "hierarchy" of price movement across different timeframes:
A higher score indicates that shorter EMAs are consistently above longer ones, signaling a strong upward trend.
A lower score or negative values would indicate the opposite (e.g., short-term prices lagging behind long-term averages, signaling weakness or potential reversal).
This method ensures that even complex data points (like price, volume, or oscillators) can be distilled into a single, comparable numerical value. When repeated across all 13 indicators, it enables the DW indicator to create a unified, normalized score that represents the overall market condition.
-------------------------------------------------------------------------------------------------
Settings and Customization in Divergence-Weighted Clouds V 1.0 (DW)
The Divergence-Weighted Clouds V 1.0 (DW) indicator provides extensive customization options to empower traders to fine-tune the analysis according to their specific needs and trading strategies. Each of the 13 indicators is fully customizable through the settings menu, allowing adjustments to parameters such as lookback periods, sensitivity, and calculation methods. This flexibility ensures that DW can adapt seamlessly to a wide range of market conditions and asset classes.
Key Features of the Settings Menu
1. Global Settings:
Lookback Periods: Define the timeframe for data aggregation and analysis across all indicators.
Normalization Settings: Adjust parameters to refine the process of scaling diverse outputs to a comparable range.
Divergence Sensitivity: Control the weight given to indicators deviating from the average, enabling a focus on outliers or broader trends.
2. Indicator-Specific Settings:
Each of the 13 indicators has its own dedicated section in the settings menu for precise customization. Examples include:
ALMA (Arnaud Legoux Moving Average):
Window Size: Set the number of bars used for calculating the average.
Offset: Control the sensitivity of trend detection.
Sigma: Adjust the smoothing factor for the calculation.
Aroon Up:
Length: Modify the lookback period for identifying highs and evaluating uptrends.
ADX (Average Directional Index):
DI Length: Specify the period for calculating directional indicators (DI).
ADX Smoothing: Adjust the smoothing period for trend strength analysis.
3. Oscillator Settings:
Fisher Transform:
Length: Customize the period for normalization and detecting reversals.
Money Flow Index (MFI):
Length: Set the timeframe for analyzing overbought and oversold conditions.
4. Volume and Cash Flow Settings:
Chaikin Money Flow (CMF):
Length: Define the period for analyzing cash flow based on price and volume.
Volume Delta:
Timeframe: Select a custom timeframe for analyzing buying and selling pressure.
5. Support and Resistance Settings:
In the Support and Resistance category of the DW indicator, we address the logic behind four components:
McGinley Dynamic
Price Hierarchy
Base Line
Conversion Line
The settings structure for this section primarily focuses on McGinley Dynamic, while the other three elements—Price Hierarchy, Base Line, and Conversion Line—operate based on predefined values derived from the mathematical structure and logic of the DW indicator. Let’s explore this in detail:
McGinley Dynamic
Length: The only customizable setting in this category. Users can adjust the length parameter to tailor the responsiveness of the McGinley Dynamic to different market conditions. McGinley Dynamic adapts dynamically to the speed of price changes, reducing lag and minimizing false signals. Its flexibility allows it to serve as both a trendline and a support/resistance guide.
Price Hierarchy
The Price Hierarchy component in DW leverages a pyramid structure and triangular scoring based on prime-number intervals (e.g., 2, 3, 5, 7). This methodology ensures a mathematically robust framework for evaluating the relative position of prices across multiple timeframes.
Why No Settings for Price Hierarchy?
The unique properties of prime numbers make them ideal for constructing this hierarchical scoring system. Changing these intervals would compromise the integrity of the calculations, as they are specifically designed to ensure precision and consistency. Therefore, no customization is allowed for this component in the settings menu.
Conversion Line and Base Line
The Conversion Line (Tenkan-sen) and Base Line (Kijun-sen) are integral components derived from DW’s scoring methodology and represent short-term and medium-term equilibrium levels, respectively. These lines are calculated using the Ichimoku framework, which provides a reliable and well-recognized mathematical basis:
Conversion Line: The average of the highest high and lowest low over a fixed period of 9 bars.
Base Line: The average of the highest high and lowest low over a fixed period of 26 bars./list]
Both lines are utilized in DW as part of the 13 generated indicator variables to assess market equilibrium.
Why Default Values for Conversion and Base Lines?
These values are fixed to the default Ichimoku parameters to:
- Ensure consistency with the broader Ichimoku logic for users familiar with its methodology.
- Prevent confusion in the settings menu, as customization of these parameters is unnecessary for DW’s scoring system.
Important Note: While these lines are derived using Ichimoku logic, they are not standalone Ichimoku components but are embedded into DW’s mathematical structure. In the next section, we will elaborate on how the Ichimoku framework is employed for the graphical visualization of DW’s calculations.
Displaying the Results of 13 Indicator Integration in DW Indicator
The Divergence-Weighted Clouds V 1.0 (DW) employs a rigorous methodology to integrate 13 distinct indicators into a single, normalized output. Here's how the process works, followed by an explanation of the visualization strategy leveraging Ichimoku logic.
Simultaneous Evaluation of 13 Indicators
1. Mathematical Integration Logic:
Normalization: The outputs of all 13 indicators (e.g., ALMA, ADX, CMF) are normalized into comparable ranges, ensuring compatibility despite their diverse scales.
Hierarchical Scoring with Prime Intervals: For each indicator, Exponential Moving Averages (EMAs) are calculated using prime-number intervals (e.g., 2, 3, 5, 7). These EMAs are evaluated through a triangular scoring system, creating individual scores for each indicator.
Divergence Weighting: Indicators showing significant divergence from group averages are given higher weights, amplifying their influence on the final score.
2. Unified Score Calculation:
The normalized and weighted outputs of all 13 indicators are aggregated into a single score.
This score represents the overall behavior of the market, based on the simultaneous evaluation of trend, volume, oscillators, and price metrics.
------------------------------------------------------------------------------------------
Challenge of Visualizing Results
The next challenge lies in effectively visualizing the score to make it actionable for traders. The DW indicator resolves this challenge by leveraging the Ichimoku framework.
Why Ichimoku for Visualization?
The Ichimoku system is known for its clear and predictive visualization capabilities, making it ideal for representing DW’s complex calculations:
1. Cloud-Based Display: Ichimoku Clouds (Kumo) are intuitive for identifying equilibrium zones and future price movements.
2. Projection Ability: The forward-projected Leading Spans (Senkou A and B) provide predictive insights based on past and current data.
3. Trader Familiarity: Ichimoku is widely recognized, reducing the learning curve for users.
Implementation of Ichimoku Logic
1. Mapping Score to Price:
The score is normalized and mapped to price using a scale factor, ensuring alignment with price data while preserving DW’s analytical integrity.
2. Ichimoku Cloud Lines:
Conversion Line (Tenkan-sen): Short-term equilibrium based on the score, calculated using a 9-period high-low average.
Base Line (Kijun-sen): Medium-term equilibrium calculated using a 26-period high-low average.
Leading Spans (Senkou A & B):
- Senkou A: Average of the Conversion and Base Lines.
- Senkou B: High-low average over a 52-period window.
Lagging Span (Chikou): Unlike traditional Ichimoku, DW’s Lagging Span reflects the Nebula Score shifted backward, providing a historical perspective on combined indicator behavior
3. Cloud Dynamics:
The Kumo Cloud is filled based on the relative position of Senkou A and Senkou B, using color shading to distinguish bullish and bearish conditions.
------------------------------------------------------------------------------------------
Customization in Computational Settings
The core computational components of DW allow some customization for sensitivity adjustments:
Divergence Sensitivity: Controls the weight assigned to indicators with higher divergence.
Volatility Normalization: Adjusts the lookback period for volatility adjustments, refining the Nebula Score scaling.
------------------------------------------------------------------------------------------
Advantages of Using Ichimoku Logic
1. Predictive Visualization:
The forward-projected cloud provides actionable insights for identifying trends and reversals earlier than traditional Ichimoku.
2. Aligned Lagging Span:
DW’s Lagging Span represents the normalized evaluation of all 13 indicators, offering a unique perspective beyond just closing price.
3. Intuitive Interpretation:
Traders familiar with Ichimoku can easily interpret DW’s outputs, making it accessible and effective.
Conclusion
By combining rigorous mathematical evaluation with Ichimoku’s visualization strengths, DW provides traders with a clear, actionable representation of market conditions. This ensures that the complex integration of 13 indicators is not only analytically robust but also visually intuitive.
------------------------------------------------------------------------------------------
Comparison Between Divergence-Weighted Clouds V 1.0 (DW) and Traditional Ichimoku: NVIDIA 4H Chart
The chart showcases a side-by-side comparison of the Divergence-Weighted Clouds V 1.0 (DW) indicator (on the left) and the Traditional Ichimoku indicator (on the right). This comparison highlights the differences in how the two indicators interpret market trends and project equilibrium zones using their respective methodologies.
Key Observations and Insights
1. Base and Conversion Line Movements:
On Thursday, November 21, 2024, 17:30, in the DW indicator (left chart), the Base Line crosses above the Conversion Line, signaling a shift in medium-term equilibrium relative to short-term equilibrium.
On the Traditional Ichimoku (right chart), this crossover is not reflected until Monday, November 25, 2024, 17:30, occurring 4 days later.
Significance:
The DW indicator identifies the crossover and equilibrium shift significantly earlier due to its ability to process and normalize data from 13 distinct indicators.
This predictive capability provides traders with earlier insights, enabling them to anticipate changes and adjust their strategies proactively.
2. Cloud Dynamics and Leading Spans:
In both charts, the cloud (Kumo) represents the equilibrium and potential support/resistance zones.
The DW indicator’s Leading Span A and Leading Span B react faster to market changes, creating a more responsive and forward-looking cloud compared to the traditional Ichimoku.
Example:
On the DW chart (left), the cloud begins shifting to reflect the crossover earlier, signaling potential future support/resistance levels.
In the Ichimoku chart (right), the cloud reacts more slowly, lagging behind the DW indicator.
3. Lagging Span (Chikou Line):
In the DW indicator, the Lagging Span is based on the normalized output of the 13 indicators, reflecting their aggregated behavior rather than just the closing price shifted backward as in the traditional Ichimoku.
This provides a unique perspective on past market strength, aligning the Lagging Span more closely with the overall market condition derived from DW’s computations.
4. Price Alignment:
In the DW indicator, all normalized scores and values are mapped to align with price action, ensuring that the visualization remains intuitive while incorporating complex calculations.
------------------------------------------------------------------------------------------
Advantages of DW Over Traditional Ichimoku
1.Earlier Signal Detection:
As demonstrated by the Base and Conversion Line crossover, DW detects changes in market equilibrium 4 days earlier, giving traders a significant advantage in anticipating price movements.
2. Enhanced Predictive Power:
The Leading Spans in DW’s cloud react faster, providing clearer forward-looking support and resistance zones compared to the traditional Ichimoku.
3. Comprehensive Data Integration:
While the Ichimoku relies solely on price-based calculations, DW integrates outputs from 13 distinct indicators, offering a more robust and comprehensive analysis of market conditions.
4. Alignment with Market Behavior:
The DW Lagging Span reflects the aggregated score of multiple indicators, aligning more closely with overall market sentiment and providing a deeper context than the price-based Lagging Span in Ichimoku.
------------------------------------------------------------------------------------------
Final Note
The chart comparison illustrates how the Divergence-Weighted Clouds V 1.0 (DW) indicator outperforms traditional Ichimoku in terms of signal responsiveness and predictive accuracy. By combining the mathematical rigor of DW’s calculations with the visual clarity of Ichimoku, traders gain a powerful tool for analyzing market trends and making informed decisions.
Look at the DW chart (left) to see how early signals and cloud adjustments provide actionable insights compared to the slower reactions of the Traditional Ichimoku chart (right).

SUPERTREND MIXED ICHI-DMI-DONCHIAN-VOL-GAP-HLBox@RLSUPERTREND MIXED ICHI-DMI-VOL-GAP-HLBox@RL
by RegisL76
This script is based on several trend indicators.
* ICHIMOKU (KINKO HYO)
* DMI (Directional Movement Index)
* SUPERTREND ICHIMOKU + SUPERTREND DMI
* DONCHIAN CANAL Optimized with Colored Bars
* HMA Hull
* Fair Value GAP
* VOLUME/ MA Volume
* PRICE / MA Price
* HHLL BOXES
All these indications are visible simultaneously on a single graph. A data table summarizes all the important information to make a good trade decision.
ICHIMOKU Indicator:
The ICHIMOKU indicator is visualized in the traditional way.
ICHIMOKU standard setting values are respected but modifiable. (Traditional defaults = .
An oriented visual symbol, near the last value, indicates the progression (Ascending, Descending or neutral) of the TENKAN-SEN and the KIJUN-SEN as well as the period used.
The CLOUD (KUMO) and the CHIKOU-SPAN are present and are essential for the complete analysis of the ICHIMOKU.
At the top of the graph are visually represented the crossings of the TENKAN and the KIJUN.
Vertical lines, accompanied by labels, make it possible to quickly visualize the particularities of the ICHIMOKU.
A line displays the current bar.
A line visualizes the end of the CLOUD (KUMO) which is shifted 25 bars into the future.
A line visualizes the end of the chikou-span, which is shifted 25 bars in the past.
DIRECTIONAL MOVEMENT INDEX (DMI) : Treated conventionally : DI+, DI-, ADX and associated with a SUPERTREND DMI.
A visual symbol at the bottom of the graph indicates DI+ and DI- crossings
A line of oriented and colored symbols (DMI Line) at the top of the chart indicates the direction and strength of the trend.
SUPERTREND ICHIMOKU + SUPERTREND DMI :
Trend following by SUPERTREND calculation.
DONCHIAN CHANNEL: Treated conventionally. (And optimized by colored bars when overshooting either up or down.
The lines, high and low of the last values of the channel are represented to quickly visualize the level of the RANGE.
SUPERTREND HMA (HULL) Treated conventionally.
The HMA line visually indicates, according to color and direction, the market trend.
A visual symbol at the bottom of the chart indicates opportunities to sell and buy.
VOLUME:
Calculation of the MOBILE AVERAGE of the volume with comparison of the volume compared to the moving average of the volume.
The indications are colored and commented according to the comparison.
PRICE: Calculation of the MOBILE AVERAGE of the price with comparison of the price compared to the moving average of the price.
The indications are colored and commented according to the comparison.
HHLL BOXES:
Visualizes in the form of a box, for a given period, the max high and min low values of the price.
The configuration allows taking into account the high and low wicks of the price or the opening and closing values.
FAIR VALUE GAP :
This indicator displays 'GAP' levels over the current time period and an optional higher time period.
The script takes into account the high/low values of the current bar and compares with the 2 previous bars.
The "gap" is generated from the lack of overlap between these bars. Bearish or bullish gaps are determined by whether the gap is above or below HmaPrice, as they tend to fill, and can be used as targets.
NOTE: FAIR VALUE GAP has no values displayed in the table and/or label.
Important information (DATA) relating to each indicator is displayed in real time in a table and/or a label.
Each information is commented and colored according to direction, value, comparison etc.
Each piece of information indicates the values of the current bar and the previous value (in "FULL" mode).
The other possible modes for viewing the table and/or the label allow a more synthetic view of the information ("CONDENSED" and "MINIMAL" modes).
In order not to overload the vision of the chart too much, the visualization box of the RANGE DONCHIAN, the vertical lines of the shifted marks of the ICHIMOKU, as well as the boxes of the HHLL Boxes indicator are only visualized intermittently (managed by an adjustable time delay ).
The "HISTORICAL INFO READING" configuration parameter set to zero (by default) makes it possible to read all the information of the current bar in progress (Bar #0). All other values allow to read the information of a historical bar. The value 1 reads the information of the bar preceding the current bar (-1). The value 10 makes it possible to read the information of the tenth bar behind (-10) compared to the current bar, etc.
At the bottom of the DATAS table and label, lights, red, green or white indicate quickly summarize the trend from the various indicators.
Each light represents the number of indicators with the same trend at a given time.
Green for a bullish trend, red for a bearish trend and white for a neutral trend.
The conditions for determining a trend are for each indicator:
SUPERTREND ICHIMOHU + DMI: the 2 Super trends together are either bullish or bearish.
Otherwise the signal is neutral.
DMI: 2 main conditions:
BULLISH if DI+ >= DI- and ADX >25.
BEARISH if DI+ < DI- and ADX >25.
NEUTRAL if the 2 conditions are not met.
ICHIMOKU: 3 main conditions:
BULLISH if PRICE above the cloud and TENKAN > KIJUN and GREEN CLOUD AHEAD.
BEARISH if PRICE below the cloud and TENKAN < KIJUN and RED CLOUD AHEAD.
The other additional conditions (Data) complete the analysis and are present for informational purposes of the trend and depend on the context.
DONCHIAN CHANNEL: 1 main condition:
BULLISH: the price has crossed above the HIGH DC line.
BEARISH: the price has gone below the LOW DC line.
NEUTRAL if the price is between the HIGH DC and LOW DC lines
The 2 other complementary conditions (Datas) complete the analysis:
HIGH DC and LOW DC are increasing, falling or stable.
SUPERTREND HMA HULL: The script determines several trend levels:
STRONG BUY, BUY, STRONG SELL, SELL AND NEUTRAL.
VOLUME: 3 trend levels:
VOLUME > MOVING AVERAGE,
VOLUME < MOVING AVERAGE,
VOLUME = MOVING AVERAGE.
PRICE: 3 trend levels:
PRICE > MOVING AVERAGE,
PRICE < MOVING AVERAGE,
PRICE = MOVING AVERAGE.
If you are using this indicator/strategy and you are satisfied with the results, you can possibly make a donation (a coffee, a pizza or more...) via paypal to: lebourg.regis@free.fr.
Thanks in advance !!!
Have good winning Trades.
**************************************************************************************************************************
SUPERTREND MIXED ICHI-DMI-VOL-GAP-HLBox@RL
by RegisL76
Ce script est basé sur plusieurs indicateurs de tendance.
* ICHIMOKU (KINKO HYO)
* DMI (Directional Movement Index)
* SUPERTREND ICHIMOKU + SUPERTREND DMI
* DONCHIAN CANAL Optimized with Colored Bars
* HMA Hull
* Fair Value GAP
* VOLUME/ MA Volume
* PRIX / MA Prix
* HHLL BOXES
Toutes ces indications sont visibles simultanément sur un seul et même graphique.
Un tableau de données récapitule toutes les informations importantes pour prendre une bonne décision de Trade.
I- Indicateur ICHIMOKU :
L’indicateur ICHIMOKU est visualisé de manière traditionnelle
Les valeurs de réglage standard ICHIMOKU sont respectées mais modifiables. (Valeurs traditionnelles par défaut =
Un symbole visuel orienté, à proximité de la dernière valeur, indique la progression (Montant, Descendant ou neutre) de la TENKAN-SEN et de la KIJUN-SEN ainsi que la période utilisée.
Le NUAGE (KUMO) et la CHIKOU-SPAN sont bien présents et sont primordiaux pour l'analyse complète de l'ICHIMOKU.
En haut du graphique sont représentés visuellement les croisements de la TENKAN et de la KIJUN.
Des lignes verticales, accompagnées d'étiquettes, permettent de visualiser rapidement les particularités de l'ICHIMOKU.
Une ligne visualise la barre en cours.
Une ligne visualise l'extrémité du NUAGE (KUMO) qui est décalé de 25 barres dans le futur.
Une ligne visualise l'extrémité de la chikou-span, qui est décalée de 25 barres dans le passé.
II-DIRECTIONAL MOVEMENT INDEX (DMI)
Traité de manière conventionnelle : DI+, DI-, ADX et associé à un SUPERTREND DMI
Un symbole visuel en bas du graphique indique les croisements DI+ et DI-
Une ligne de symboles orientés et colorés (DMI Line) en haut du graphique, indique la direction et la puissance de la tendance.
III SUPERTREND ICHIMOKU + SUPERTREND DMI
Suivi de tendance par calcul SUPERTREND
IV- DONCHIAN CANAL :
Traité de manière conventionnelle.
(Et optimisé par des barres colorées en cas de dépassement soit vers le haut, soit vers le bas.
Les lignes, haute et basse des dernières valeurs du canal sont représentées pour visualiser rapidement la fourchette du RANGE.
V- SUPERTREND HMA (HULL)
Traité de manière conventionnelle.
La ligne HMA indique visuellement, selon la couleur et l'orientation, la tendance du marché.
Un symbole visuel en bas du graphique indique les opportunités de vente et d'achat.
*VI VOLUME :
Calcul de la MOYENNE MOBILE du volume avec comparaison du volume par rapport à la moyenne mobile du volume.
Les indications sont colorées et commentées en fonction de la comparaison.
*VII PRIX :
Calcul de la MOYENNE MOBILE du prix avec comparaison du prix par rapport à la moyenne mobile du prix.
Les indications sont colorées et commentées en fonction de la comparaison.
*VIII HHLL BOXES :
Visualise sous forme de boite, pour une période donnée, les valeurs max hautes et min basses du prix.
La configuration permet de prendre en compte les mèches hautes et basses du prix ou bien les valeurs d'ouverture et de fermeture.
IX - FAIR VALUE GAP
Cet indicateur affiche les niveaux de 'GAP' sur la période temporelle actuelle ET une période temporelle facultative supérieure.
Le script prend en compte les valeurs haut/bas de la barre actuelle et compare avec les 2 barres précédentes.
Le "gap" est généré à partir du manque de recouvrement entre ces barres.
Les écarts baissiers ou haussiers sont déterminés selon que l'écart est supérieurs ou inférieur à HmaPrice, car ils ont tendance à être comblés, et peuvent être utilisés comme cibles.
NOTA : FAIR VALUE GAP n'a pas de valeurs affichées dans la table et/ou l'étiquette.
Les informations importantes (DATAS) relatives à chaque indicateur sont visualisées en temps réel dans une table et/ou une étiquette.
Chaque information est commentée et colorée en fonction de la direction, de la valeur, de la comparaison etc.
Chaque information indique la valeurs de la barre en cours et la valeur précédente ( en mode "COMPLET").
Les autres modes possibles pour visualiser la table et/ou l'étiquette, permettent une vue plus synthétique des informations (modes "CONDENSÉ" et "MINIMAL").
Afin de ne pas trop surcharger la vision du graphique, la boite de visualisation du RANGE DONCHIAN, les lignes verticales des marques décalées de l'ICHIMOKU, ainsi que les boites de l'indicateur HHLL Boxes ne sont visualisées que de manière intermittente (géré par une temporisation réglable ).
Le paramètre de configuration "HISTORICAL INFO READING" réglé sur zéro (par défaut) permet de lire toutes les informations de la barre actuelle en cours (Barre #0).
Toutes autres valeurs permet de lire les informations d'une barre historique. La valeur 1 permet de lire les informations de la barre précédant la barre en cours (-1).
La valeur 10 permet de lire les information de la dixième barre en arrière (-10) par rapport à la barre en cours, etc.
Dans le bas de la table et de l'étiquette de DATAS, des voyants, rouge, vert ou blanc indique de manière rapide la synthèse de la tendance issue des différents indicateurs.
Chaque voyant représente le nombre d'indicateur ayant la même tendance à un instant donné. Vert pour une tendance Bullish, rouge pour une tendance Bearish et blanc pour une tendance neutre.
Les conditions pour déterminer une tendance sont pour chaque indicateur :
SUPERTREND ICHIMOHU + DMI : les 2 Super trends sont ensemble soit bullish soit Bearish. Sinon le signal est neutre.
DMI : 2 conditions principales :
BULLISH si DI+ >= DI- et ADX >25.
BEARISH si DI+ < DI- et ADX >25.
NEUTRE si les 2 conditions ne sont pas remplies.
ICHIMOKU : 3 conditions principales :
BULLISH si PRIX au dessus du nuage et TENKAN > KIJUN et NUAGE VERT DEVANT.
BEARISH si PRIX en dessous du nuage et TENKAN < KIJUN et NUAGE ROUGE DEVANT.
Les autres conditions complémentaires (Datas) complètent l'analyse et sont présents à titre informatif de la tendance et dépendent du contexte.
CANAL DONCHIAN : 1 condition principale :
BULLISH : le prix est passé au dessus de la ligne HIGH DC.
BEARISH : le prix est passé au dessous de la ligne LOW DC.
NEUTRE si le prix se situe entre les lignes HIGH DC et LOW DC
Les 2 autres conditions complémentaires (Datas) complètent l'analyse : HIGH DC et LOW DC sont croissants, descendants ou stables.
SUPERTREND HMA HULL :
Le script détermine plusieurs niveaux de tendance :
STRONG BUY, BUY, STRONG SELL, SELL ET NEUTRE.
VOLUME : 3 niveaux de tendance :
VOLUME > MOYENNE MOBILE, VOLUME < MOYENNE MOBILE, VOLUME = MOYENNE MOBILE.
PRIX : 3 niveaux de tendance :
PRIX > MOYENNE MOBILE, PRIX < MOYENNE MOBILE, PRIX = MOYENNE MOBILE.
Si vous utilisez cet indicateur/ stratégie et que vous êtes satisfait des résultats,
vous pouvez éventuellement me faire un don (un café, une pizza ou plus ...) via paypal à : lebourg.regis@free.fr.
Merci d'avance !!!
Ayez de bons Trades gagnants.

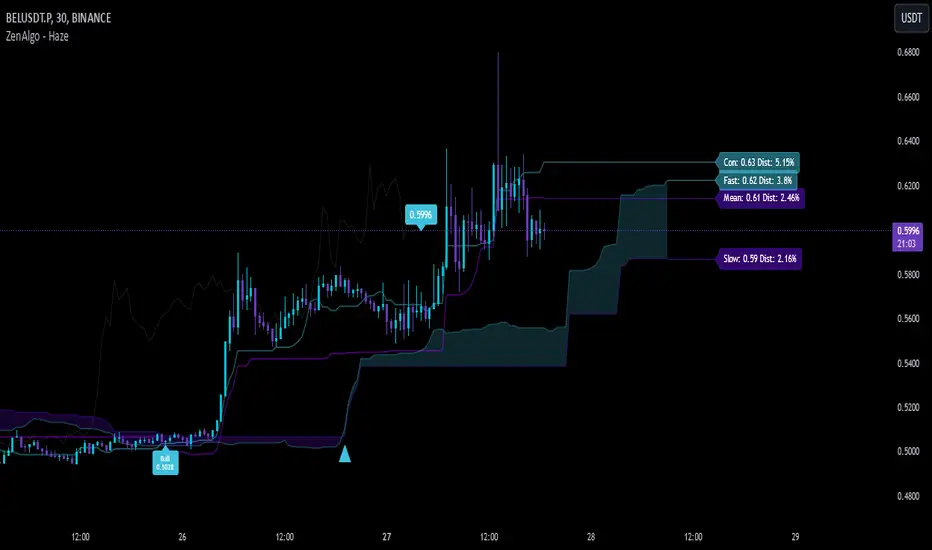
ZenAlgo - HazeThe ZenAlgo - Haze indicator offers an advanced framework for analyzing market trends, momentum shifts, and potential reversals. By integrating dynamic crossovers, predictive zones, and historical validation into a single tool, it provides traders with actionable insights for better decision-making. Its configurable settings for Crypto and Traditional adapt seamlessly to the unique characteristics of each market.
Features
Dynamic Trend Labels: Identifies "Bull," "Bear," "Super Bull," and "Super Bear" states based on crossover logic, price levels, and historical trends.
Market-Specific Adaptability: Switch between Crypto and Traditional settings for optimized analysis tailored to each market’s behavior.
Predictive Kumo Cloud: Forward-projected support and resistance zones help traders anticipate potential price movements.
Lagging Span Validation: Validates trends using historical price context for improved reliability.
Integrated Signals and Alerts: Combines crossovers and momentum shifts with real-time alerts for trend confirmation.
Added Value: Why Is This Indicator Original/Why Shall You Pay for This Indicator?
The Haze indicator differentiates itself through a carefully designed synergy of components, providing a depth of analysis that extends beyond traditional Ichimoku or Donchian-based indicators. Here’s what makes it valuable to traders:
1. Dynamic and Contextual Market Labels
Labels like Bull , Bear , Super Bull , and Super Bear do not merely indicate crossovers but also account for the relative position of price to predictive cloud zones and historical trends. This layered approach ensures signals are contextual and provide a clear understanding of the market's underlying strength or weakness.
These states are especially powerful because they simplify decision-making by summarizing complex market dynamics into actionable insights.
2. Market-Specific Optimization
The ability to switch between Crypto and Traditional configurations adapts the indicator to specific market conditions. For instance, Crypto's volatility requires wider periods for trend calculations, while Forex's tighter price movements benefit from shorter, more reactive settings. This adaptability ensures precision without needing multiple separate tools.
3. Predictive Insights
The forward-shifted Kumo cloud is designed to anticipate future support and resistance zones. Unlike reactive indicators that only analyze past data, this predictive feature gives traders an edge by offering a glimpse into potential price movements.
4. Integrated Synergy
The integration of components—Donchian channels for trend calculation, Kumo cloud for projections, and Lagging Span for historical validation—creates a holistic system. These components are not merely combined but interact to validate and reinforce each other's signals, reducing noise and increasing reliability.
5. Simplification Without Sacrificing Depth
By consolidating multiple elements into a single interface, Haze reduces chart clutter. It eliminates the need for traders to interpret separate indicators manually, saving time and improving clarity. This streamlined approach is particularly useful for traders working in fast-paced markets like Crypto.
How It Works
1. Dynamic Trend Detection
The indicator evaluates crossovers between the conversion and baseline lines. However, these are not simple crossovers—Haze analyzes the relative position of the price to the forward-displaced cloud and validates signals based on historical context (Lagging Span). For example:
A Super Bull signal is generated only when the conversion line crosses above the baseline, remains above the cloud, and is supported by rising price trends. This ensures that the signal reflects sustained bullish momentum rather than temporary spikes.
Similarly, a Super Bear signal requires the price and conversion line to be below the cloud, validated by a consistent downward trend.
2. Forward-Projected Kumo Cloud
The Kumo cloud is calculated by projecting key levels derived from Donchian channels into the future. This feature helps traders identify upcoming areas of support and resistance, enabling them to anticipate market behavior rather than reacting to it.
Cloud thickness indicates the strength of these zones; a wide cloud reflects robust support or resistance, while a narrow cloud suggests potential indecision or consolidation.
3. Lagging Span Validation
By plotting the current price backward, the Lagging Span provides historical validation of trends. For example:
If the Lagging Span remains above the cloud and price, it reinforces the bullish trend.
Conversely, if it falls below the cloud and price, it confirms bearish conditions. This backward-looking validation ensures that current signals are consistent with past market behavior.
4. Real-Time Alerts
Alerts are triggered when the Fast and Slow lines (calculated from Donchian channels) cross. These alerts are offset by the cloud’s displacement period to align with forward projections. This ensures t
5. Multi-Layered Label System
The indicator dynamically adjusts the visibility of labels based on the detected market state, providing traders with concise yet comprehensive feedback. For example:
Bull and Bear labels appear for preliminary signals, while Super Bull and Super Bear labels are reserved for high-confidence trends that meet stricter conditions.
6. Market-Specific Configurations
For Crypto, the indicator uses longer periods to capture broader trends and account for high volatility.
For Traditional, shorter periods provide quicker signals, tailored to the relatively stable nature of currency pairs.
Usage Examples
The Haze indicator is designed to be intuitive yet comprehensive, offering multiple layers of analysis to guide traders. Here's how to interpret its outputs effectively:
1. Interpreting Labels
Bull and Bear : Indicate the start of potential upward or downward momentum. These labels appear when the conversion line crosses the baseline but remain within or near the cloud, signaling a trend shift with moderate confidence.
Super Bull and Super Bear : Represent strong, confirmed trends. These labels require the conversion line and price to remain firmly above (Super Bull) or below (Super Bear) the cloud, validated by consistent price movements in the same direction.
Use the Super labels as confirmation of robust trends with high reliability, ideal for entering longer-term positions or scaling into existing trades.
2. Using the Kumo Cloud
The cloud serves as a visual representation of projected support and resistance levels.
Wide Cloud Zones: Indicate strong barriers, suggesting significant price consolidation or resistance at those levels.
Narrow Cloud Zones: Suggest weaker areas of support or resistance, often seen during periods of low volatility or indecision.
Above the Cloud: Signals a bullish market condition, where price is more likely to find support near the upper cloud boundary.
Below the Cloud: Indicates bearish conditions, with resistance likely near the lower cloud boundary.
3. Incorporating Alerts
Alerts for Fast/Slow Crossover provide a timely signal of potential momentum shifts.
A Cross Up occurring near or above the cloud strengthens bullish momentum.
A Cross Down near or below the cloud reinforces bearish momentum.
Use these alerts to refine entry and exit points, particularly in trending markets.
4. Validating Trends with the Lagging Span
The Lagging Span acts as a confirmation tool, validating current trends against historical price levels:
If the Lagging Span is above both the cloud and the current price, it confirms a strong bullish trend.
If it is below both the cloud and the price, it reinforces a bearish trend.
5. Multi-Timeframe Analysis
Analyze the indicator across multiple timeframes to gain a broader perspective on the market.
Use higher timeframes (e.g., daily or 4-hour charts) to identify dominant trends.
Use lower timeframes (e.g., 1-hour or 15-minute charts) for precise entry and exit points within the context of the larger trend.
6. Combining Labels and Cloud Zones
A Bull label within the cloud indicates a nascent uptrend but warrants caution until price moves above the cloud.
A Super Bull label above the cloud confirms strong bullish momentum, making it a high-confidence signal for taking long positions.
Conversely, a Super Bear label below the cloud signals strong downward momentum and potential shorting opportunities.
By interpreting these elements together, traders can gain a clearer understanding of market conditions and make more informed decisions without relying on multiple separate tools.
Limitations
Low-Volume Markets: In illiquid markets, such as some altcoins or exotic forex pairs, signals may be less reliable. Pair the indicator with additional tools like RSI or Bollinger Bands to filter out noise.
Sideways Markets: During periods of consolidation, frequent crossovers may produce false signals. Use complementary tools to confirm breakout conditions.
Short Timeframes: On very short timeframes (e.g., 1-minute charts), market noise may lead to unreliable signals. Applying the indicator to higher timeframes can improve reliability.
Volatile Events: In markets with extreme volatility, signals may lag behind rapid price movements. For better results, combine the indicator with a volatility filter, such as the Average True Range (ATR).
Important Notes
The indicator is a technical tool designed to support market analysis and should be used alongside other strategies, including fundamental analysis and sound risk management.
Always use stop-loss orders and proper position sizing to mitigate risks, particularly in volatile or uncertain market conditions.
This indicator does not guarantee trading success or profit and should be used as part of a comprehensive strategy.
Kijun-sen Colored [aamonkey]I isolated the Kijun-sen from the Ichimoku Cloud and colored it.
You can do major damage by just entering when the price closes above the Kijun-sen and sell when it is the other way around.
Add some other confirmation indicators to filter some false breakouts and you are good to go.

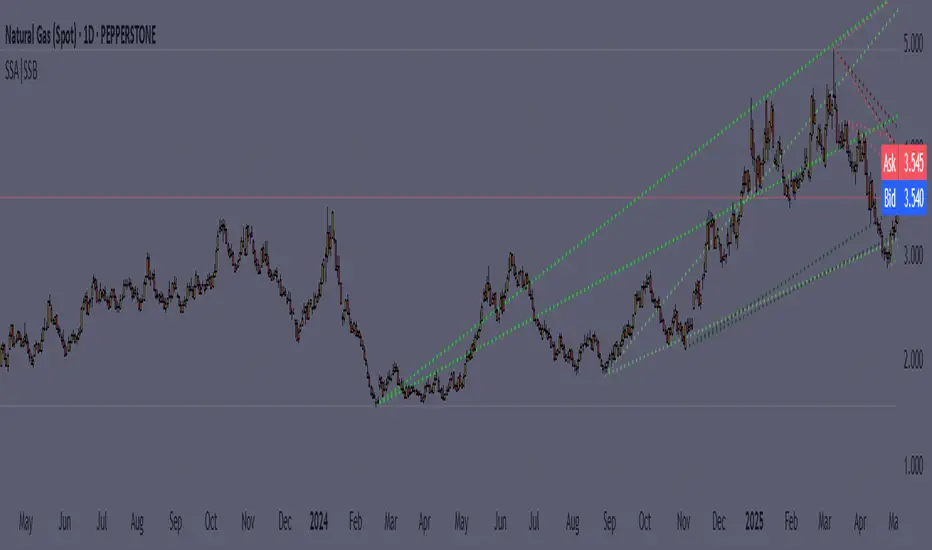
Dynamic Support|Resistance SSA & SSBHello, traders. I offer you an indicator to complement the Ichimoku Kinho Hyo trading system. This indicator determines possible dynamic resistance and support levels based on pivots and end points of the Senkou Span A and Senkou Span B lines.
You determine the pivots yourself, choosing how many bars back to look for HIGH and LOW.
Attention! Unlike the classical theory of Goichi Hosoda: the levels are dynamic, that is, they change values with each new bar!
Also added is the MTF function for displaying levels from different time frames.
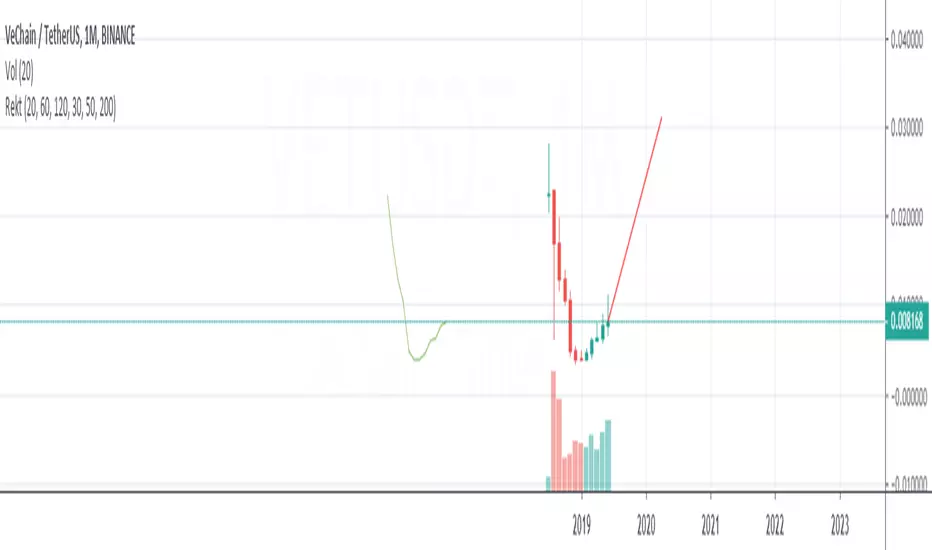
Goichi Hosoda TheoryGreetings to traders. I offer you an indicator for trading according to the Ichimoku Kinho Hyo trading system. This indicator determines possible time cycles of price reversal and expected asset price values based on the theory of waves and time cycles by Goichi Hosoda.
The indicator contains classic price levels N, V, E and NT, and is supplemented with intermediate levels V+E, V+N, N+NT and x2, x3, x4 for levels V and E, which are used in cases where the wave does not contain corrections and there is no possibility to update the impulse-corrective wave.
A function for counting bars from points A B and C has also been added.
