STEVEN Ichimoku BUY & SELLIchimoku Cloud + Advanced Buy/Sell Signals
This indicator enhances the traditional Ichimoku Cloud system by adding highly refined BUY and SELL signals based on price–Tenkan interactions, cloud positioning, and multi-step validation rules. It is designed to help traders identify high-probability trend continuation entries while filtering out signals that occur near the Kumo, where market structure is typically uncertain.
✅ BUY Signal Logic
A BUY signal is triggered only when all of the following conditions are met:
Price is above the Kumo Cloud, confirming a bullish environment.
Tenkan (Conversion Line) is above the Kumo, reinforcing bullish momentum.
Price makes a bullish cross above the Tenkan within the last 6 bars.
The entry candle opens below the Tenkan and closes above it, ensuring a clean upside break.
The candle must NOT touch the Kumo.
If the candle touches the Kumo, the indicator waits for the next clean candle that closes above Tenkan without touching the Kumo, then triggers the BUY signal.
The BUY signal appears as a small green triangle below the price bar.
✅ SELL Signal Logic
A SELL signal is triggered under the mirror conditions:
Price is below the Kumo Cloud, confirming a bearish environment.
Tenkan is below the Kumo, supporting bearish momentum.
Price makes a bearish cross below the Tenkan within the last 6 bars.
The entry candle opens above the Tenkan and closes below it.
The candle must NOT touch the Kumo.
If the candle touches the Kumo, the indicator waits for the next clean candle that closes below Tenkan without touching the Kumo, then triggers the SELL signal.
The SELL signal appears as a small red triangle above the price bar.
🎯 Purpose of the Indicator
This version of Ichimoku aims to:
Filter weak signals near the Kumo (high-noise zones).
Identify clean pullback continuations within trending markets.
Provide easy-to-read visual markers and alert conditions for automated setups.
Improve decision-making by ensuring both price and Tenkan confirm trend strength before triggering entries.
🔔 Alerts Included
The indicator includes two built-in alerts:
BUY Signal – Ichimoku Long Entry
SELL Signal – Ichimoku Short Entry
These alerts can be used directly for automation, bot integration, or manual trading.
📌 Recommended Use
Best used in trending markets.
Works across timeframes (Scalp, Swing, Intraday, or Daily).
Ideal as a primary strategy or confirmation tool.
"ichimoku" için komut dosyalarını ara

Ichimoku Multi-Timeframe Status (IMTF – VFG)-----------------------------
Overview
-----------------------------
This tool displays the status of key Ichimoku components (Tenkan, Kijun, and the Cloud) across multiple timeframes in a compact color-coded table. It helps traders quickly assess trend alignment and market structure without plotting the full Ichimoku on the chart.
👉 How to Read
✔ TK row:
Green = price above Tenkan
Red = price below Tenkan
✔ KJ row:
Green = price above Kijun
Red = price below Kijun
✔ KU row (Cloud):
Green = above the cloud
Red = below the cloud
Blue = inside the cloud
The KU row is highlighted for visibility.
👉 Usage
This indicator does not generate signals.
It simply summarizes Ichimoku conditions on several timeframes to help identify:
1️⃣ multi-timeframe trend alignment,
2️⃣ momentum vs. structure (TK vs. KJ),
3️⃣l cloud context for trend-following or structural analysis.

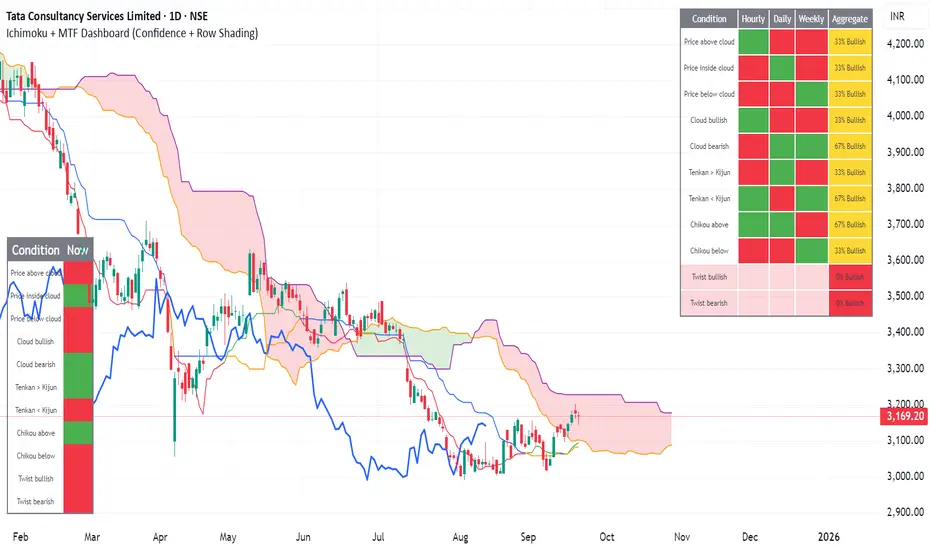
Ichimoku + MTF Dashboard (Confidence + Row Shading)Name: Ichimoku + Multi-Timeframe (MTF) Dashboard
Purpose
This indicator is designed to give a complete trend, momentum, and alignment picture of a stock across multiple timeframes (hourly, daily, weekly) using the Ichimoku Kinko Hyo system. It combines:
Classic Ichimoku signals: Tenkan/Kijun crossovers, cloud position (Kumo), Chikou span, and cloud twists.
MTF Dashboard: Aggregates hourly, daily, and weekly Ichimoku conditions into a clean visual table.
Dynamic coloring: Each signal is represented with green/red fills, and rows are shaded for full alignment. Aggregate column highlights mixed signals in yellow.
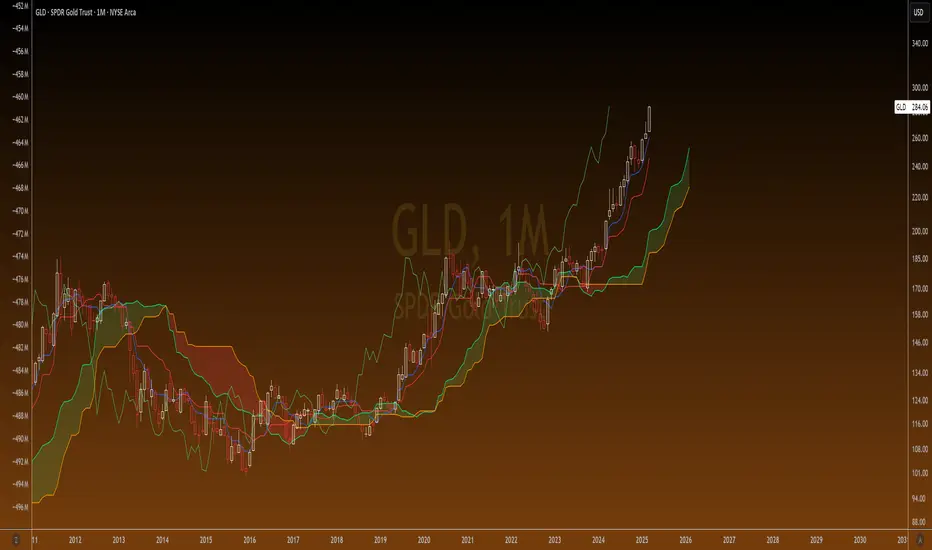
Ichimoku CloudStandard Ichimoku Cloud Implementation
The official Ichimoku Cloud indicator on TradingView applies an offset value of 1 to several lines, which deviates from Hosoda's original Ichimoku theory. This script rectifies that discrepancy, providing a more accurate representation of the Ichimoku Cloud.

Ichimoku Cloud Auto TF🧠 Timeframe Breakdown for Ichimoku Cloud Auto TF
Each timeframe in this indicator is carefully calibrated to reflect meaningful Ichimoku behavior relative to its scale. Here's how each one is structured and what it's best used for:
⏱️ 1 Minute (1m)
Tenkan / Kijun / Span B: 5 / 15 / 45
Use: Scalping fast price action.
Logic: Quick reaction to short-term momentum. Best for highly active traders or bots.
⏱️ 2 Minutes (2m)
Tenkan / Kijun / Span B: 6 / 18 / 54
Use: Slightly smoother than 1m, still ideal for scalping with a little more stability.
⏱️ 5 Minutes (5m)
Tenkan / Kijun / Span B: 8 / 24 / 72
Use: Intraday setups, quick trend capture.
Logic: Balanced between reactivity and noise reduction.
⏱️ 15 Minutes (15m)
Tenkan / Kijun / Span B: 9 / 27 / 81
Use: Short-term swing and intraday entries with higher reliability.
⏱️ 30 Minutes (30m)
Tenkan / Kijun / Span B: 10 / 30 / 90
Use: Intra-swing entries or confirmation of 5m/15m signals.
🕐 1 Hour (1H)
Tenkan / Kijun / Span B: 12 / 36 / 108
Use: Ideal for swing trading setups.
Logic: Anchored to Daily reference (1H × 24 ≈ 1D).
🕐 2 Hours (2H)
Tenkan / Kijun / Span B: 14 / 42 / 126
Use: High-precision swing setups with better context.
🕒 3 Hours (3H)
Tenkan / Kijun / Span B: 15 / 45 / 135
Use: Great compromise between short and mid-term vision.
🕓 4 Hours (4H)
Tenkan / Kijun / Span B: 18 / 52 / 156
Use: Position traders & intraday swing confirmation.
Logic: Designed to echo the structure of 1D Ichimoku but on smaller scale.
📅 1 Day (1D)
Tenkan / Kijun / Span B: 9 / 26 / 52
Use: Classic Ichimoku settings.
Logic: Standard used globally for technical analysis. Suitable for swing and position trading.
📆 1 Week (1W)
Tenkan / Kijun / Span B: 12 / 24 / 120
Use: Long-term position trading & institutional swing confirmation.
Logic: Expanded ratios for broader perspective and noise filtering.
🗓️ 1 Month (1M)
Tenkan / Kijun / Span B: 6 / 12 / 24
Use: Macro-level trend visualization and investment planning.
Logic: Condensed but stable structure to handle longer data cycles.
📌 Summary
This indicator adapts Ichimoku settings dynamically to your chart's timeframe, maintaining logical ratios between Tenkan, Kijun, and Span B. This ensures each timeframe remains responsive yet meaningful for its respective market context.
Ichimoku MTF (best MTF 4H - Entry 15M)The Ichimoku Cloud is a collection of technical indicators that show support and resistance levels, as well as momentum and trend direction. It does this by taking multiple averages and plotting them on a chart. It also uses these figures to compute a “cloud” that attempts to forecast where the price may find support or resistance in the future.
The technical indicator shows relevant information at a glance by using averages.
The overall trend is up when the price is above the cloud, down when the price is below the cloud, and trendless or transitioning when the price is in the cloud.
Charles G. Koonitz. “Ichimoku Analysis & Strategies: The Visual Guide to Spot the Trends in Stock Market, Cryptocurrency and Forex Using Technical Analysis and Cloud Charts," Tripod Solutions Inc., 2019.
When Leading Span A is rising and above Leading Span B, this helps to confirm the uptrend and the space between the lines is typically colored green. When Leading Span A is falling and below Leading Span B, this helps confirm the downtrend. The space between the lines is typically colored red in this case.1
Traders will often use the Ichimoku Cloud as an area of support and resistance depending on the relative location of the price. The cloud provides support/resistance levels that can be projected into the future. This sets the Ichimoku Cloud apart from many other technical indicators that only provide support and resistance levels for the current date and time.
Traders should use the Ichimoku Cloud in conjunction with other technical indicators to maximize their risk-adjusted returns. For example, the indicator is often paired with the relative strength index (RSI), which can be used to confirm momentum in a certain direction. It’s also important to look at the bigger trends to see how the smaller trends fit within them. For example, during a very strong downtrend, the price may push into the cloud or slightly above it, temporarily, before falling again. Only focusing on the indicator would mean missing the bigger picture that the price was under strong longer-term selling pressure.
Crossovers are another way that the indicator can be used. Watch for the conversion line to move above the base line, especially when the price is above the cloud. This can be a powerful buy signal. One option is to hold the trade until the conversion line drops back below the base line. Any of the other lines could be used as exit points as well.

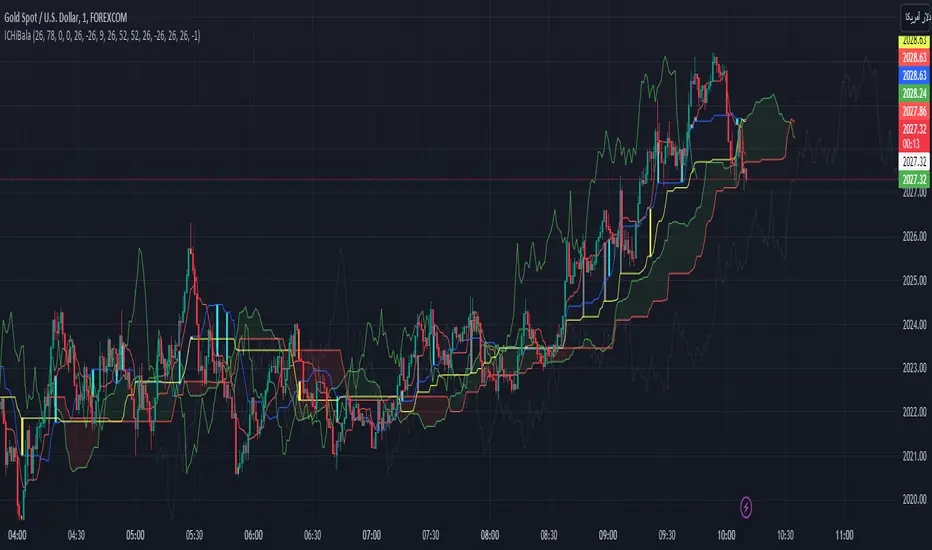
Ichimoku BalaIndicator Overview
The Ichimoku Bala indicator is a modification of the traditional Ichimoku Kinko Hyo indicator that aims to improve its effectiveness in identifying trend reversals and potential trading opportunities. It incorporates additional lines, such as the Senkou Span B--0 line, to provide more nuanced insights into price movements.
Input Parameters
The indicator has several input parameters that allow you to customize its appearance and behavior:
enableReplay: Whether to enable replay mode, which allows you to analyze historical data.
i_date: The date to start replaying historical data.
chiko2: The period for the Chikou Span 78 line.
TenkanShift: The offset for the Tenkan-Sen line.
KinjunShift: The offset for the Kinjun-Sen line.
KumoShift: The offset for the Kumo (Senkou Span A and Senkou Span B) lines.
ChikouSpanShift: The offset for the Chikou Span line.
TenkanPeriods: The period for the Tenkan-Sen line.
KinjunPeriods: The period for the Kinjun-Sen line.
SenkouSpanBPeriods: The period for the Senkou Span B line.
senkouSpanBPeriod: The period for the Senkou Span B--0 line.
AddbasePeriods1: The period for the Direction Line.
DirectionLineShift: The offset for the Direction Line.
AddbasePeriods2: The period for the Quality Line.
QualityLineShift: The offset for the Quality Line.
offset_colour_candle: The offset for coloring the previous candle before the flat start.
Indicator Calculations
The indicator calculates the following lines:
TenkanSen: A moving average of the highest and lowest prices over 9 periods.
KinjunSen: A moving average of the Tenkan-Sen line over 26 periods.
Senkou Span A: The average of the Tenkan-Sen and Kinjun-Sen lines shifted 26 periods forward.
Senkou Span B: The average of the highest and lowest prices over 52 periods shifted 26 periods forward.
Senkou Span B--0: The average of the highest and lowest prices over 52 periods.
It also determines the flatness of the Tenkan-Sen, Kinjun-Sen, and Senkou Span B lines and identifies the start of a flat period.
Indicator Visualizations
The indicator plots the following lines:
TenkanSen: A blue line.
KinjunSen: A red line.
Chikou Span: A green line shifted one period forward.
Senkou Span A: A green line.
Senkou Span B: A red line.
Senkou Span B--0: A gray line.
Direction Line: A blue line.
Quality Line: A red line.
It also colors the previous candle before the flat start according to the type of flat detected:
candleColor: Purple for a flat involving the Tenkan-Sen and Kinjun-Sen lines.
candleColor2: Yellow for a flat involving the Senkou Span B line.
candleColor3: Gray for a flat involving all three lines.
Modifications by Seyedbala
The provided code includes additional modifications by Seyedbala, including:
Adding a parameter offset_colour_candle to control the offset for coloring the previous candle before the flat start.
Modifying the color of the fill between the Tenkan-Sen and Kinjun-Sen lines to #23dde0 for flatStart and color.purple for all other cases.
Modifying the color of the fill between the Senkou Span B line and Kinjun-Sen lines to yellow for flatStart2 and color.yellow for all other cases.
Modifying the color of the fill between the Tenkan-Sen and Senkou Span B lines to gray for flatStart3 and color.gray for all other cases.
These modifications aim to enhance the visual representation of the flat areas and make it easier to identify the different types of flat patterns.
Overall, the Ichimoku Bala indicator is a valuable tool for analyzing price movements and identifying potential trading opportunities. Its modifications by Seyedbala further enhance its capabilities and provide more nuanced insights into market trends.
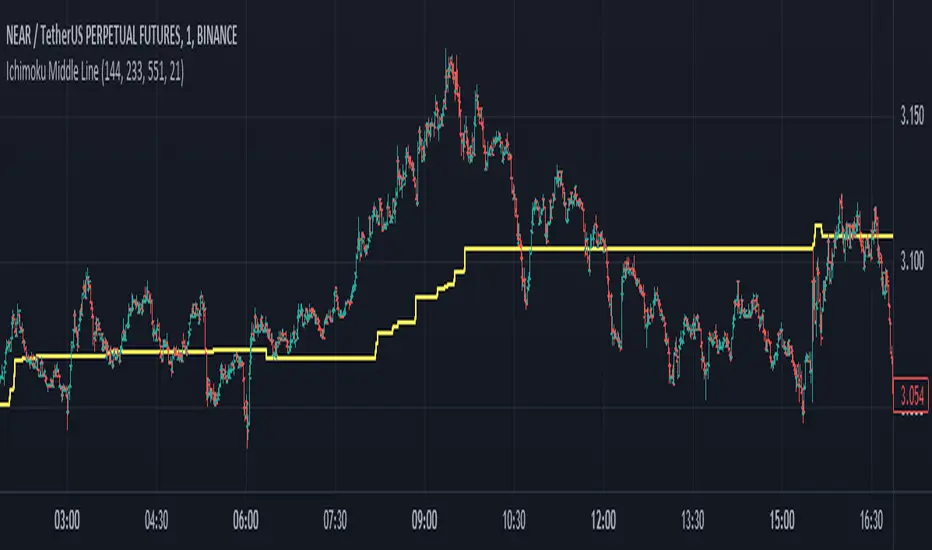
Ichimoku Cloud Middle LineMiddle Line Ichimoku cloud for my friend and me
The Ichimoku Cloud is a collection of technical indicators that show support and resistance levels, as well as momentum and trend direction. It does this by taking multiple averages and plotting them on a chart. It also uses these figures to compute a “cloud” that attempts to forecast where the price may find support or resistance in the future.
The Ichimoku Cloud was developed by Goichi Hosoda, a Japanese journalist, and published in the late 1960s.
1
It provides more data points than the standard candlestick chart. While it seems complicated at first glance, those familiar with how to read the charts often find it easy to understand with well-defined trading signals.
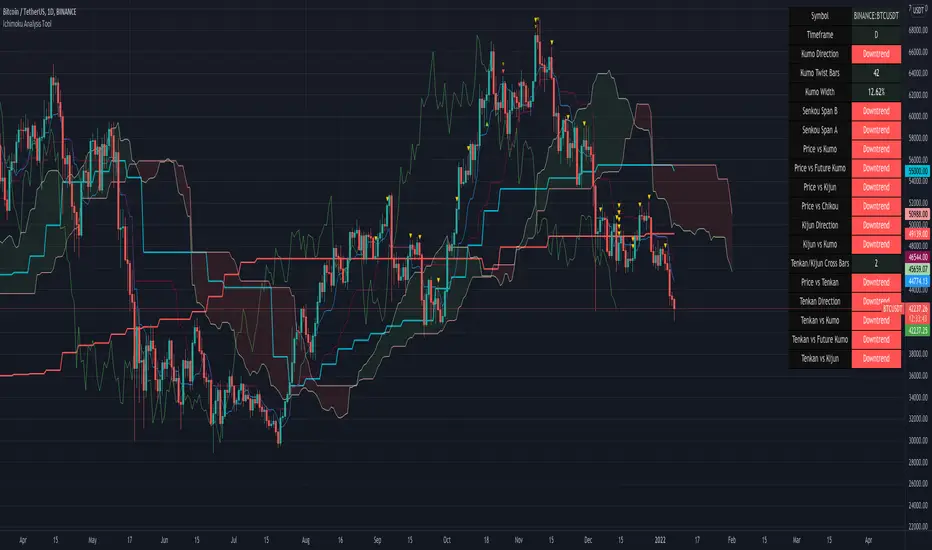
Ichimoku Analysis Tool by TheSocialCryptoClubName: Ichimoku Analysis Tool
Category: Indicator.
Timeframe: Any Timeframe
Description: Ichimoku Analysis Tool is an assistant for the trader to visualize the information that can be perceived at a glance from the Ichimoku Kinko Hyo indicator.
Suggested usage: Use on Daily to evaluate the general long term, short term and mid term situation.
Technical Details: Each cell of the table describes an element of the Ichimoku by simply assessing the direction of the lines - or whether they are flat - and how they are positioned with each other (e.g. Tenkan above or below the Kijun) and in general how long ago the last Kumo Twist was and the width in percent of the Kumo.
Credits:
- Some of the indications has been explained by Corrado Rondelli
- Table has been inspired by tanayroy's ICHIMOKU Trading beta
Ichimoku ForecastFor Ichimoku lovers
hope you like it
”Ichimoku Kinko Hyo” translates to “one glance equilibrium chart”. The Ichimoku Kinko Hyo indicator is a technical indicator used in the forex market and an exceptional system of analyzing and predicting, which combines several approaches to monitor price fluctuations and identify important support lines and major trends. One of the main advantages of the Ichimoku indicator for forex trading is that it provides a full-fledged chart analysis without additional indicators. With the help of signals, you can easily determine which trend the market is in.

Ichimoku kinko hyo-Full OptionMany Pro-Ichimoku traders insist that we should not change Ichimoku indicator!
However, I've redesigned Ichimoku for more study out of traditional form.

Ichimoku Cloud Score v1.0This script calculates a simple Ichimoku Score based on the signals documented here , with a few additions. Each of the score components can be individually weighted via the script inputs . The output is a plot of the normalized Ichimoku score, in the range of -100 to 100.
This script has been heavily modified from 'Ichimoku Cloud Signal Score v2.0.0 '. Credit to user 'dashed' for the initial implementation.
This has been modified with several refinements:
Clean/Organized Code
Simplified Inputs
Improved Style
Scores normalized to a range (-100, 100)
Bugfixes and Improvements
Script Inputs: i.imgur.com

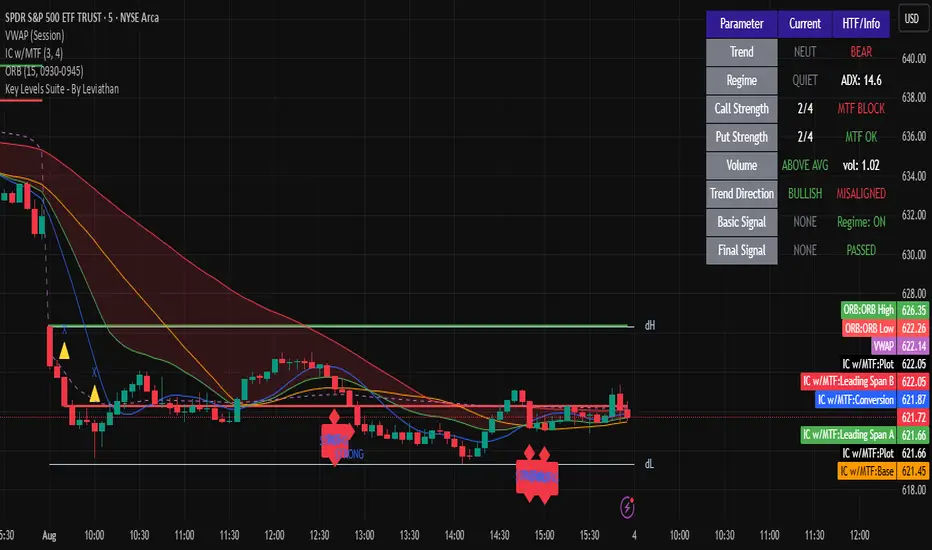
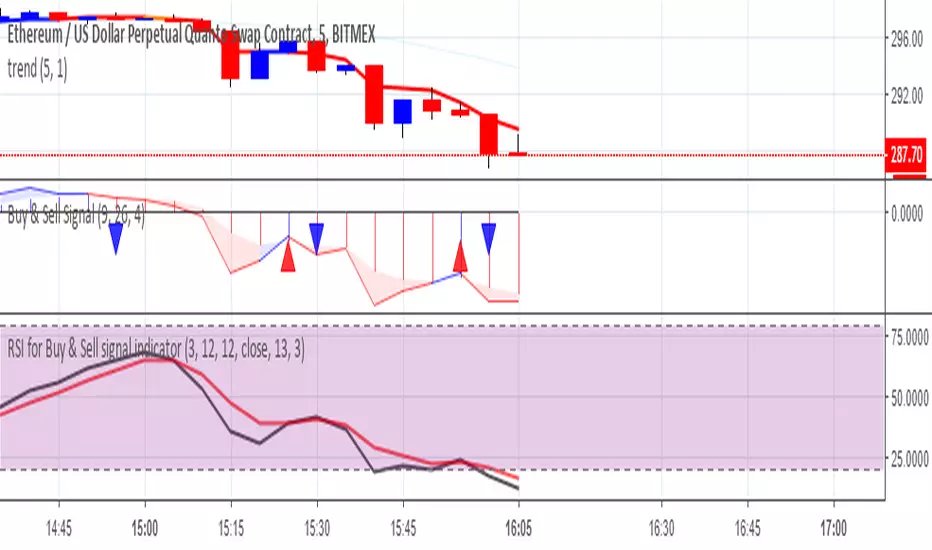
Ichimoku + VWAP + OBV + ATR Full System (NQ Daytrade)Extended Indicator Description
Ichimoku + VWAP + OBV + ATR Full System is a rule-based intraday trading indicator designed specifically for NQ day trading, focusing on trend alignment, participation confirmation, and volatility-aware execution.
This indicator does not rely on a single signal or crossover. Instead, it integrates multiple market dimensions into one structured framework to help traders identify high-probability trend continuation scenarios while avoiding low-quality, range-bound conditions.
System Philosophy
The core idea of this system is simple:
trade only when trend, price location, volume, and volatility are aligned.
Each component plays a specific role and is not meant to be used in isolation. The indicator works best when all conditions reinforce the same directional bias.
Component Breakdown
Ichimoku Cloud
Used to define the primary market structure and directional bias. The system favors trades only when price action aligns clearly above or below the cloud, helping filter out indecisive or transitional phases.
VWAP
Acts as a session-based equilibrium reference. Price position and distance relative to VWAP are used to confirm whether the market is trending with intent rather than reverting to the mean.
OBV (On-Balance Volume)
Provides participation and flow confirmation. OBV helps validate whether price movement is supported by volume, reducing the likelihood of false breakouts or weak trend signals.
ATR (Average True Range)
Used as a volatility filter and risk-awareness tool. ATR conditions help the system avoid low-volatility environments and support more realistic expectations for intraday movement.
Trade Logic Overview
The system is designed around trend-following pullbacks, not prediction or counter-trend trading.
When trend structure is established and confirmed by VWAP positioning and OBV behavior, pullback zones within the trend become areas of interest. ATR conditions ensure that trades are taken only when sufficient movement potential exists.
Rather than generating frequent signals, the system prioritizes selectivity and clarity, making it suitable for disciplined day traders who value context over quantity.
Intended Use
This indicator is built for:
NQ intraday and day trading
Trend continuation and pullback strategies
Traders who prefer structured, confirmation-based systems
Lower to mid intraday timeframes such as 3-minute, 5-minute, and 15-minute charts
Important Notes
This is not an automated trading system and does not provide guaranteed results. The indicator is designed as a decision-support tool to assist with market context, directional bias, and trade timing. Risk management, execution, and position sizing remain the responsibility of the user.
롱/숏 삼각형 시그널
동그라미 청산 시그널
VWAP 밴드 기반 방향성
OBV 보조지표
이름 (Name)
BTC Scalping Signal – VWAP + OBV
짧은 설명 (Short Description)
VWAP 밴드와 OBV를 기반으로 방향성, 진입·청산 시그널을 제공하는 스캘핑 지표입니다.
긴 설명 (Long Description)
이 지표는 BTC 단기 스캘핑을 위해 설계된 것으로, 특히 15분봉 환경에 최적화되어 있습니다.
VWAP 밴드의 위치와 추세 판별 로직을 기반으로 롱·숏 진입 신호를 제공합니다.
OBV 모멘텀을 보조 필터로 사용하여 돌파 및 되돌림 가능성을 판단합니다.
시장 변동성이 축소되거나 평균회귀 신호가 감지될 때 청산 시그널을 표시합니다.
삼각형(진입), 원형(청산) 등 직관적 시각 요소를 통해 빠른 의사결정을 지원합니다.

Ichimoku Multi-Timeframe Heatmap 12/5/2025
Multi-Timeframe Ichimoku Heatmap - Scan Your Watchlist in Seconds
This indicator displays all 5 critical Ichimoku signals (Cloud Angle, Lagging Line, Price vs Cloud, Kijun Slope, and Tenkan/Kijun Cross) across 10 timeframes (15s, 1m, 3m, 5m, 15m, 30m, 1h, 4h, Daily, Weekly) in one compact heatmap table. Instantly spot multi-timeframe trend alignment with color-coded cells: green for bullish, red for bearish, and gray for neutral. Perfect for quickly scanning through your entire watchlist to identify the strongest setups with confluent signals across all timeframes.

ichimoku complex value Signal [Levels 1-3]This is a signal indicator utilizing composite values of the Ichimoku kinko hyo
The signal is generated when it reaches the period of ichimoku kinko hyo I set.
Lv1: Low reliability. Recommended for scalping.
Lv2: Higher reliability than Level 1, but unsuitable for holding positions for a long duration.
Lv3: High reliability. Suitable for holding positions for a long duration.
Important Note: Do not set your stop-loss too tight. You may get stopped out during a retest or a fakeout movement.
EURUSD, USDJPY, and other Forex pairs: 4-Hour (4H)
BTCUSD, ETHUSD, and other Crypto assets: 1-Hour (1H)
XAUUSD (GOLD): 5-Minute (5m)
NQ1!: 4-Hour (4H)

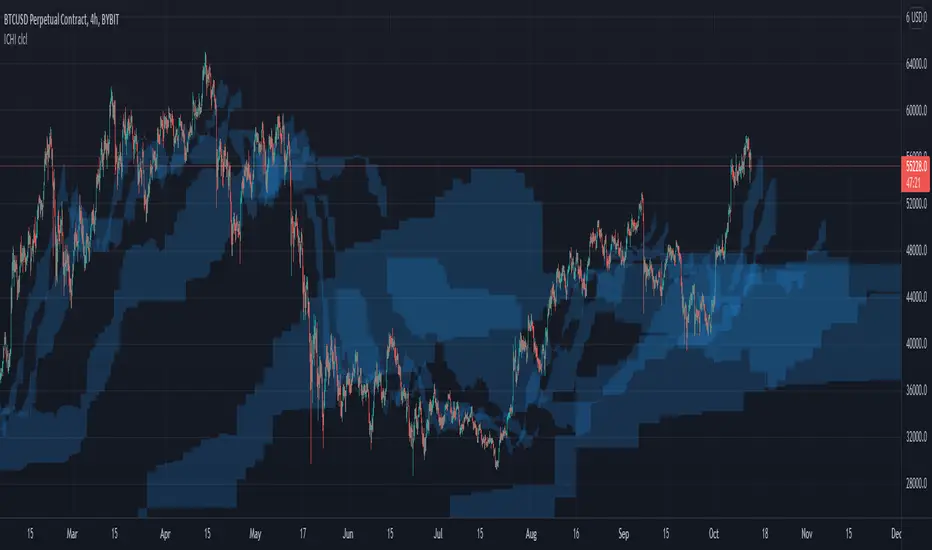
Ichimoku cloud clustersThe intention of this script is to get a quick and redundant overview of Ichimoku clouds of relevant time frames to spot clusters as strong support and resistance levels.
The script displays the Ichimoku cloud of the current time frame and the clouds of the supported higher time frames. Clouds of lower time frames are not displayed.
Ichimoku Strategy with Buy and Sell ZonesIchimoku strategy with Buy and Sell Zones basicly using Ichimoku Cloud
Tenkan-sen (Conversion Line): (9-period high + 9-period low)/2
On a daily chart, this line is the midpoint of the 9-day high-low range, which is almost two weeks.
Kijun-sen (Base Line): (26-period high + 26-period low)/2
On a daily chart, this line is the midpoint of the 26-day high-low range, which is almost one month.
Senkou Span A (Leading Span A): (Conversion Line + Base Line)/2
This is the midpoint between the Conversion Line and the Base Line. The Leading Span A forms one of the two Cloud boundaries. It is referred to as “Leading” because it is plotted 26 periods in the future and forms the faster Cloud boundary.
Senkou Span B (Leading Span B): (52-period high + 52-period low)/2
On the daily chart, this line is the midpoint of the 52-day high-low range, which is a little less than 3 months. The default calculation setting is 52 periods, but it can be adjusted. This value is plotted 26 periods in the future and forms the slower Cloud boundary.
Chikou Span: Represents the closing price and is plotted 26 days back.
Kumo Cloud: Kumo cloud between Senkuo Span A and Senkou Span B lines. It can be green or red. Color can be change with the trend.
And, it has 2 zones includes Buy and Sell Zone
For Buy Zone Alert;
- Tenkansen (Conversion Line) should crossover Kijunsen (Base line) above the highest line of cloud
- Price should be above the highest line of cloud
- Chikouspan should be above the cloud
For Sell Zone Alert:
- Kijunsen (Base Line) should crossover Tenkansen (Conversion Line) below the lowest line of cloud
- Price should be below the lowest line of cloud
- Chikouspan should be below the cloud
The indicator has some of Simple Moving Averages and Exponentianl Moving Averages
It includes:
- SMA 50
- SMA 200
- EMA 21
- EMA 500
You have chance to show or hide everything from settings section.
If you hide everything you can only see Buy and Sell zones.

Ichimoku for Buy and Sell signalThis indicator coded base on Ichimoku source. Support signal for Buy and Sell signal. Only follow the color of Ichimoku and the signal buy and sell. Only use for Cryptocurrency Market
Ichimoku Traffic Lights Go--no go flags for Ichimoku Cloud. For quick scanning thru your watchlist, and good for scanning through timeframes.

Ichimoku Green BG by Pranojit DeyThis indicator shows ichimoku bulliush trend background so that the option buyers can understand bullish trend easily.

Ichimoku Strict exit indicatorIndicator for ichimoku with exit
entry - when all cond meet
exit on base line

Ichimoku cloud suite ver 2 trading system based on ichimoku cloud cross over system. amended SL and sideways

Ichimoku w/MTFcombines traditional Ichimoku Cloud analysis with multi-timeframe trend filtering to generate high-probability trade signals