Ichimoku , Bollinger Bands , EMA 15 , MA50 , MA100, Pivot PointIchimoku , Bollinger Bands , EMA 15 , MA50 , MA100, Pivot Point
"ichimoku" için komut dosyalarını ara

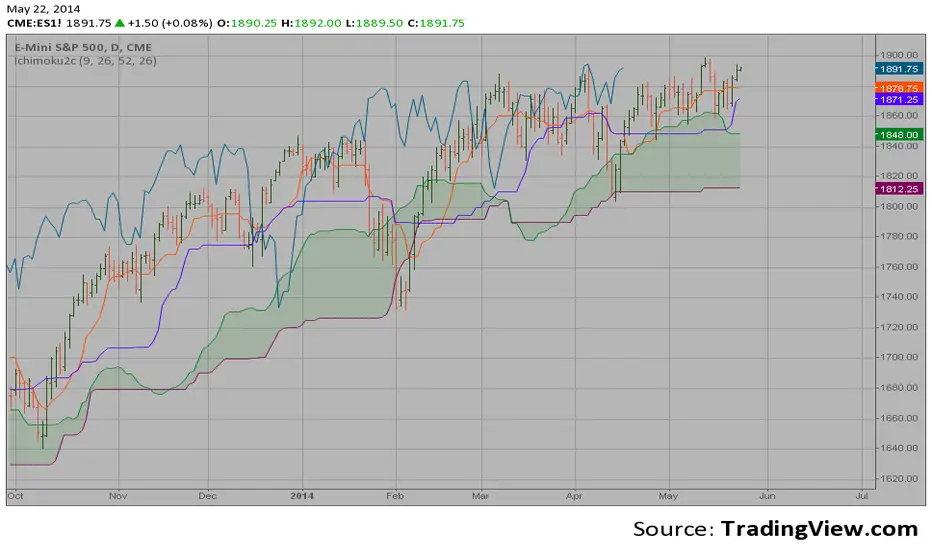
Ichimoku V5 by ChrisMoody - Daily Kijun Mod by JDNIchimoku V5 by ChrisMoody with Daily Kijun-Sen Mod by JDN
This indicator has been modified to allow you to display the Daily Kijun-Sen on all time frames.

Ichimoku Cloud TimeIchimoku Cloud that will remain fixed to a time interval. Might be useful to someone wanting to use multiple Ichimoku Clouds on a single time frame.
Input values:
Daily Interval: If checked then days are used for the interval. If unchecked then minutes will be used.
Interval: The interval to use for the indicator.
Ichimoku OHLCHere is an alternate way to look at Ichimoku. Instead of computing Ichimoku components only on "close", this indicator computes it for Open,High, Low and Close. I then average out the values and see if all of them are trending up or down
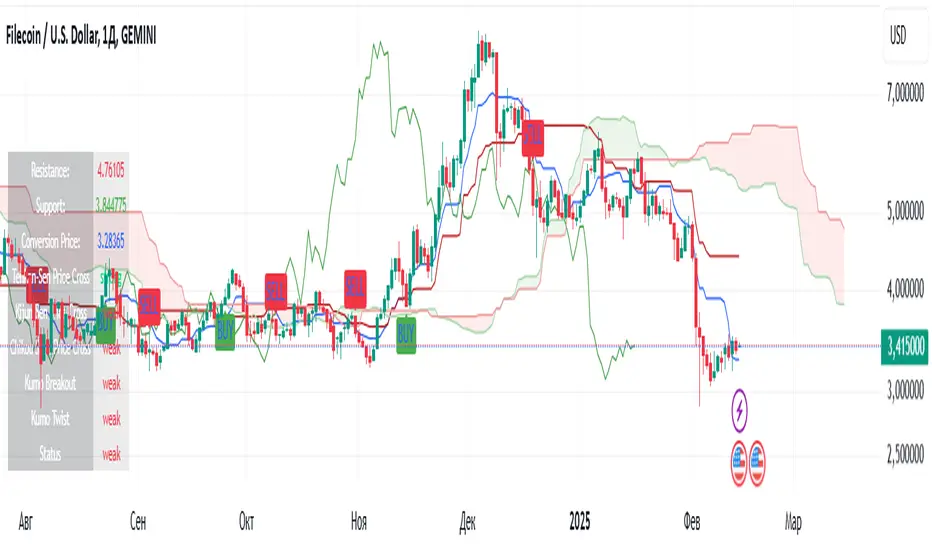
Ichimoku(TF)This Pine Script indicator is a comprehensive Ichimoku Cloud implementation designed for TradingView. Its uniqueness lies in the precisely calculated settings for each timeframe, offering a tailored Ichimoku experience across different chart resolutions.
Key Features:
Timeframe-Specific Presets: The indicator includes a wide range of pre-defined settings optimized for various timeframes (1m, 2m, 3m, 5m, 10m, 15m, 30m, 45m, 1H, 2H, 3H, 4H, 6H, 12H, 18H, 1D, 3D, 1W, 1M). This ensures accurate Ichimoku calculations and relevant signals for your chosen timeframe.
Ichimoku Cloud: Plots the standard Ichimoku Cloud components: Tenkan-sen (Conversion Line), Kijun-sen (Base Line), Senkou Span A & B (Leading Spans), and Chikou Span (Lagging Span).
Configurable Display: Allows toggling the Ichimoku Cloud display, coloring bars based on the trend (above or below the cloud), and customizing table visibility, style, font size and position.
Trend Analysis Table: A summary table provides a quick overview of the current trend based on Ichimoku components. It assesses the strength of the trend based on the price's relation to the Tenkan-sen, Kijun-sen, Kumo Cloud, Chikou Span and Kumo Twist. The table offers both detailed and short styles.
Buy/Sell Signals: Generates buy and sell signals based on Tenkan-sen/Kijun-sen crossovers.
Uniqueness:
The primary advantage of this indicator is its meticulous configuration for different timeframes. Instead of using a single set of parameters for all timeframes, it provides optimized values that are more suitable for specific chart resolutions. The summary table provides an easy and quick way to assess the trend.
Этот индикатор Pine Script представляет собой комплексную реализацию облака Ишимоку, разработанную для TradingView. Его уникальность заключается в точно рассчитанных настройках для каждого таймфрейма, предлагая индивидуальный опыт Ишимоку для различных разрешений графиков.
Ключевые особенности:
Предустановки для конкретных таймфреймов: Индикатор включает в себя широкий спектр предопределенных настроек, оптимизированных для различных таймфреймов (1m, 2m, 3m, 5m, 10m, 15m, 30m, 45m, 1H, 2H, 3H, 4H, 6H, 12H, 18H, 1D, 3D, 1W, 1M). Это обеспечивает точные вычисления Ишимоку и релевантные сигналы для выбранного вами таймфрейма.
Облако Ишимоку: Отображает стандартные компоненты облака Ишимоку: Tenkan-sen (линия конверсии), Kijun-sen (базовая линия), Senkou Span A & B (ведущие диапазоны) и Chikou Span (запаздывающий диапазон).
Настраиваемое отображение: Позволяет переключать отображение облака Ишимоку, окрашивать бары в зависимости от тренда (выше или ниже облака), а также настраивать видимость таблицы, стиль, размер шрифта и положение.
Таблица анализа тренда: Сводная таблица обеспечивает быстрый обзор текущего тренда на основе компонентов Ишимоку. Он оценивает силу тренда на основе отношения цены к Tenkan-sen, Kijun-sen, облаку Kumo, Chikou Span и Kumo Twist. Таблица предлагает как подробный, так и краткий стили.
Сигналы покупки/продажи: Генерирует сигналы покупки и продажи на основе пересечений Tenkan-sen/Kijun-sen.
Уникальность:
Основным преимуществом этого индикатора является его тщательная настройка для разных таймфреймов. Вместо использования единого набора параметров для всех таймфреймов он предоставляет оптимизированные значения, которые больше подходят для конкретных разрешений графиков. Сводная таблица обеспечивает простой и быстрый способ оценки тренда.
Ichimoku LuqThis custom indicator enhances the traditional Ichimoku Cloud by allowing users to specify a custom timeframe for its calculation. The Ichimoku Cloud, also known as Ichimoku Kinko Hyo, is a versatile and comprehensive indicator that defines support and resistance, identifies trend direction, gauges momentum, and provides trading signals.
Key Features:
Custom Timeframe: Unlike the standard Ichimoku Cloud, which operates on the chart's default timeframe, this indicator allows you to select a custom timeframe for its calculations. This flexibility enables you to analyze market trends and signals from different time perspectives without changing your chart's timeframe.
Comprehensive Market Analysis:
Tenkan-sen (Conversion Line): A moving average of the highest high and the lowest low over the last 9 periods.
Kijun-sen (Base Line): A moving average of the highest high and the lowest low over the last 26 periods.
Senkou Span A (Leading Span A): The average of the Tenkan-sen and Kijun-sen, plotted 26 periods ahead.
Senkou Span B (Leading Span B): A moving average of the highest high and the lowest low over the past 52 periods, plotted 26 periods ahead.
Chikou Span (Lagging Span): The closing price plotted 26 periods back.
Visual Cloud: The area between Senkou Span A and Senkou Span B creates the cloud (Kumo), which is used to identify future support and resistance levels. The cloud changes color based on whether Senkou Span A is above or below Senkou Span B.
Trend Identification:
Bullish Signals: Occur when the price is above the cloud, and the cloud is green.
Bearish Signals: Occur when the price is below the cloud, and the cloud is red.
Neutral Signals: Occur when the price is within the cloud.
Momentum and Signal Confirmation: The interactions between the Tenkan-sen and Kijun-sen, as well as the position of the Chikou Span relative to past prices, provide additional confirmation for trading signals.
How to Use:
Setting the Custom Timeframe: In the indicator settings, select your desired custom timeframe. This allows you to adapt the Ichimoku Cloud analysis to different market conditions and trading strategies.
Interpreting Signals: Use the traditional Ichimoku signals (e.g., crosses of the Tenkan-sen and Kijun-sen, cloud breakouts, etc.) while considering the custom timeframe for a broader market perspective.
Combining with Other Analysis: This indicator can be used alongside other technical analysis tools to enhance your trading strategy and gain more comprehensive market insights.
Benefits:
Flexibility: Analyze market trends from multiple time perspectives without altering your main chart timeframe.
Enhanced Decision Making: Gain deeper insights into market trends, support, and resistance levels.
Versatility: Suitable for various trading strategies, including day trading, swing trading, and long-term investing.

Ichimoku Slope Filtered Signals [UAlgo]
🔶Description:
The "Ichimoku Slope Filtered Signals" indicator is designed to provide trading signals based on the Ichimoku Cloud indicator while incorporating a slope filter. The Ichimoku Cloud is a comprehensive indicator that defines support and resistance, identifies trend direction, and provides trading signals. This script enhances the traditional Ichimoku Cloud signals by incorporating a slope filter, which helps to confirm the strength and direction of the trend.
🔶Key Features:
Ichimoku Cloud Parameters: Users can customize parameters such as Tenkan, Kijun, and Senkou Span lengths, along with multipliers, to adjust the sensitivity of the Ichimoku Cloud.
Slope Filter Settings: Users can specify the number of bars to measure the slope and the lookback period for trend measurement. Additionally, there are options to filter Ichimoku signals based on slope thresholds.
Normalized Slope: The indicator calculates the normalized slope of the selected data series (in this case, Tenkan-sen) and plots it alongside the Ichimoku Cloud.
Signal Generation: Trading signals are generated based on crossovers and crossunders of the Tenkan-sen and Kijun-sen lines of the Ichimoku Cloud. These signals can be further filtered based on the normalized slope of the selected data series.
🔶 Usage:
Customization: Traders can customize the parameters of the Ichimoku Cloud and slope filter according to their trading strategy and risk tolerance.
Interpretation of Signals:
Crossover: A buy signal is generated when the Tenkan-sen line crosses above the Kijun-sen line. This signal can be further filtered based on the normalized slope.
Crossunder: A sell signal is generated when the Tenkan-sen line crosses below the Kijun-sen line. Similar to the buy signal, this can also be filtered based on the normalized slope.
Trend Confirmation: The normalized slope provides additional confirmation of the strength and direction of the trend. A positive slope indicates an upward trend, while a negative slope indicates a downward trend.
Example:
Disclaimer:
Not Financial Advice: This script is provided for educational purposes only and should not be considered financial advice. Traders should conduct their own research and/or consult with a qualified financial advisor before making any investment decisions based on this script.
Risk of Loss: Trading in financial markets involves risk of loss, and past performance is not indicative of future results. Users of this script should be aware of the risks involved in trading and should only trade with capital they can afford to lose.
No Guarantees: There is no guarantee of success or profitability when using this script. Market conditions can change rapidly, and trading results may vary.
Use at Own Risk: The author of this script (UAlgo) does not assume any responsibility for losses incurred as a result of using this script. Traders use this script at their own risk and discretion.
Terms of Use: This script is subject to the terms of the Mozilla Public License 2.0. Users are encouraged to review the license terms before using or distributing the script.

Ichimoku Trader ToolkitThe Ichimoku Cloud
is a collection of technical indicators that show support and resistance levels, as well as momentum and trend direction. It does this by taking multiple averages and plotting them on the chart. It also uses these figures to compute a "cloud" which attempts to forecast where the price may find support or resistance in the future. The Ichimoku cloud was developed by Goichi Hosoda, a Japanese journalist, and published in the late 1960s.
It provides more data points than the standard candlestick chart. While it seems complicated at first glance, those familiar with how to read the charts often find it easy to understand with well-defined trading signals.
The Ichimoku Cloud is useful for day traders and others who need to make quick decisions. The cloud is often paired with other technical indicators, such as the Relative Strength Index , in order for traders to get a complete picture of resistance and support. Many traders will also look out for crossovers in order to determine when trends have reversed.
Ichimoku cloud trading requires a lot of self-discipline. This is because you have to wait for the best trade signals.
What is this Ichimoku Trader Toolkit ?
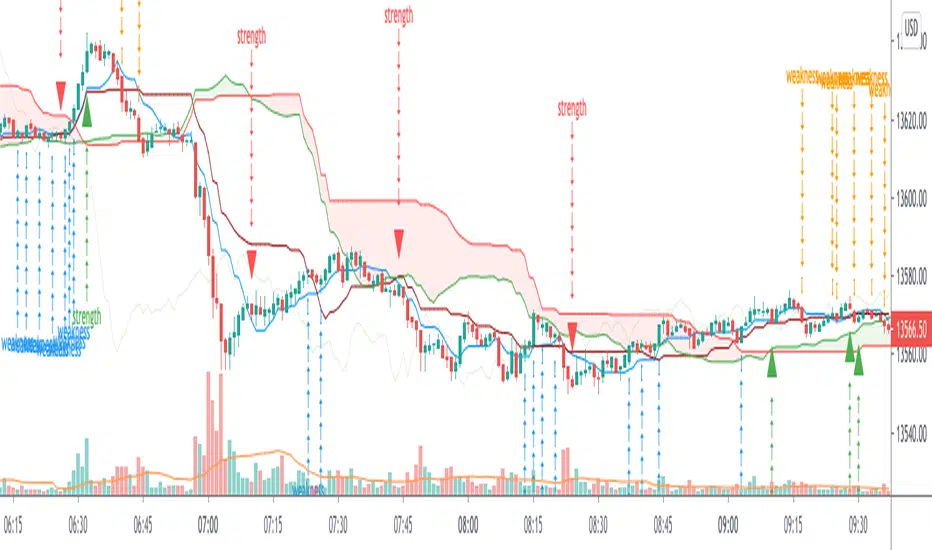
Since Ichimoku is a reliable Indicator, but its very populated on charts, Its bit complicated to find the Sign of Strength {SOS} and Sign of Weaknesses {SOW} at first glance,
The Toolkit is an attempt to make Ichimoku much more Intutive to trade and visualize the potential SOS and SOW early in the charts
What timeframes can it be used?
Any Timeframe
Provision for Alerts
Strength_alerts
Weakness_alerts
All_Alerts
How can you get access?
Private message me only, use comment box for constructive comments
ICHIMOKU MTF PROICHIMOKU KINKO HYO MTF PRO by Rohan
In the late 1930s, Goichi Hosoda, a Japanese journalist, known as Ichimoku Sanjin (“what a man in the mountain sees” in translation) created Ichimoku Kinko Hyo.
If we are to translate Ichimoku Kinko Hyo, we will get “a glance at an equilibrium chart”
It has 5 Components:
1. Kijun Sen (brown line): (Highest High + Lowest Low) / 2 over the past 26 periods.
2. Tenkan Sen (blue line): Tenkan-Sen (Conversion Line) = (Highest High + Lowest Low) / 2 over the past 9 periods.
3. Chikou Span (purple line): Present trading days closing price plotted 26 periods behind.
4. Senkou SpanA (green line): (Tenkan-Sen + Kijun-Sen) / 2, plotted 26 periods in the future.
5. Senkou SpanB (red line): (Highest High + Lowest Low) / 2 over the past 52 periods, but plotted 26 periods in the future
Why The Ichimoku Matters?
Ichimoku is an ideal visual representation of key data, based on the historical data of moving averages.
Ichimoku can be used in all time frames for any tradeable asset. Ichimoku can be used in both rising and falling markets
Trading Methods by the ICHIMOKU MTF PRO Indicator:
1. TK Crossover Candle Indicator
2. TK Crossover Lines
3. Chikou Line Display
4. Multiple Timeframes Ichimoku Support/Resistance Lines
5. Kijun Flat Line Display
How traders can ask you for access to your script:
Interested traders to send you a private message on TV to gain access
Terms and Conditions:
1. The Author/User is not responsible for anything or trades taken etc
2. Indicator is for educational purpose only

Ichimoku with Alerts (Flexible Conditions)This is the standard Ichimoku indicator with very flexible BUY and SELL conditions.
Inputs
Standard Ichimoku Inputs:
Conversion Line Periods
Base Line Periods
Lagging Span 2 Periods
Displacement
BUY Options
Crossover happens Above the Cloud : Buy when conversion line crosses over baseline above the ichimoku cloud.
Crossover happens Inside the Cloud : Buy when conversion line crosses over baseline inside the ichimoku cloud.
Crossover happens Below the Cloud : Buy when conversion line crosses over baseline below the ichimoku cloud.
Buy when price crosses over Conversion Line : Buy when price crosses over conversion line (could happen below, inside or above the cloud).
Buy when price crosses over Base Line : Buy when price crosses over base line (could happen below, inside or above the cloud).
Buy when price crosses over min of CL and BL : Buy when price crosses over min of conversion and base line pair (could happen below, inside or above the cloud).
Buy when price crosses over max of CL and BL : Buy when price crosses over max of conversion and base line pair (could happen below, inside or above the cloud).
Consecutive ups : Number of bars for the selected buy condition to stay valid in order to trigger a BUY signal/alert.
SELL Options
Note: Each of the following conditions could happen below, inside or above the cloud.
Sell with Crossunder : Sell when converison line crosses under base line.
Sell when price crosses under Conversion Line : Sell when price crosses under conversion line.
Sell when price crosses under Base Line : Sell when price crosses under base line.
Sell when price crosses under min of CL and BL : Sell when price crosses under min of conversion and base line pair.
Sell when price crosses under max of CL and BL : Sell when price crosses under max of conversion and base line pair.
Consecutive downs : Number of bars for the selected sell condition to stay valid in order to trigger a SELL signal/alert.
This indicator has pretty much every possible scenarios to use the Ichimoku indicator effectively. I have also added consecutive ups/downs input, so you can avoid false signals and trade safely.
You can combine different options together. In that case, Buy or Sell signals will be triggered if at least one of the condtions is true.
Please report the bugs you found with a screenshot of the chart. Please make sure that the time stamp is visible, and also include the inputs you selected so I can reproduce the problem and fix it.
Please provide some feedback so we can improve this indicator together.
If you have any questions, please feel free to ask.
The strategy of this indicator is available here:

Ichimoku MultiTF WillyArt v1.0.0What this indicator does
Ichimoku WillyArt turns the Ichimoku lines into angle-based momentum across multiple timeframes (W, D, 4H, 1H, 30m, 5m).
For each TF it computes the slope (angle in degrees) of:
Tenkan-sen
Kijun-sen
Senkou Span A
Senkou Span B
Angles are normalized so they’re comparable across assets and scales. You get a table with the angle per line and a quick emoji direction (↑, →, ↓), optional plots of the chosen line, and ready-to-use alerts.
Why angle?
Slope-as-degrees is an intuitive proxy for momentum/impulse:
Positive angle → line rising (bullish impulse).
Negative angle → line falling (bearish impulse).
Near zero → flat/indecisive.
Two normalization modes
ATR (default): slope / ATR. Robust across instruments; less sensitive to price level.
%Price: slope / price. More sensitive; can highlight subtle turns on low-volatility symbols.
Inputs you’ll actually care about
Timeframes: W, D, 4H, 1H, 30m, 5m (all fetched MTF, independent of chart TF).
Ichimoku lengths: Tenkan (9), Kijun (26), Span B (52) — standard defaults.
Bars for slope (ΔN): How many bars back the slope is measured. Higher = smoother, slower.
Threshold (°) for “strong”: Angle magnitude that qualifies as strong ↑/↓.
What you’ll see
Matrix/Table (top-right): For each TF, the angle (°) of Tenkan, Kijun, Span A, Span B + an emoji:
↑ above threshold, ↓ below −threshold, → in between.
Optional plots: Toggle “Plot angles” to visualize the chosen series’ angle across TFs.
Alerts included (ready to pick in “Create Alert”)
Sustained state: e.g., “Kijun 4H: strong ↑ angle” triggers while angle > threshold.
Threshold cross (one-shot): e.g., “Kijun 1H: upward threshold cross” fires on crossing.
Consensus (multi-TF): “Kijun consensus ↑ (D/4H/1H/30m/5m)” when all selected TFs align up (and the symmetric down case).
Messages are constant strings (TradingView requirement), so they compile cleanly. If you want dynamic text (current angle, threshold value, etc.), enable your own alert() calls—this script structure supports adding them.
How to use it (workflow)
Add to chart. No need to switch chart TF; the script pulls W/D/4H/1H/30m/5m internally.
Pick normalization. Start with ATR. Switch to %Price if you want more sensitivity.
Set ΔN & threshold.
Intraday momentum: try ΔN = 3–5 and threshold ≈ 4–8°.
Swing/position: ΔN = 5–9 and threshold ≈ 3–6° (with ATR).
Scan the table. Look for alignment (multiple TFs with ↑ or ↓ on Kijun/Spans).
Kijun + Span A up together → trending push.
Span B up/down → cloud baseline tilting (trend quality).
Turn on alerts that match your style: reactive cross for entries, sustained for trend follow, consensus to filter noise.
Reading tips
Kijun angle: great “trend backbone.” Strong ↑ on several TFs = higher-probability pullback buys.
Span A vs. Span B:
Span A reacts faster (momentum).
Span B is slower (structure).
When both tilt the same way, the cloud is genuinely rotating.
Mixed signals? Use higher TFs (W/D/4H) as bias, lower TFs (1H/30m/5m) for timing.
Good to know (limits & best practices)
Angles measure rate of change, not overbought/oversold. Combine with price structure and risk rules.
Extremely low volatility or illiquid symbols can produce tiny angles—%Price mode may help.
ΔN and thresholds are contextual: adapt per market (crypto vs FX vs equities).
Want me to bundle a “pro template” of alert presets (intraday / swing) and a heatmap color scale for the table? Happy to ship v2. 🚀

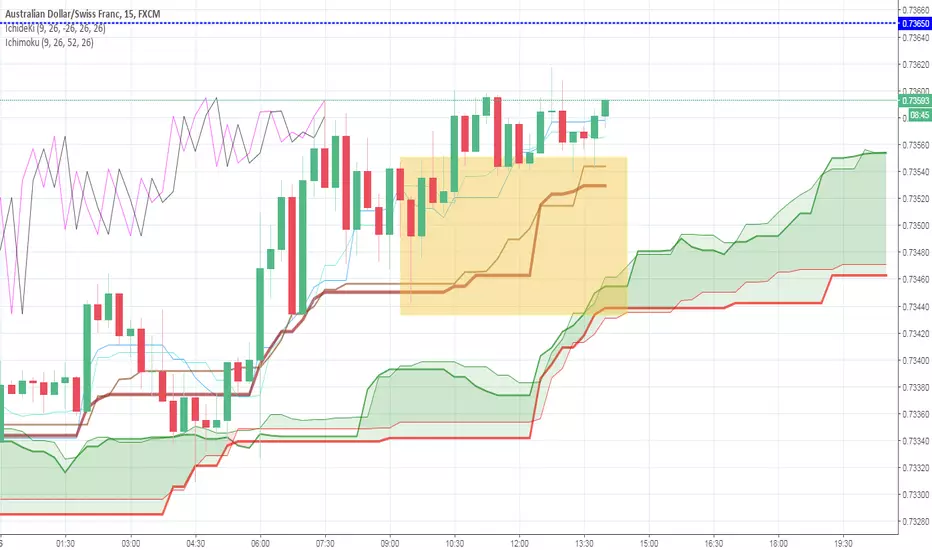
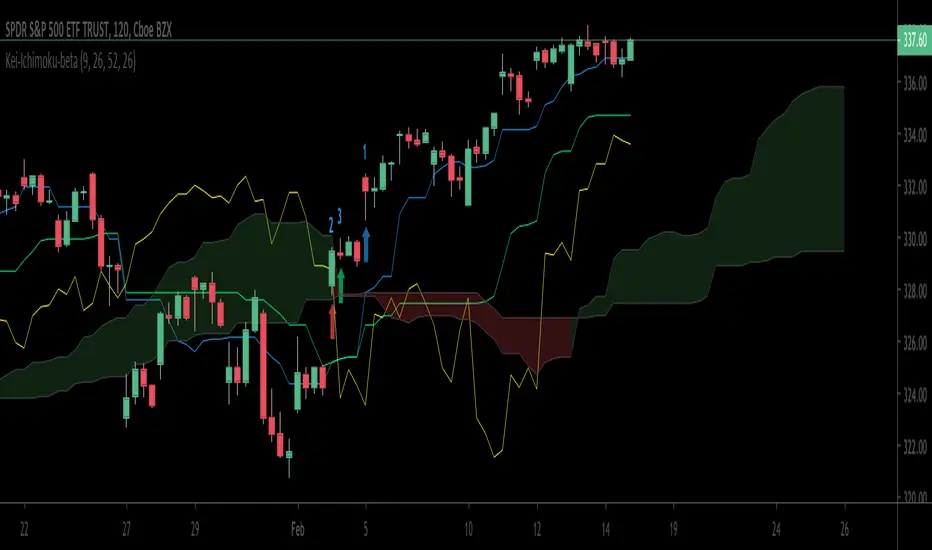
Ichimoku Kinko HyoThis indicator is adding to the original indicator Ichimoku Cloud some visual informations.
Be aware of settings that are by default 10, 30, 60, while in the original indicator, default settings are 9, 26, 52. These are commonly consider like "crypto settings".
Tenkan = blue line
Kijun = orange line
SSB = red line
This indicator display three categories of signals that are given by the Ichimoku indicator:
- tenkan / kijun crosses ;
- breaks of mid prices for the different time horizon ;
- bar coloring depending of the trend
Let's review more in deep each of these elements.
Tenkan / Kijun crosses
When the tenkan crossover the kijun, this is called gold cross and it's display by a green triangle at the bottom of the chart.
When the tenkan crossunder the kijun, this is called death cross and it's display by a red triangle at the top of the chart.
I advise to not enter long or short only on this signal because it can be fake, especially during ranges.
To confirm the signal, we need to wait for a movement of the kijun in the same side of the cross. See first arrow on the chart.
Breaks of mid prices
Ichimoku is composed of three han-le lines that displays mid-price of the last candles depending on the settings (10, 30, 60).
Tenkan show us the mid-price of the last 10 candles (short term)
Kijun show us the mid-price of the last 30 candles (mid term)
SSB show us the mid-price of the last 60 candles (long term)
Break of tenkan by the price is the first signal that Ichimoku gives us before a reversal of the trend. This signal is display by a blue triangle.
Then, happened the break of kijun line follow by the break of the SSB. These are display respectively by an orange triangle and a red triangle.
Same advise, don't enter long or short only on break of these lines.
However, tenkan and kijun breaks can be used as exit point.
Bar coloring
The bar coloring display the strength of the trend:
- green candle: strong bullish trend - this happen when the current price is above tenkan, kijun and SSB ;
- blue candle: potential starting of a bullish trend - this happen when the current price is above tenkan and kijun but below the SSB ;
- no colored candle: no trend, market is in a range - this happen when the current price is above tenkan and below kijun and SSB or when the current price is below tenkan and above kijun and SSB ;
- orange candle: potential starting of a bearish trend - this happen when the current price is below tenkan and kijun but above SSB ;
- red candle: strong bearish trend - this happen when the current price is below tenkan, kijun and SSB
How to use to enter / exit trades
First of all, we need confirmations to enter in the side of the trend.
The first signal that the indicator gives us is the break of tenkan, follow by the break of kijun. Candles becomes blue / orange depending of the side.
Then, we wait for a cross of tenkan and kijun. This cross has to be confirmed by a movement of kijun. A flat kijun tell us this is a fake cross.
When the movement of kijun happened in the same side of the cross it is possible to enter a trade if you are aggresive.
Otherwise, you can wait for the third signal to take place: break of SSB, candle become green / red, depending on the side.
You can then enter a trade.
Then hold the position and wait to exit for break of tenkan or kijun, depending on your horizon (short / mid term).
If you have other questions or some features that are missing, pm me. Thanks.

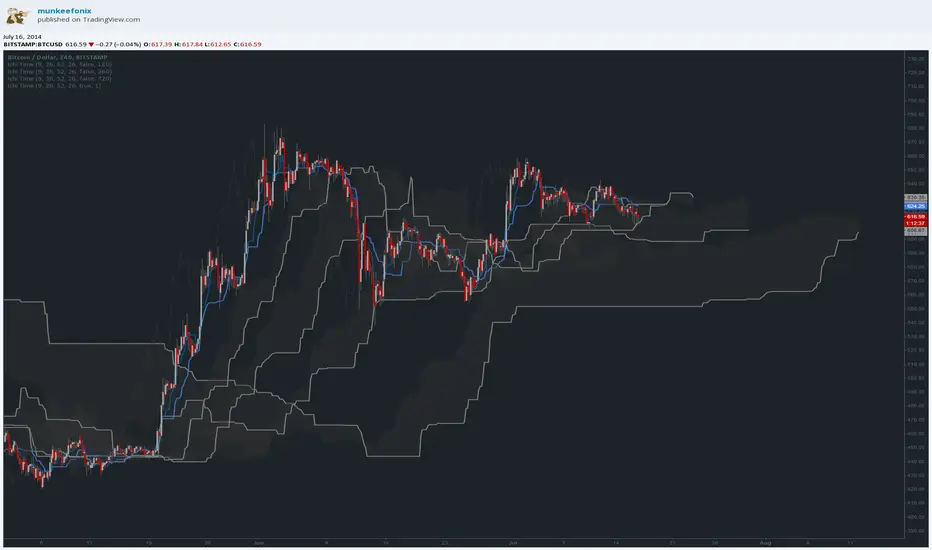
Ichimoku Cloud & TK FuturesThis is vanilla Ichimoku Cloud with a little extra.
This script offers a future insight into where the Tenkan-Sen and Kijun-Sen will be plotted to in the future.
Enable up to 6 future plot points for the Tenkan-Sen
Enable up to 12 future plot points for the Kijun-Sen
*NOTE* - If a new high or low is created, this will alter future plot points.
The TK Futures were developed with help from gyro . Thank you.
I adapted the Ichimoku Cloud script that was originally created by ChrisMoody . (CM Enhanced Ichimoku Cloud V5) Thank you.

Ichimoku Cloud Smooth OscillatorThe Ichimoku Cloud is a powerful indicator to track trends. By smoothing it and placing it in a separate chart, the signals can be easily identified without cluttering the display. The bold line is the signal: green indicates a buy signal while red indicates a sell signal. Gray represents a possible change in direction and the lack of a trend. The thinner line is the width of the cloud which can be used to further determine the direction.

Ichimoku+Based on the ichimoku cloud system, this indicator gives two presets: Standard (9/26/52/26) and Crypto (20/60/120/30).
This also shows on a chart where Tenkan-Kijun cross happens and when a Kumo Twist happens.

Ichimoku Cloud betaThis is a test version of Ichimoku, instead of plot chiko span backward 26 bars, it draws price at 26 bars backward at the current bar.
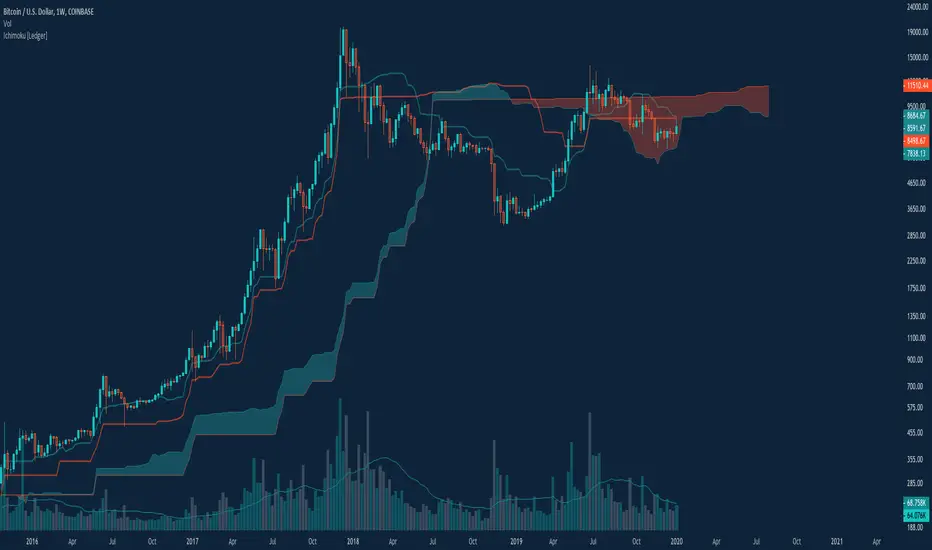
Ichimoku Cloud with Presets [Ledger]This is not too innovative, but I look at cloud setups with single and doubled settings, using both the traditional inputs for legacy markets, and "24/7" formatted inputs initially established by my friend CarpeNoctom and popularized for crypto markets. This makes those inputs a toggle that's easy to adjust. That's about it. Otherwise, it's the classic Ichimoku cloud. This is a fork of 's iteration, with my own flare and some minor adjustments. I have some ideas I would eventually like to include with this, but I've been using it this way for a long time and figure I should publish it.

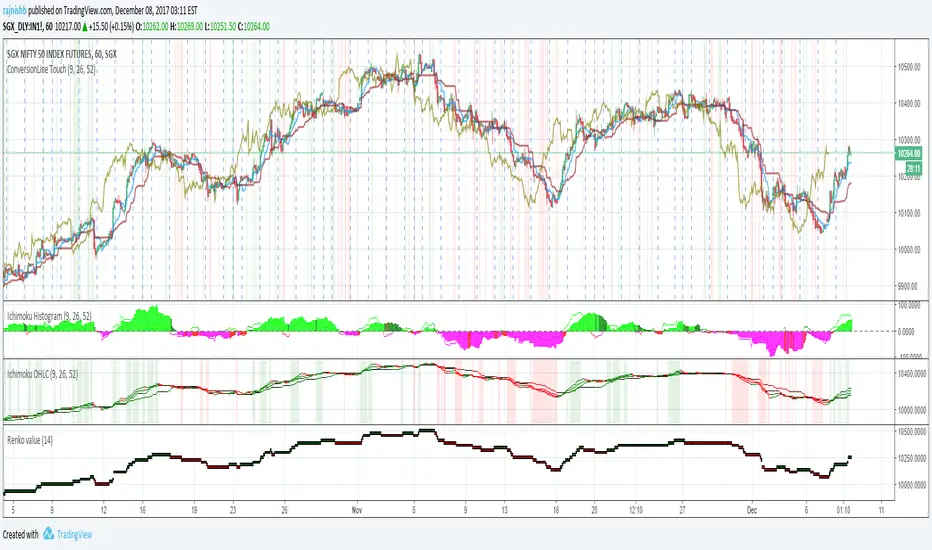
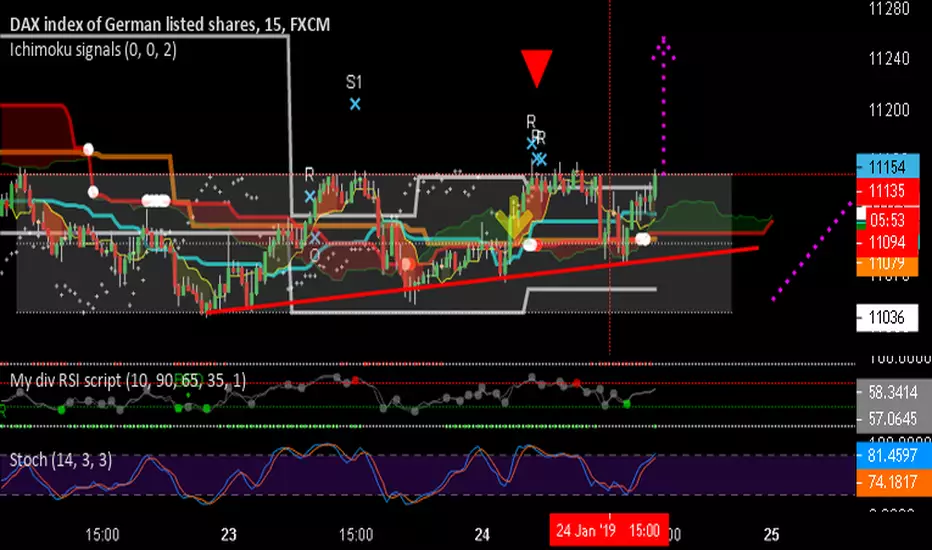
Ichimoku signals by Jean-Philippe COQINDICATORS:
Show Yellow zone when oversold/overbought
Show splits : white when to come, yellow when occurs, red when flat with ssb, blue when flat with ssb and kj
Show probable range when appears in white lines
Show last higher highs lower lows in orange lines
Show probable next Kj values in thin aqua lines
checkChikou = blue diamond on price when close to chikou in TF or upper one
checkVol = show "V" when volume is higher than last 9 periods avg
checkRot = show "Z" when potential partial rotation in range is at work
checkHaram = take Harami pattern into account
SIGNALS (when ichimoku meet candle patterns)
L/H = rebound signals on higher highs / Lower Lows
C = potential rebound on overbought oversold zone
R = rebound signal on range edges
P = pullback rebound after break out of probable range
K = rebound on Kj in a trend (out of range)

Ichimoku With SignalsA variation on Ichimoku Cloud that has markers for strong/neutral/weak bullish/bearish signals.

Ichimoku on closing price without current bar @bhutanoThis is the "Ichimoku" rivisited.
The current bar is not considerated on the plotting (so less chance to confusion) and the averages are calculated on the closing prices. It seems to be more precise then the original one.
Leave me a comment please based on your experience