Ichimoku Cross Indicator [Mehdihz]This script shows tenken & kijen lines position to better detection of crosses.
"ichimoku" için komut dosyalarını ara


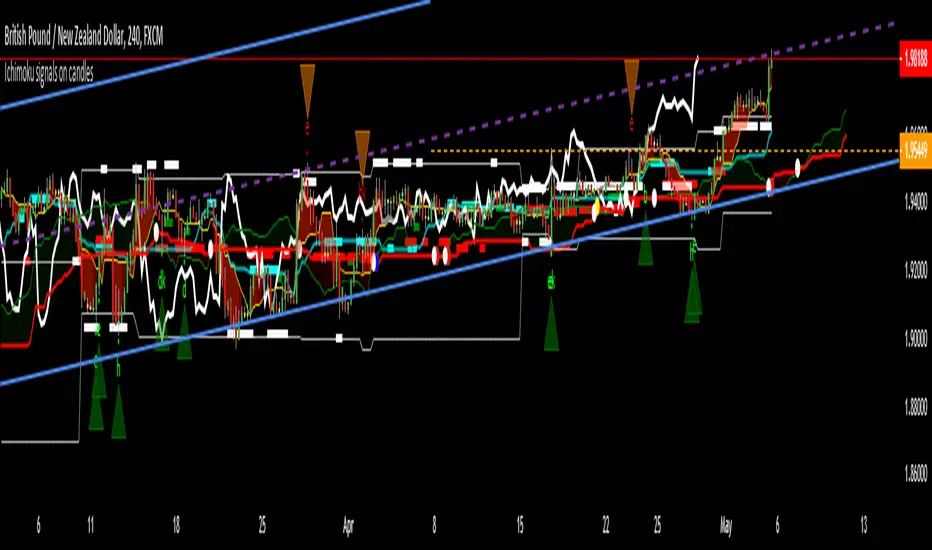
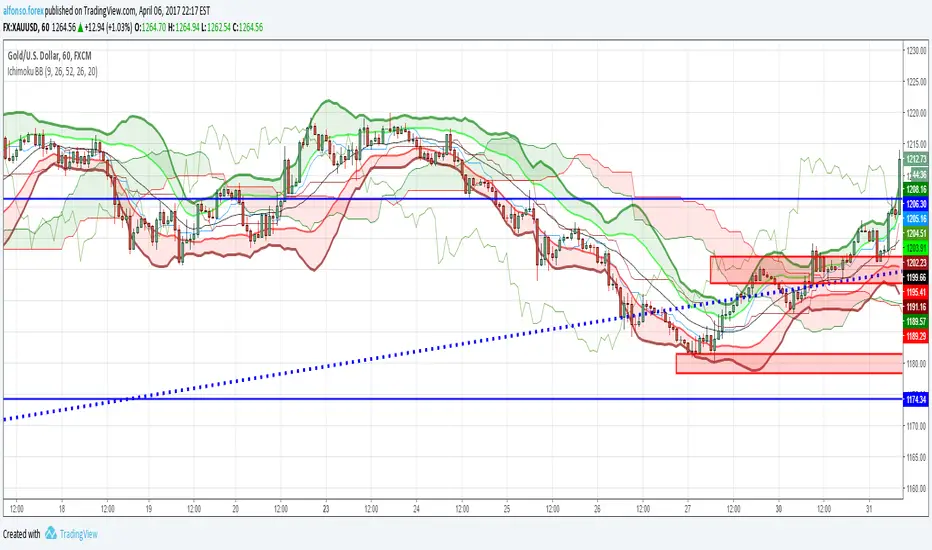
Ichimoku-Hausky_v2.1Made a little update to my trading system. This system is made so that you can easily follow the trend and know when to get out. You still have to know basic market structure to find a good entry.
NB!! I see that i placed the entry wrong on the example, you have too wait for the EMA to go below the MA :)
I have posted the right one at the bottom.
Take profit can be set at last low or you can use trail stop on the EMA, MA, Kijun-sen or Tenkan-sen.
Example rules:
Buy:
IF Market is in a trend or are possibly close to break out of range
THEN see if price has closed above cloud
IF price has closed above cloud
THEN see if EMA has crossed above MA
IF EMA has crossed above MA
THEN buy or wait for pullback
Sell:
IF Market is in a trend or are possibly close to break out of range
THEN see if price has closed below cloud
IF price has closed below cloud
THEN see if EMA has crossed below MA
IF EMA has crossed below MA
THEN buy or wait for pullback

Ichimoku-Hausky_v2 Trading SystemMade a new version of my trading system. I have added a cloud that is made with 45 EMA and 104 MA. Now you can choose where to set trailing stop. As shown in the example you set trailing stop under the cloud.

Ichimoku + Multi-Trend DashboardIchimoku + Multi-Trend Dashboard
A professional multi-indicator trend analyzer that fuses Ichimoku Cloud with volume, momentum, and price-based confirmations — all visualized in a dynamic dashboard.
🔍 Overview
The OSPL Ichimoku + Multi-Trend Dashboard is a comprehensive market-structure and momentum visualization tool built for serious traders who value clarity, precision, and confirmation.
It combines the powerful Ichimoku Cloud system with VWMA, SuperTrend, RSI, and VWAP to provide a 360-degree view of market direction, trend strength, and trade zones.
This indicator allows traders to instantly read multi-indicator alignment through a color-coded dashboard, helping filter out noise and improve timing for entries and exits.
⚙️ Core Features
🟢 1. Ichimoku Cloud Framework
Displays all major Ichimoku elements: Tenkan-Sen, Kijun-Sen, Senkou Span A & B (Kumo Cloud).
Detects Bullish and Bearish Tenkan-Kijun Crossovers.
Identifies Cloud Trend Bias (price above, below, or inside the Kumo).
Marks Buy / Sell / Wait Zones automatically based on price structure and line alignment.
⚡ 2. Multi-Indicator Confirmation Layer
Enhance trend validation using:
VWMA (Volume-Weighted Moving Average): Measures volume-driven price trend.
SuperTrend: Uses ATR to confirm trend direction and detect reversals.
RSI (Relative Strength Index): Gauges market momentum — above 50 indicates bullish bias, below 50 bearish.
VWAP (Volume-Weighted Average Price): Tracks institutional and fair value price zones.
Each of these indicators contributes to a synchronized dashboard view that instantly reveals market bias.
📊 3. Interactive Dashboard Display
Clean, modern bottom-right table summarizing indicator values and their current trend status.
Color-coded trend map:
🟢 Green = Bullish 🔴 Red = Bearish 🟡 Yellow = Neutral / Wait
Quick visual reference — ideal for active traders who rely on multiple confirmations before taking trades.
🌥 4. Kumo Visualization
Smoothly shaded Ichimoku Cloud fill highlights dominant market phase (bullish or bearish).
Dynamic transition coloring enhances visibility of potential breakouts or reversals.
🎯 How to Use
Use the dashboard as a trend alignment and confirmation tool:
Bullish Confluence Example:
Price above Kumo Cloud
Tenkan-Sen > Kijun-Sen
RSI > 50
SuperTrend below price
VWMA and VWAP trending upward
Bearish Confluence Example:
Price below Kumo Cloud
Tenkan-Sen < Kijun-Sen
RSI < 50
SuperTrend above price
VWMA and VWAP trending downward
When most indicators align in the same direction, the system provides high-probability trade zones.
It can be used across all timeframes, from intraday scalping to multi-day swing trading.
🧩 Why Use This Indicator
✅ Filters false signals by combining multiple trend tools.
✅ Eliminates the need to switch between multiple indicators.
✅ Offers an at-a-glance visual assessment of overall market bias.
✅ Adaptable to any asset: stocks, indices, forex, commodities, or crypto.
✅ Ideal for traders using trend-following, momentum, or confirmation-based strategies.
🧠 Professional Tips
Combine the dashboard signals with price action and volume breakouts for enhanced accuracy.
Use higher timeframe Ichimoku structure as a directional filter (e.g., check the 1-hour trend while trading on 15-minute).
Apply ATR-based stop loss and multi-timeframe confluence to further strengthen entries.
Works exceptionally well with Heikin Ashi candles for smoother visual trends.
💡 Suggested Use Cases
Intraday & Swing Trading
Trend Continuation & Reversal Identification
Multi-Indicator Confirmation System
Dashboard-Style Strategy Testing and Backtesting
⚠️ Disclaimer
This indicator is designed for educational and analytical purposes only.
It is not financial advice and does not guarantee profitability.
Always perform independent analysis and apply prudent risk management before executing trades.

Ichimoku Cloud +Ichimoku Cloud Plus - Advanced Technical Analysis Indicator
Ichimoku Cloud Plus is an advanced technical analysis tool that combines the traditional Ichimoku Cloud system with Pearson correlation analysis and multi-timeframe momentum tracking. This innovative approach provides traders with a comprehensive view of market trends, momentum, and potential reversal points across multiple time frames.
Core Components
Enhanced Ichimoku Cloud Analysis
The traditional Ichimoku Cloud components have been preserved and enhanced with customizable visual parameters:
The indicator includes:
- Conversion Line (Tenkan-sen) - Short-term trend identifier
- Base Line (Kijun-sen) - Medium-term trend identifier
- Leading Span A and B (Senkou Span A and B) - Future cloud projections
- Lagging Span (Chikou Span) - Historical price momentum confirmation
The cloud (Kumo) formations provide dynamic support and resistance levels, with color-coding to instantly identify bullish and bearish market conditions.
Pearson Correlation Analysis
A sophisticated Pearson correlation coefficient calculation has been integrated to provide statistical validation of trend strength and direction. This component:
- Calculates correlation between price movement and time
- Provides real-time correlation coefficients
- Identifies trend strength through correlation thresholds
- Generates signals for trend changes and potential reversals
Multi-Timeframe Momentum Tracking
The indicator incorporates a unique multi-timeframe analysis system that:
- Displays momentum calculations across five timeframes (15m, 30m, 1h, 4h, 1d)
- Provides percentage-based momentum values
- Includes volatility adjustment capabilities
- Offers volume-weighted calculations for enhanced accuracy
Advanced Features
Statistical Analysis Panel
A comprehensive statistical panel provides real-time analysis including:
- Current Pearson coefficient value
- Correlation strength classification
- Trend direction identification
- Analysis period information
Dynamic Alert System
The indicator includes sophisticated alert conditions for:
- Bearish trend initiation (positive correlation threshold breach)
- Bullish trend initiation (negative correlation threshold breach)
- Trend direction changes (zero-line crossovers)
Visual Optimization
Advanced visualization features include:
- Customizable color schemes for all components
- Adjustable label sizes and positions
- Transparency controls for better chart visibility
- Warning indicators for potential trend weakening
Technical Implementation
The indicator combines multiple calculation methods:
- Donchian Channel calculations for Ichimoku components
- Pearson correlation coefficient computation with customizable periods
- EMA smoothing for momentum calculations
- Volume-weighted averaging capabilities
- Volatility adjustment mechanisms
Trading Applications
This indicator is particularly effective for:
1. Trend Direction Confirmation
- Multiple timeframe analysis provides comprehensive trend validation
- Pearson correlation adds statistical confidence to trend identification
- Ichimoku cloud formations confirm support and resistance levels
2. Entry and Exit Point Identification
- Cloud breakouts combined with correlation strength indicate potential entry points
- Multi-timeframe momentum alignment helps identify high-probability trades
- Warning indicators assist in timing market exits
3. Risk Management
- Dynamic support and resistance levels from the cloud
- Statistical trend strength measurement
- Multi-timeframe confirmation reduces false signals
Performance Considerations
The indicator uses efficient calculations to maintain good performance while providing comprehensive analysis. The smoothing parameters and analysis periods can be adjusted to balance between responsiveness and reliability.
Future Applications and Research
This combination of indicators opens possibilities for:
- Machine learning integration for pattern recognition
- Additional statistical measures for trend validation
- Enhanced alert systems based on multiple condition combinations
- Further optimization of calculation methods
The innovative combination of traditional Ichimoku analysis with modern statistical methods and multi-timeframe momentum tracking provides traders with a powerful tool for market analysis and decision-making.

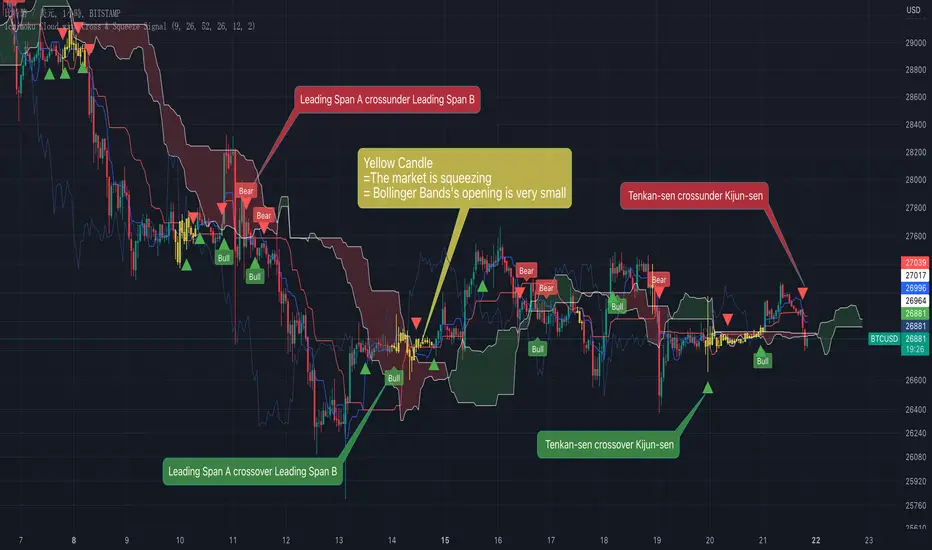
Ichimoku Cloud with Cross & Squeeze SignalIchimoku cloud is one of my favorite indicators, but the traditional Ichimoku cloud indicator does not add cross signals and squeeze signals, so I added them for it.
In the Ichimoku cloud indicator, there are two cross signals worth watching:
1. Tenkan-sen crosses Kijun-sen
2. Leading Span A crosses Leading Span B
I mark the crossing signals of Tenkan-sen and Kijun-sen with a triangle symbol, a red triangle means crossunder, and a green triangle means crossover.
I also show the Leading Span A and Leading Span B cross signals, showing "Bull" crossing over and "Bear" crossing under.
Also, when the market is squeezed, I show it with a yellow candle, and my definition of a market squeeze is: Bollinger bands' bandwidth is less than a certain ATR.
So when you see a yellow candle, it means the Bollinger Bands' opening is very small and the market is in squeeze.
How to use this indicator?
1. When you see a yellow candle, it means that the market is being squeezed, and you can consider entering a trade.
2. Through the cross signals of Tenkan-sen and Kijun-sen and Leading Span A and Leading Span B, it can assist in judging whether to go long or short.
3.If the market is squeezing, you can observe that whether the price is above or below Tenkan-sen & Kijun-sen, go long if above, go short if below.
========== 中文說明 Chinese explanation ==========
Ichimoku cloud 是我很喜歡的指標之一,但是傳統 Ichimoku cloud 指標並沒有加上交叉訊號以及擠壓訊號,因此我替它加上去了。
在 Ichimoku cloud 指標中,有兩個值得關注的交叉訊號:
1. Tenkan-sen 與 Kijun-sen 交叉
2.Leading Span A 與 Leading Span B 交叉
我將 Tenkan-sen 與 Kijun-sen 的交叉訊號,用三角形符號標示出來,紅色三角形表示向下交叉,綠色三角形表示向上交叉。
我將Leading Span A 與 Leading Span B 交叉訊號也顯示出來,向上交叉顯示「Bull」,向下交叉顯示「Bear」。
另外,當市場擠壓時,我將它用黃色蠟燭顯示,我對於市場擠壓的定義是:布林帶小於特定的 ATR。
所以當你看到黃色蠟燭時,表示布林帶小於特定的ATR,此時市場正處於擠壓當中。
如何使用該指標?
1.看見黃色蠟燭的時候表示市場正在擠壓,這時可以考慮進行交易
2.透過 Tenkan-sen 與 Kijun-sen 以及 Leading Span A 與 Leading Span B的交叉訊號,可以輔助判斷做多或做空。
3.當市場擠壓時,我建議觀察價格是否在 Tenkan-sen 與 Kijun-sen 之上,價格在 Tenkan-sen 與 Kijun-sen 之上做多,在 Tenkan-sen 與 Kijun-sen 之下做空。
Ichimoku Wave Oscillator with Custom MAIchimoku Wave Oscillator with Custom MA - Pine Script Description
This script uses various types of moving averages (MA) to implement the concept of Ichimoku wave theory for wave analysis. The user can select from SMA, EMA, WMA, TEMA, SMMA to visualize the difference between short-term, medium-term, and long-term waves, while identifying potential buy and sell signals at crossover points.
Key Features:
MA Type Selection:
The user can select from SMA (Simple Moving Average), EMA (Exponential Moving Average), WMA (Weighted Moving Average), TEMA (Triple Exponential Moving Average), and SMMA (Smoothed Moving Average) to calculate the waves. This script is unique in that it combines TEMA and SMMA, distinguishing it from other simple moving average-based indicators.
TEMA (Triple Exponential Moving Average): Best suited for capturing short-term trends with quick responsiveness.
SMMA (Smoothed Moving Average): Useful for identifying long-term trends with minimal noise, providing more stable signals.
Wave Calculations:
The script calculates three waves: Wave 9-17, Wave 17-26, and Wave 9-26, each of which analyzes different time horizons.
Wave 9-17 (blue): Primarily used for analyzing short-term trends, ideal for detecting quick changes.
Wave 17-26 (red): Used to analyze medium-term trends, providing a more stable market direction.
Wave 9-26 (green): Represents long-term trends, suitable for understanding broader trend shifts.
Baseline (0 Line):
Each wave is visualized around the 0 line, where waves above the line indicate an uptrend and waves below the line indicate a downtrend. This allows for easy identification of trend reversals.
Crossover Signals:
CrossUp: When Wave 9-17 (short-term wave) crosses Wave 17-26 (medium-term wave) upward, it is considered a buy signal, indicating a potential upward trend shift.
CrossDown: When Wave 9-17 (short-term wave) crosses Wave 17-26 downward, it is considered a sell signal, indicating a potential downward trend shift.
Background Color for Signal:
The script visually highlights the signals with background colors. When a buy signal occurs, the background turns green, and when a sell signal occurs, the background turns red. This makes it easier to spot reversal points.
Calculation Method:
The script calculates the difference between moving averages to display the wave oscillation. Wave 9-17, Wave 17-26, and Wave 9-26 represent the difference between the moving averages for different time periods, allowing for analysis of short-term, medium-term, and long-term trends.
Wave 9-17 = MA(9) - MA(17): Represents the difference between the short-term moving averages.
Wave 17-26 = MA(17) - MA(26): Represents the difference between medium-term moving averages.
Wave 9-26 = MA(9) - MA(26): Provides insight into the long-term trend.
This calculation method effectively visualizes the oscillation of waves and helps identify trend reversals at crossover points.
Uniqueness of the Script:
Unlike other moving average-based indicators, this script combines TEMA (Triple Exponential Moving Average) and SMMA (Smoothed Moving Average) to capture both short-term sensitivity and long-term stability in trends. This duality makes the script more versatile for different market conditions.
TEMA is ideal for short-term traders who need quick signals, while SMMA is useful for long-term investors seeking stability and noise reduction. By combining these two, this script provides a more refined analysis of trend changes across various timeframes.
How to Use:
This script is effective for trend analysis and reversal detection. By visualizing the crossover points between the waves, users can spot potential buy and sell signals to make more informed trading decisions.
Scalping strategies can rely on Wave 9-17 to detect quick trend changes, while those looking for medium-term trends can analyze signals from Wave 17-26.
For a broader market overview, Wave 9-26 helps users understand the long-term market trend.
This script is built on the concept of wave theory to anticipate trend changes, making it suitable for various timeframes and strategies. The user can tailor the characteristics of the waves by selecting different MA types, allowing for flexible application across different trading strategies.
Ichimoku Wave Oscillator with Custom MA - Pine Script 설명
이 스크립트는 다양한 이동 평균(MA) 유형을 활용하여 일목 파동론의 개념을 기반으로 파동 분석을 시도하는 지표입니다. 사용자는 SMA, EMA, WMA, TEMA, SMMA 중 원하는 이동 평균을 선택할 수 있으며, 이를 통해 단기, 중기, 장기 파동 간의 차이를 시각화하고, 교차점에서 상승 및 하락 신호를 포착할 수 있습니다.
주요 기능:
이동 평균(MA) 유형 선택:
사용자는 SMA(단순 이동 평균), EMA(지수 이동 평균), WMA(가중 이동 평균), TEMA(삼중 지수 이동 평균), SMMA(평활 이동 평균) 중 하나를 선택하여 파동을 계산할 수 있습니다. 이 스크립트는 TEMA와 SMMA의 독창적인 조합을 통해 기존의 단순한 이동 평균 지표와 차별화됩니다.
TEMA(삼중 지수 이동 평균): 빠른 반응으로 단기 트렌드를 포착하는 데 적합합니다.
SMMA(평활 이동 평균): 장기적인 추세를 파악하는 데 유용하며, 노이즈를 최소화하여 안정적인 신호를 제공합니다.
파동(Wave) 계산:
이 스크립트는 Wave 9-17, Wave 17-26, Wave 9-26의 세 가지 파동을 계산하여 각각 단기, 중기, 장기 추세를 분석합니다.
Wave 9-17 (파란색): 주로 단기 추세를 분석하는 데 사용되며, 빠른 추세 변화를 포착하는 데 유용합니다.
Wave 17-26 (빨간색): 중기 추세를 분석하는 데 사용되며, 좀 더 안정적인 시장 흐름을 보여줍니다.
Wave 9-26 (녹색): 장기 추세를 나타내며, 큰 흐름의 방향성을 파악하는 데 적합합니다.
기준선(0 라인):
각 파동은 0 라인을 기준으로 변동성을 시각화합니다. 0 위에 있는 파동은 상승세, 0 아래에 있는 파동은 하락세를 나타내며, 이를 통해 추세의 전환을 쉽게 확인할 수 있습니다.
파동 교차 신호:
CrossUp: Wave 9-17(단기 파동)이 Wave 17-26(중기 파동)을 상향 교차할 때, 상승 신호로 간주됩니다. 이는 단기적인 추세 변화가 발생할 수 있음을 의미합니다.
CrossDown: Wave 9-17(단기 파동)이 Wave 17-26(중기 파동)을 하향 교차할 때, 하락 신호로 해석됩니다. 이는 시장이 약세로 돌아설 가능성을 나타냅니다.
배경 색상 표시:
교차 신호가 발생할 때, 상승 신호는 녹색 배경, 하락 신호는 빨간색 배경으로 시각적으로 강조되어 사용자가 신호를 쉽게 인식할 수 있습니다.
계산 방식:
이 스크립트는 이동 평균 간의 차이를 계산하여 각 파동의 변동성을 나타냅니다. Wave 9-17, Wave 17-26, Wave 9-26은 각각 설정된 주기의 이동 평균(MA)의 차이를 통해, 시장의 단기, 중기, 장기 추세 변화를 시각적으로 표현합니다.
Wave 9-17 = MA(9) - MA(17): 단기 추세의 차이를 나타냅니다.
Wave 17-26 = MA(17) - MA(26): 중기 추세의 차이를 나타냅니다.
Wave 9-26 = MA(9) - MA(26): 장기적인 추세 방향을 파악할 수 있습니다.
이러한 계산 방식은 파동의 변동성을 파악하는 데 유용하며, 추세의 교차점을 통해 상승/하락 신호를 잡아냅니다.
스크립트의 독창성:
이 스크립트는 기존의 이동 평균 기반 지표들과 달리, TEMA(삼중 지수 이동 평균)와 SMMA(평활 이동 평균)을 함께 사용하여 짧은 주기와 긴 주기의 트렌드를 동시에 파악할 수 있도록 설계되었습니다. 이를 통해 단기 트렌드의 민감한 변화와 장기 트렌드의 안정성을 모두 반영합니다.
TEMA는 단기 트레이더에게 빠르고 민첩한 신호를 제공하며, SMMA는 장기 투자자에게 보다 안정적이고 긴 호흡의 트렌드를 파악하는 데 유리합니다. 두 지표의 결합으로, 다양한 시장 환경에서 추세의 변화를 더 정교하게 분석할 수 있습니다.
사용 방법:
이 스크립트는 추세 분석과 변곡점 포착에 효과적입니다. 각 파동 간의 교차점을 시각적으로 확인하고, 상승 또는 하락 신호를 포착하여 매매 시점 결정을 도울 수 있습니다.
스캘핑 전략에서는 Wave 9-17을 주로 참고하여 빠르게 추세 변화를 잡아내고, 중기 추세를 참고하고 싶은 경우 Wave 17-26을 사용해 신호를 분석할 수 있습니다.
장기적인 시장 흐름을 파악하고자 할 때는 Wave 9-26을 통해 큰 트렌드를 확인할 수 있습니다.
이 스크립트는 파동 이론의 개념을 기반으로 시장의 추세 변화를 예측하는 데 유용하며, 다양한 시간대와 전략에 맞추어 사용할 수 있습니다. 특히, 사용자가 선택한 MA 유형에 따라 파동의 특성을 변화시킬 수 있어, 여러 매매 전략에 유연하게 대응할 수 있습니다.

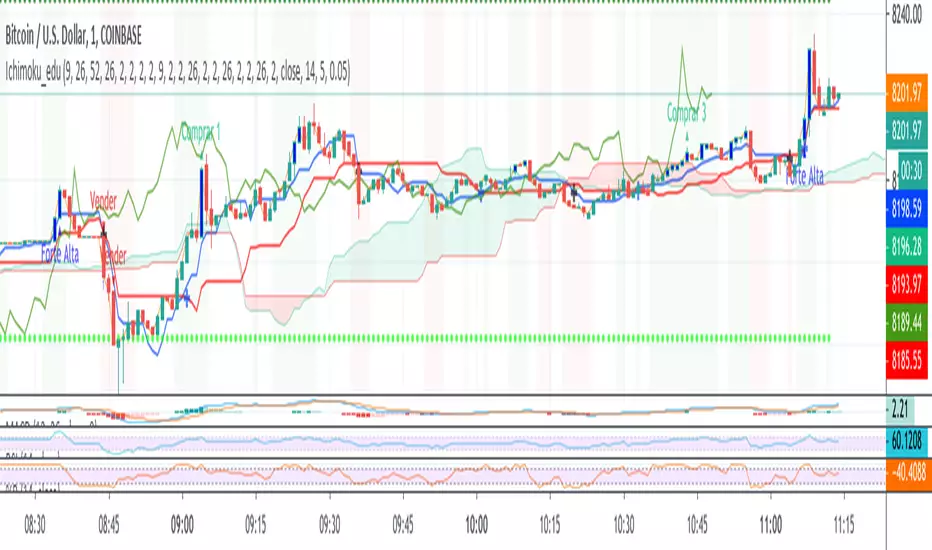
Ichimoku Cloud conversion/base line crossIchimoku conversion/base line crossover to determine trade entrances and exits. Compare crossover point to relationship with the Ichimoku cloud (under, over or within) to determine strength of signal.
Ichimoku OscillatorIchimoku trading signals mapped to an oscillator.
Primarily to indicate bullish and bearish trends.
Forked from:
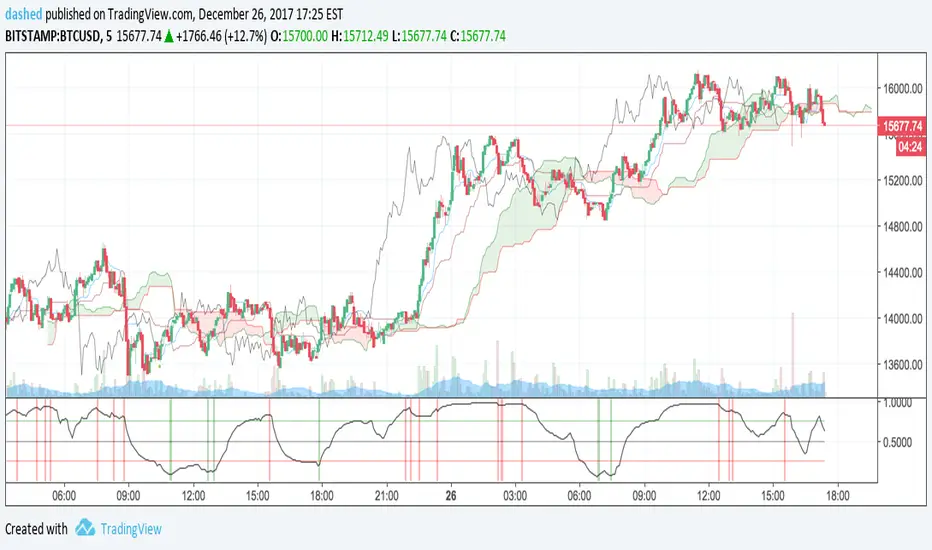

Ichimoku Cloud and other signals By Eduardo_GuimaraesIchimoku Cloud and other signals By Eduardo_Guimaraes

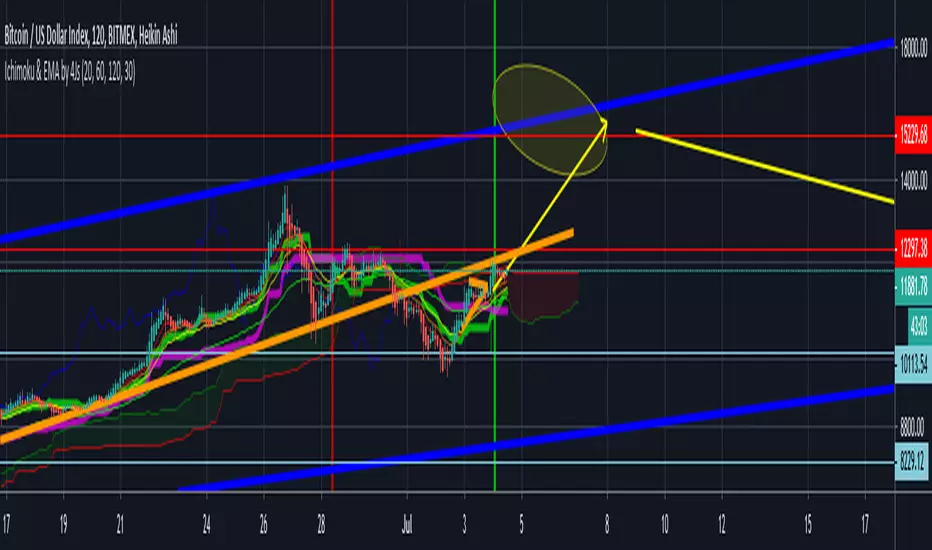
Ichimoku & EMA by 4JsIchimoku & EMA combined with arrow signaling for ichi (tk cross overs) and EMA (buy or sell signals)
Ichimoku + Moving Average + Bollinger Bands Ichimoku
Moving Average
Bollinger Bands
golden death silver cross

Ichimoku Cloud Multiple TimeFrames + H&L Ichimoku Cloud with 3 different TimeFrames + H&L of TimeFrame to TradingSessions

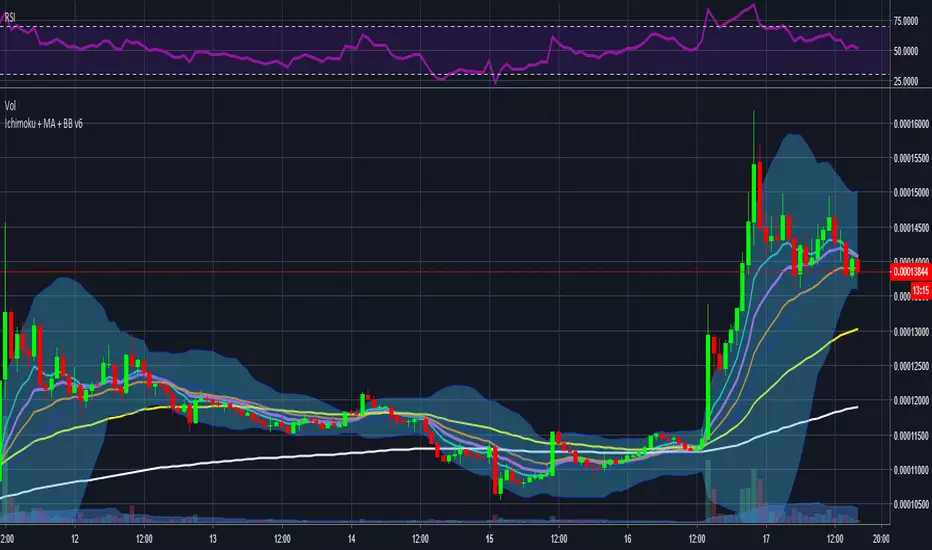
Ichimoku + Moving Average + Bollinger Bands v6Ichimoku cloud + bollinger bands + ema in one single script

Ichimoku Cloud - Stays on 4 hourichimoku cloud that does not leave the 4 hour + doesnt show up at all above 4 hour

Ichimoku And DD Bollinger BandsIchimoku System Plus Double Bolliner Bands
Made in Mexico City with Love.
Alexmoku Genesis v0.2.6 — Runtime BulletproofAlexmoku Genesis v0.2.6 – Reinventing Ichimoku with Precision and Intelligence
Built by Alex • Engineered for traders who demand more than lagging clouds
🔬 Overview
Alexmoku Genesis is a ground-up reimagining of the traditional Ichimoku system — retaining its philosophical foundations of harmony, balance, and structure, while infusing it with modern logic, advanced volatility modeling, and AI-aligned signal classification.
This is not your grandfather’s Ichimoku. Genesis transforms it into a forward-sensing, volatility-aware system that adapts in real time and guides discretionary and algorithmic traders alike with smarter signals, predictive structure, and built-in trade intelligence.
⚙️ Core Enhancements
📐 Volatility-Responsive Smoothing
Tenkan-sen and Kijun-sen lengths are dynamically adjusted based on recent price volatility (ATR-based).
Prevents overreaction in choppy markets and improves responsiveness during strong trends.
🌀 Adaptive Cloud Projection
Span A and Span B are still projected 52 periods forward — but cloud width adapts to market rhythm, not just static values.
🕵️ Enhanced Chikou Span (CKS+)
Chikou logic is upgraded to emphasize structure interaction, not just simple price overlay.
Useful for identifying support/resistance echoes and divergence validation.
🌐 Multi-Timeframe Cloud Awareness (Genesis Core)
Internal alignment checks between higher and lower timeframe Kumo positioning.
Future module support for overlaying MTF clouds.
🔖 Signal Classifier Engine (Experimental)
Each major structure event is tagged with signal intent:
📦 prep
🚀 launch
🔁 reversion
🪤 trap
Enables faster discretionary reads or future automation.
🧠 Trust Score Logic (Coming soon)
Future versions will assign numerical trust scores (1–10) to trade setups based on confluence.
🧰 Settings
🔧 Volatility Scaling Factor – Adjusts how reactive the indicator is to volatility. Default: 300.
🌫 Displacement (Kumo) – Cloud projection forward. Default (and required): 52.
⛅ Cloud Display Toggle – Show/hide Kumo visuals without affecting logic.
⚡️ Future expansion modules already scaffolded (MTF overlays, color-coded signal classifiers, Trust Score engine, etc.)
🧘 Philosophy Behind the System
"This isn’t just about catching runners — it’s about becoming the kind of person who can trade with clarity, peace, and precision."
Alexmoku Genesis reflects the W.E.A.L.T.H. System's holistic philosophy:
Wealth
Engineered
Algorithmic
Leveraged
Trading
Holistically
Trading isn't just a strategy. It's a mirror. Genesis is designed to train both your execution and your awareness.
⚠️ Disclaimer
This tool is designed for experienced technical traders and is still in active development. Use judgment and proper risk management. This is not financial advice.
