Dual SuperTrend, Ichimoku and DMI Color Weighted by DGTThis study interprets SuperTrend with Ichimoku Cloud, one of the popular technical analysis indicator, and interprets Directional Movement (DMI), which is another quite valuable technical analysis indicator.
Then combines the interpreted SuperTrend with interpreted Directional Movement (DMI) and Volume Based Colored Bars indicator created by Kıvaç ÖZBİLGİÇ (permission has been granted from the author)
Here are details of the concept applied
1- SuperTrend Line colored based on Ichimoku Cloud
Definition
The Ichimoku Cloud, developed by Goichi Hosoda and published in the late 1960s, is a collection of technical indicators that give it a unique capacity to show support and resistance levels, momentum and trend direction
What Does the Ichimoku Cloud Tells?
The overall trend is up when price is above the cloud, known as Kumo Cloud, down when price is below the Kumo Cloud, and trendless or transitioning when price is in the Kumo Cloud
When Senkou Span A (Leading Span A) is rising and above Senkou Span B (Leading Span B), this helps confirm the uptrend and space between the lines is typically colored green. When Senkou Span A is falling and below Senkou Span B, this helps confirm the downtrend. The space between the lines is typically colored red
Traders often use the Kumo Cloud as an area of support and resistance depending on the relative location of the price. The Kumo Cloud provides support/resistance levels that can be projected into the future. This sets the Ichimoku Cloud apart from many other technical indicators that only provide support and resistance levels for the current date and time
Crossovers, also known as TK Cross among Ichimoku Cloud traders, are another way the indicator can be used. Watch for the Tenkan-Sen Line, or Conversion Line, to move above the Kijun-Sen Line, or Base Line, especially when price is above the Kumo cloud. This can be a powerful buy signal. One option is to hold the trade until the Tenkan-Sen drops back below the Kijun-Sen Line. Any of the other lines could be used as exit points as well.
With this study:
Allow Traders to use the Ichimoku Cloud in conjunction with other technical indicators to maximize their risk-adjusted returns
The Ichimoku Cloud can make a chart look busy with all the lines. To Remedy this a different approach is applied in this study showing the Price and the Kumo Cloud relation as well as TK Crosses displayed. The SuperTrend Indicator is chosen to display Ichimoku Indicator, where the SuperTrend is another trend following indicator.
How it works:
SuperTrend Line is colored as:
Green when the Price is above the Kumo Cloud
Red when the Price is below the Kumo Cloud
Black when the Price is within the Kumo Cloud
And Finally Blue when the Kumo Cloud Is not ready to be drawn or not Kumo Cloud available
Additionally intensity of the colors used in all cases above are defined by values of Tenkan-Sen and Kijun-Sen Line, which allows us to detect TK Crosses
2- Plots Colored Directional Movement Line
Definition
Directional Movement (DMI) (created by J. Welles Wilder ) is actually a collection of three separate indicators combined into one. Directional Movement consists of the Average Directional Index (ADX) , Plus Directional Indicator (+D I) and Minus Directional Indicator (-D I) . ADX's purposes is to define whether or not there is a trend present. It does not take direction into account at all. The other two indicators (+DI and -DI) are used to compliment the ADX. They serve the purpose of determining trend direction. By combining all three, a technical analyst has a way of determining and measuring a trend's strength as well as its direction.
This study combines all three lines in a single colored shapes series plotted on the top of the price chart indicating the trend strength with different colors and its direction with triangle up and down shapes.
What to look for
Trend Strength : Analyzing trend strength is the most basic use for the DMI. Wilder believed that a DMI reading above 25 indicated a strong trend, while a reading below 20 indicated a weak or non-existent trend
Crosses : DI Crossovers are the significant trading signal generated by the DMI
With this study
A Strong Trend is assumed when ADX >= 25
Bullish Trend is defined as (+D I > -DI ) and (ADX >= 25), which is plotted as green triangle up shape on top of the price chart
Bearish Trend is defined as (+D I < -DI ) and (ADX >= 25), which is plotted as red triangle down shape on top of the price chart
Week Trend is assumed when 17< ADX < 25, which is plotted as black triangles up or down shape, depending on +DI-DI values, on top of the price chart
Non-Existent Trend is assumed when ADX < 17, which is plotted as yellow triangles up or down shape, depending on +DI-DI values, on top of the price chart
Additionally intensity of the colors used in all cases above are defined by comparing ADX’s current value with its previous value
3- Volume Based Colored Bars indicator created by Kıvaç ÖZBİLGİÇ
Volume Based Colored Bars colors the bars into volume weighted signals increasing the visibility of the Volume changes. Intensity of the colors of the bars varies according to average value of the volume for given length of bars (default value set to 30 bars)
Disclaimer: The script is for informational and educational purposes only. Use of the script does not constitutes professional and/or financial advice. You alone the sole responsibility of evaluating the script output and risks associated with the use of the script. In exchange for using the script, you agree not to hold dgtrd tradingview user liable for any possible claim for damages arising from any decision you make based on use of the script
"ichimoku" için komut dosyalarını ara

Hull MA-X + Ichimoku Kinko Hyo StrategyHull MA-X:
The Hull MA involves the weighted moving average ( WMA ) in its calculation.
First, calculate the WMA with period (n / 2) and multiply this by 2. Remember ‘n’ is the time period configurable based on the trader’s requirement.
Second, calculate the WMA for period “n” and subtract if from the first step. Thirdly, calculate the weighted moving average with period sqrt (n) using the data from the second step. You can take a look at the below formula:
Hull MA= WMA (2*WMA (n/2) − WMA (n)), sqrt (n))
The default setting is 12 periods in this strategy, fast Hull MA crossing slow Hull MA will generate a circle on charts.
Ichimoku Kinko Hyo:
The Ichimoku Kinko Hyo system includes five kinds of signal, of which this strategy uses four signals i.e. Tenkan Sen / Kijun Sen Cross, price crosses the Kijun Sen, Chikou Span and Kumo. Although the Chikou Span, Senkou Span A and Senkou Span B (Kumo) are shifted into the past/future, these trigger signals enhances the strategy.
The Tenkan Sen, also known as the Turning or Conversion line, is a moving average of the highest high and lowest low over the last 9 periods in this strategy.
The Kijun Sen, also known as the Standard or Base line, is a moving average of the highest high and lowest low over the last 24 periods in this strategy.
The Chikou Span, also known as the Lagging line, is the closing price plotted 24 periods behind in this strategy.
The Senkou Span A, also known as the 1st leading line, is a moving average of the Tenkan Sen and Kijun Sen and is plotted 24 periods ahead in this strategy.
The Senkou Span B, also known as the 2nd leading line, is a moving average of the highest high and lowest low over the last 51 trading days is plotted 24 periods ahead in this strategy.
As with most technical analysis methods, Ichimoku is likely to produce frequent conflicting signals in non-trending markets, So in addition to Ichimoku Kinko Hyo, the Hull MA is used, which is popular amongst some day traders, in combination it attempts to give an accurate signal by eliminating lags and improving the smoothness of the line.
The Hull MA Cross in combination with Ichimoku Kinko Hyo signals tries to give an accurate signal by eliminating lags and improve the smoothness of price activity. Please note that price trends can and do change often, so your readings of the charts and this trading system should be probabilistic, rather than predictive.
MTF Ichimoku Conversion Line SMA with H/L mirrored levelsWelcome to MTF Ichimoku Conversion Line with SMA Highs/Lows Extended Lines!
1. Overview
It is designed to provide a multi-timeframe view of market trends and potential support/resistance levels by obtaining a Simple Moving Average (SMA) of the Conversion Line of Ichimoku Equibilium (Ichimoku Kinko-Hyo), which acts as a substantial trend line on the candlestick chart. The SMA of the conversion line smooths out price fluctuations and indicates the overall trend direction—if the candles are above it, the trend can be read as an uptrend, while below it, the trend can be read as a downtrend.
2. Calculation
The indicator first calculates the Conversion Line (see the description of Ichimoku theory anywhere, e.g., Wikipedia), as the average of the highest high and lowest low over a user-defined period (Conversion Line Length, default is 9, also recommended is 9).
It then retrieves this Conversion Line from a higher timeframe (MTF Timeframe) to add a broader perspective. Using a specified period (SMA Length)., an SMA is computed on this multi-timeframe conversion line. This SMA serves as a trend line that visually represents the prevailing price trend, making it easier to assess market direction.
3. Pivot Highs/low detection and drawing their extensions
In addition, the indicator identifies pivot highs and lows from the SMA data using a defined pivot length. When these pivots occur, horizontal lines are drawn and extended across the chart. These extended lines (drawn in a yellowish color by default) include a full extension, a half extension, and a middle extension line representing the midpoint between the high and low pivot.
4. Mirror lines
The indicator also offers optional mirror line features. When the Mirror Upside option is enabled, five additional lines are drawn above the highest extended yellow line at equal intervals. Similarly, when the Mirror Downside option is enabled, five lines are drawn below the lowest extended yellow line. These light gray mirror lines serve as extra reference levels, which can help identify potential support or resistance zones.
5. Parameters
User parameters include:
- Conversion Line Length: The period used to calculate the conversion line.
- MTF Timeframe: The higher timeframe from which the conversion line is obtained.
- SMA Length: The period over which the SMA is calculated on the conversion line.
- SMA Mode: A toggle to display either the SMA or the raw conversion line (SMA recommended).
- SMA Line Width: The thickness of the SMA line.
- Pivot Length for SMA Highs/Lows: The period used to detect pivot highs and lows in the SMA.
- Horizontal Extension: Number of bars by which the pivot and extended lines are drawn across the chart
- Colors for High and Low Pivot Lines and Extended Lines: Customizable colors are used to draw the lines.
Mirror Upside and Mirror Downside: These options enable drawing additional mirror lines above and below the extended lines.
- Hide Old Lines: An option to hide previous pivot lines once new ones are drawn for a cleaner chart. Turned on by default.
6. Conclusion
Overall, the Conversion Line SMA in this indicator smooths out the conversion line data and effectively functions as a trend line for the candlestick chart, helping traders visually interpret the underlying market trend. The extended and mirror lines provide further context for potential price reversal or continuation areas, making this a powerful tool for multi-timeframe technical analysis.

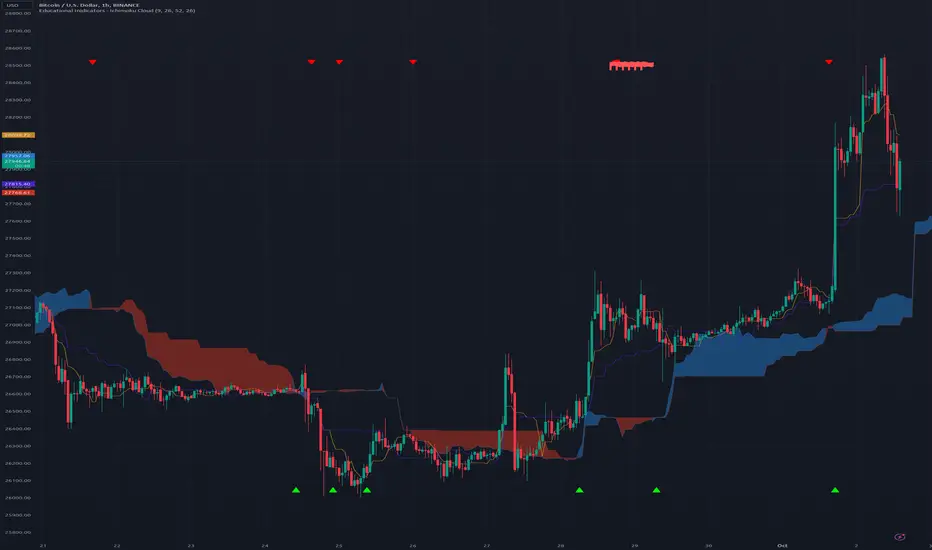
Educational Inidicators - Ichimoku CloudThis indicator is part of the Indicator Educational Series, intended to help newer traders understand and interact with various indicators. The goal is to allow users to gain a stronger understanding of an indicator's underlying philosophy, and visually see how changes to an indicator's parameters affects the trades suggested by that indicator.
The scripts in this series are all open source, with the code broken up into logical section and notated so beginner users can also understand some PineScript fundamentals.
Please understand that no indicator presented in and of itself constitutes a complete trading strategy. Rather, this series is to help users determine which indicators make sense to them, and which ones to combine to create their own trading strategy. All material presented is purely for educational purposes.
Presented here is the Ichimoku Cloud.
The Ichimoku Cloud was developed by Goichi Hosada, and first published in the late 1960s. It is used by traders to understand price momentum, and help forecast future price movements.
The indicator at its core can be understood from four component parts:
The Conversion Line - An average of the highest and lowest price in a given window. Typically, this is a "fast" average, and as such, this line has the lowest period
The Base Line - An average of the highest and lowest price in a given window. This is a "slower" average than the Conversion Line, and as such should have a larger period than the Conversion Line
Leading Span A - The average of the Conversion Line and the Base Line
[*}Leading Span B - An average of the highest and lowest price in a given window. This is the "slowest" average of all three, and as such should have the largest period
When plotted, the Conversion Line (orange by default), Base Line (purple by default), Leading Span A (blue by default), and Leading Span B (red by defaults) are all drawn on the chart along with the price candles. The area between the Leading Span A and Leading Span B lines are also shaded depending on which of the two lines is greater: whenever Leading Span A is greater the area is shaded positively (blue by default), whenever Leading Span B is greater the area is shaded negatively (red by defaults).
One interesting feature of the Ichimoku Cloud is that it drawn a certain number of candles forward. What this means is that where the cloud is drawn on the chart is reflective of prices that have occurred a number of candles in the past. This is done intentionally to help traders see how the current price is moving in relation to historical price movements on the asset.
See below for how the indicators look in their default colors on the chart
These indicators can then be used to start analyzing the price movement, and making trade decisions.
The first inference we can make is the momentum of the price. Since the lines are drawn from averages of varying speeds, the shaded area between the Leading Span lines can tell us whether the momentum is bullish (up) or bearish (down).
Whenever Leading Span A, the faster of the two lines, is above Leading Span B, that means that price is moving upward faster than it typically has, ergo we are in Bullish Momentum. On the chart, this is indicated in two ways:
The area is shaded positively (blue by default)
A green upward triangle is added to the chart to indicate where the momentum first turned Bullish
Whenever Leading Span A is below Leading Span B, that means that price is moving downward faster than it typically has, ergo we are in Bearish Momentum. On the chart, this is indicated in two ways:
The area is shaded negatively (red by default)
A red downward triangle is added to the chart to indicate where the momentum first turned Bearish
The next inference we can make is possible trading points. When we're in a period of momentum, as determined above, we know that price is going up or down, depending on the momentum we're in. We can then use the Conversion Line, Base Line, and the Price itself to confirm a good trade price.
When the asset is in Bullish Momentum, and the Conversion Line, our fastest average, is above the Base Line, our mid speed average, we know that the price is coming up quickly in the short term. When the Base Line and current Price are also above the cloud, then we have triple confirmation that price is going up, and we should enter a Long position. On the chart, this point is indicated with a green flag.
When the asset is in Bearish Momentum, and the Conversion Line is below the Base Line, we know that the price is going down quickly in the short term. When the Base Line and current Price are also below the cloud, then we have triple confirmation that price is going down, and we should enter a Short position. On the chart, this point is indicated with a red flag.
The script presented here also allows users to customize the various parameters of the Ichimoku Cloud, and visually see how analysis is affected by these changes. This is designed to allow users to modify parameters as they see fit, within certain constraints, to find the best set for them. The lines, cloud, and chart indicators will all update automatically with the users' inputs.
Fukuiz Octa-EMA + Ichimoku (Strategy)This strategy is based EMA of 8 different period and Ichimoku Cloud which works better in 1hr 4hr and daily time frame.
#A brief introduction to Ichimoku #
The Ichimoku Cloud is a collection of technical indicators that show support and resistance levels, as well as momentum and trend direction. It does this by taking multiple averages and plotting them on a chart. It also uses these figures to compute a “cloud” that attempts to forecast where the price may find support or resistance in the future.
#A brief introduction to EMA#
An exponential moving average ( EMA ) is a type of moving average (MA) that places a greater weight and significance on the most recent data points. The exponential moving average is also referred to as the exponentially weighted moving average . An exponentially weighted moving average reacts more significantly to recent price changes than a simple moving average ( SMA ), which applies an equal weight to all observations in the period.
#How to use#
The strategy will give entry points itself, you can monitor and take profit manually(recommended), or you can use the exit setup.
EMA (Color) = Bullish trend
EMA (Gray) = Bearish trend
#Condition#
Buy = All Ema (color) above the cloud.
SELL= All Ema turn to gray color.

Ultimate Ichimoku Cloud StrategyThe goal of this strategy script is to provide the ultimate experience to anyone interested in the Ichimoku Kinkō Hyō (Ichimoku Cloud). The script is designed to be highly customizable and allows the user to set a custom trade date range and select any combination of inputs and conditions that satisfy their goals. Additionally, the script allows the user to visually see any combination of their set conditions by clicking the " Show Conditions Visually " checkbox. Doing so will color the background in a different color where the conditions align. Finally, a simple Stop/Take profit is added for those that wish to exit based on percentages over Ichimoku conditions.
As always, please let me know if there are any bugs, something useful that could be added or if you need some help. Leave a like if you wish!
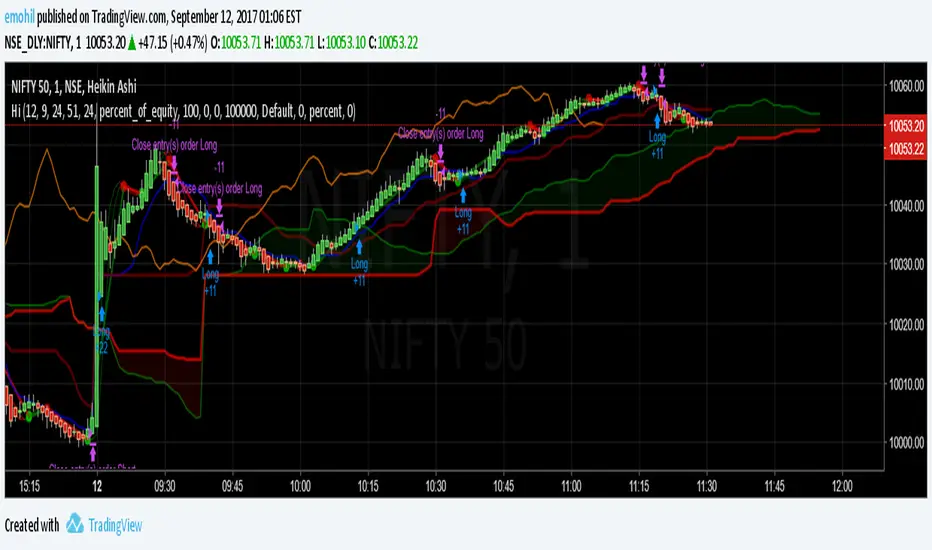
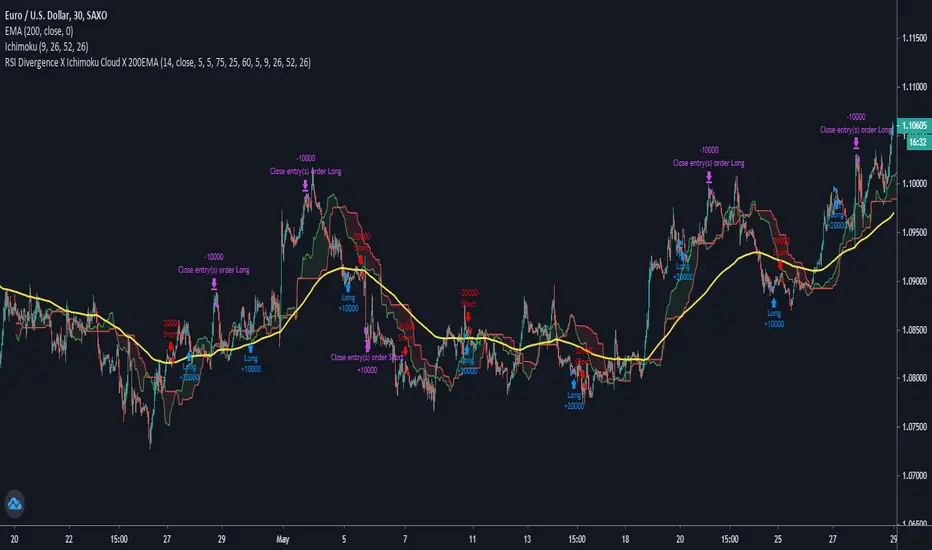
RSI Divergence X Ichimoku Cloud X 200EMAHi all,
This script is a combination of the RSI Divergence Strategy combined with Ichimoku Cloud and 200 EMA .
A long position is entered only when the RSI identifies a bullish divergence (either regular or hidden), and that the Ichimoku Cloud is above the 200 EMA . This is to ensure that there is a confirmation of a bullish trend before an entry.
Similarly, a short position is entered only when the RSI identified a bearish divergence (either regular or hidden), and that the Ichimoku Cloud is below the 200 EMA . This is to ensure that there is a confirmation of a bearish trend before an entry.
I find that this script works best on Intraday charts.
This is just a simple script I built on my third attempt of backtesting strategies on TradingView. Do give it a go and let me know if you guys have any feedback or comments about it. Happy trading!
ULTIMATE ICHIMOKU TRADING SUITEThis is an update of "Uncle Mo's Ultimate Ichimoku V1"
Main features:
2 x Ichimoku Cloud
5 x EMA
2 x MA
1 x HullMA
Williams Fractal
Bollinger Bands - ***NEW***
ATR - ***NEW***
PSAR - ***NEW***
Candlestick Patterns - ***NEW***
Price Action Bars- ***NEW***
List of credits:
@br0qn for the Ichimoku
@RicardoSantos for the Bill Williams Fractal
@EmilianoMesa for the EMAs/MAs
@mohamed982 for the HullMA
@ymaheshreddy4u for the Bollinger Bands
@ChrisMoody for the Price Action Bars and PSAR
@HPotter for the ATR
@repo32 for the Candlestick Patterns
The script is open source and free to use. Feel free to change it around to suit your needs.
***If you copy & paste code from other traders to make your own script, please do remember to give them credit for their amazing work.***
Happy trading!

pyogi24 Intraday Ichimoku + RSIcustom script to get entry exit
its based on the ichimoku cloud indicator
and the cross over of the leading ang lagging spans to get the signals,
its under development.
i have also integrated the vwap so we know the bias of the trend.
this should work on a trending day.

[_ParkF]RSI (+ichimoku cloud)RSI
Typical RSI indicators were plotted with candles and expressed wick to resemble a candle chart,
and linear regression was added to predict changes in force intensity,
which allowed us to confirm support and resistance within linear regression .
In addition, divergence signal was marked as an additional basis for the price fluctuation point due to support and resistance .
In other words,
if the diversity signal appears together when the rsi candle is supported and resisted within linear regression ,
this is the basis for predicting that it is a point of change in the existing trend.
Finally, the period value and standard deviation of linear regression can be arbitrarily modified and used.
I hope it will help you with your trading.
--------------------------------------------------------------------------------------------------------------------------------------------------------------
(+ichimoku cloud)
Clouds made of the preceding span 1 and the preceding span 2 of the balance table can predict the trend by displaying the current price balance ahead of the future.
In addition to the role of clouds in the above-described balance sheet, this indicator also shows the cloud band support and resistance of the current RSI value.
일반적인 RSI 지표를 캔들화 하였고 꼬리까지 포함하여 캔들 차트와 유사하게 표현 하고,
캔들화한 RSI 지표에 선형회귀(채널)를 추가 하여 RSI 지표 특유의 힘의 강도의 변화를 지지와 저항으로 확인할 수 있게 해봤습니다.
또한 다이버전스 신호를 추가하여 선형회귀(채널)로 인한 지지와 저항에 따른 가격 변동의 근거로 삼을 수 있습니다.
즉, 선형회귀(채널) 안에서 RSI 캔들이 지지와 저항을 받을 때 다이버전스 신호가 함께 나타난다면 이는 기존 추세의 변화 지점임을
예측해 볼 수 있는 근거가 됩니다.
마지막으로 선형회귀(채널)의 기간값과 표준편차는 임의로 수정하여 사용할 수 있습니다.
당신의 트레이딩에 도움이 되었으면 합니다.
--------------------------------------------------------------------------------------------------------------------------------------------------------------
(+일목균형표의 구름)
일목균형표의 선행스팬1과 선행스팬2로 만들어진 구름은 현재 가격의 균형을 미래에 선행하여 표시하여 추세를 예측해볼 수 있습니다.
본 지표에서는 위에서 설명한 일목균형표의 구름의 역할과 더불어 현 RSI 값의 구름대 지지, 저항 또한 확인해볼 수 있습니다.
* I would like to express my gratitude to zdmre for revealing the linear regression source.

Kyushu Legs - Advanced Ichimoku Kinko Hyo TechniqueWhat is Kyushu Legs?
Kyushu Legs created by the open price of 9 previous weekly candle and current weekly close price.
P/s: This is the advanced Ichimoku Kinko Hyo technique by Master Goichi Hosoda
2 VWAP with selective timeframe and Display liked Ichimoku CloudSET:CKP
This is my first indicator of VWAP that I fork from the original script by public script "VWAP Periodic".
You can see that original script by type "VWAP Periodic" from "New" in "Pine Indicator".
The reason that I want to share my script is only one thing. That I need to discuss, Is this indicator can identify the trend and can use it to adapt to the "Buy-On-Dip" strategy?
Double VWAP can show you 2 lines of VWAP form different periods as my default is "Week" and "Month" timeframe.
Not at all, it fulfils with the background of the simple colour which can be defined Trend just liked "Ichimoku Cound" (Yes indeed, green is uptrend and red is downtrend).
I hope this indicator will help :)
Wishing you good health and get wealth too. :) :) :)
---------------------------------------------------------------------------------------------
สวัสดีครับมิตรสหายทุกท่าน อินดิเคเตอร์ที่ผมจะมานำเสนอมิตรสหายนี้ เป็นอินดี้ที่จะแสดงเส้น VWAP ได้ทั้งหมด 2 เส้น โดยท่านสามารถระบุ Timeframe ของ VWAP ที่ท่านต้องการได้เลยครับ
ก่อนอื่นผมของออกตัวก่อนครับ ว่าอินดิเคเตอร์นี้ผมโฟร์คมาจาก Original Public Script จากใน Pinescript แห่ง Trading View นี่ละครับ จากอินดิเคเตอร์ที่มีชื่อว่า "VWAP Periodic" ซึ่งท่านสามารถ กดดู Original Script ได้จากการกดที่
1) ไพน์อินดิเคเตอร์
2) กดเลือกคำว่า "ใหม่"
3) หาอินดิเคเตอร์ที่ชื่อว่า "VWAP Periodic"
้เท่านี้ท่านก็จะได้สคลิปต้นแบบที่ผมนำมาปรับใช้ได้ทันทีครับ
แต่กระนั้นแล้ว ผมจะเปิดโชว์สคริปของผมที่นำมาโฟร์คแล้วให้ทุกท่านได้รับชมกันด้านล่างในส่วนของโค้ดนะครับ
จุดประสงค์ของอินดิเคเตอร์นี้คือได้ฟังแนวคิดของ VWAP จากกัลยาณมิตรเทรดเดอร์ด้วยกันแล้วรู้สึกคลิ๊ก กับอินดิเคเตอร์นี้มากครับ
จะมีอะไรดีไปกว่าการได้รู้ต้นทุนราคาของแต่ละช่วงเวลา ทั้งไทม์เฟรมที่ใหญ่อย่างระดับ "เดือน (เส้นสีเขียว)" และ ระดับ "สัปดาห์ (เส้นสีแดง)" ได้พร้อมกันและดูแท่งเทียนเพื่อ "จับจังหวะซื้อ"(ในไทม์เฟรม ระดับ วัน) ที่ราคาต่ำกว่าค่า VWAP อีกเล่าอรชุน
จุดประสงค์หลักของอินดิเคเตอร์นี้ คือมีไว้เพื่อระบุเทรนด์โดยอาศัยการดูระยะห่างของเส้น VWAP ทั้ง 2 เส้นนี้ และระบุ "จุดกลับตัว" เมื่อก้อนเมฆสีเขียวและแดงเริ่มหายไป เสมือนกับอินดิเคเตอร์ "เมฆหมอกแห่งอิชิโมคุ"
นอกจากนี้เมื่อราคาหุ้นปรับตัวเป็นเทรนด์ขาขึ้นแล้ว เรายังสามารถซื้อเฉลี่ยขาขึ้น หรือใช้กลยุทธ์ Buy-on-Dip ได้อีกด้วยครับ โดยเฉลี่ยซื้อเมื่อราคาตกย่อมาอยู่ที่เส้นสีเขียว แบบนี้เป็นต้นครับ
ผมหวังว่าอินดิเคเตอร์นี้จะเป็นประโยชน์ให้แก่มิตรสหาย และกัลยาณมิตรเทรดเดอร์ทุกท่านนะครับ
ผมขออวยพรให้ทุกท่านมีความสุข ออกจากสนามแข่งหนูนี้ ได้รับอิสระภาพทางการเงิน และ "มีสุขภาพที่แข็งแรง" Work life balance ทุกท่านครับ
ขอบคุณครับ :) :) :)

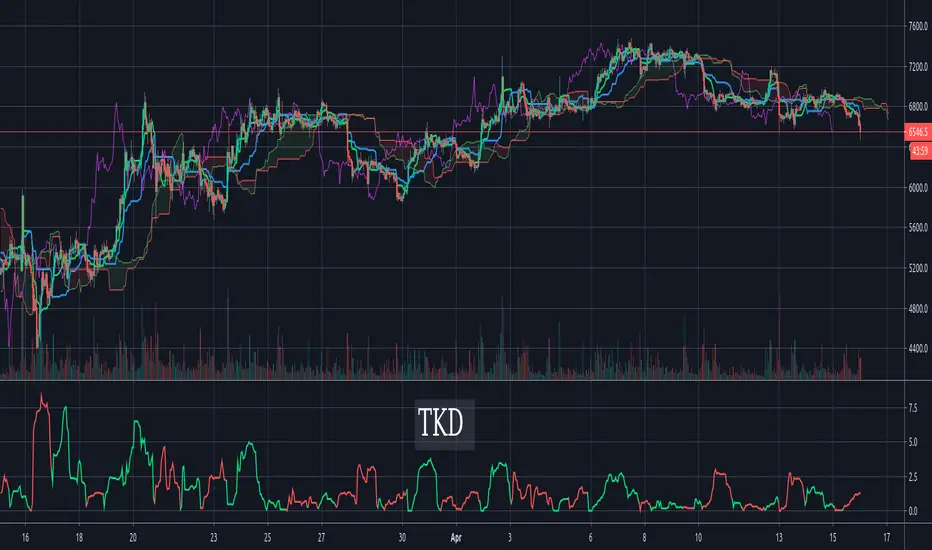
Tenkan-Sen Kijun-Sen Distance (TKD) Oscillator - IchimokuThe TKD is the distance between the Tenkan-Sen and the Kijun-Sen, expressed in percentage of current price. The further apart the tenken-sen and kijun-sen are, the more they want to snap back together. This makes for a decent oscillator. When the Tenkan-Sen is above the Kijun-Sen, the TKD is green. When it is below, the TKD is red. At the crossing points, it turns blue.
For those more familiar with Ichimoku Cloud techniques, one might also think of this indicator as a C-Clamp indicator. Bar coloring is supported and enabled by default. There's also an option to flip/invert the green/red colors in case you want to use it to judge pending cycles rather than current ones.
Pivot Boss 4 EMA + BB + Parabolic SAR + IchimokuA combination of a few of my favorite indicators.
1) Pivot Boss 4 EMA
2) Bollinger Bands
3) Parabolic SAR
4) Ichimoku Cloud
All credit to original authors.

Complete Ichimoku Trader *modified*I just found this script from @kingthies here and like it. So i just made some changes and added some little code into it.
Reduced some noise for the signals. Hope anyone can enjoy it. But keep in mind, did not test it on live trading! Had just some time and love to work in pine :)
Original
Happy Trading

Quad Moving Avarage-Ichimoku Cloud-ALMA-Bollinger BandsAll-in-One
Ingradients:
* Ichimoku Cloud,
* 2 Simple Moving Avarage (SMA),
* 2 Exponential Moving Avarage (EMA),
* 2 Arnoud Legoux Moving Avarage (ALMA),
* Bollinger Bands and
* Volume Based Colored Bars (developed by KIVANÇ fr3762).
Compiled for limitations. Thank you.

Uncle Mo's Ultimate Ichimoku V1Main features:
2 x Ichimoku Cloud
5 x EMA
2 x MA
1 x HullMA
Williams Fractals
Study is based around trader @br0qn 's Ichimoku script.
Credits also go to:
@RicardoSantos for the Bill Williams Fractals
@EmilianoMesa for the EMAs/MAs
@mohamed982 for the HullMA
The script is open source so please feel free to change it around. I'd greatly appreciate it if you could suggest ways to improve it.
Happy trading!

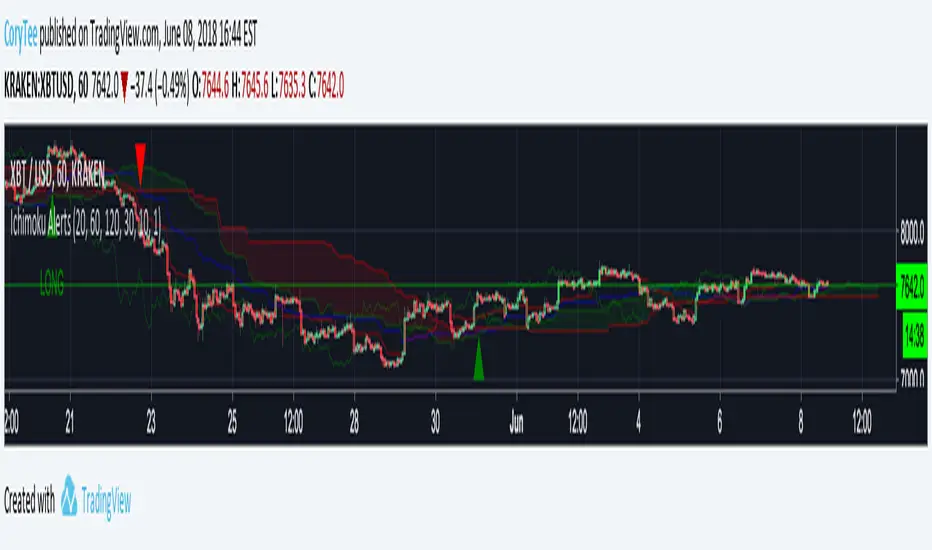
CoryT's Noro's Ichimoku AlertsA few months ago I took Noro's Ichimoku Cloud and used the AV bot template to throw stops on it. I took some code from JustUncleL
to make it not so hideous. Trailing Stops are turned off, stop losses are turned off (you really don't need them with this), and this is currently a Long/Short strategy, the Longs Only and Shorts Only options are broken right now, I'm tired and you guys can either fix it yourselves or deal with it like this for now.
Hint: If you wanna use this as a long-only strategy just have AV close your buy orders whenever a short is triggered.
CoryT's Noro's IchimokuA few months ago I took Noro's Ichimoku Cloud and used the AV bot template to throw stops on it. I took some code from JustUncleL
to make it not so hideous. Trailing Stops are turned off, stop losses are turned off (you really don't need them with this), and this is currently a Long/Short strategy, the Longs Only and Shorts Only options are broken right now, I'm tired and you guys can either fix it yourselves or deal with it like this for now.
Hint: If you wanna use this as a long-only strategy just have AV close your buy orders whenever a short is triggered.
TSP Ichimoku Clouds x2 MTFDouble Ichimoku
Use a Multiple of current time frame :
15m * 4 = 1h
1h*24 = 1d


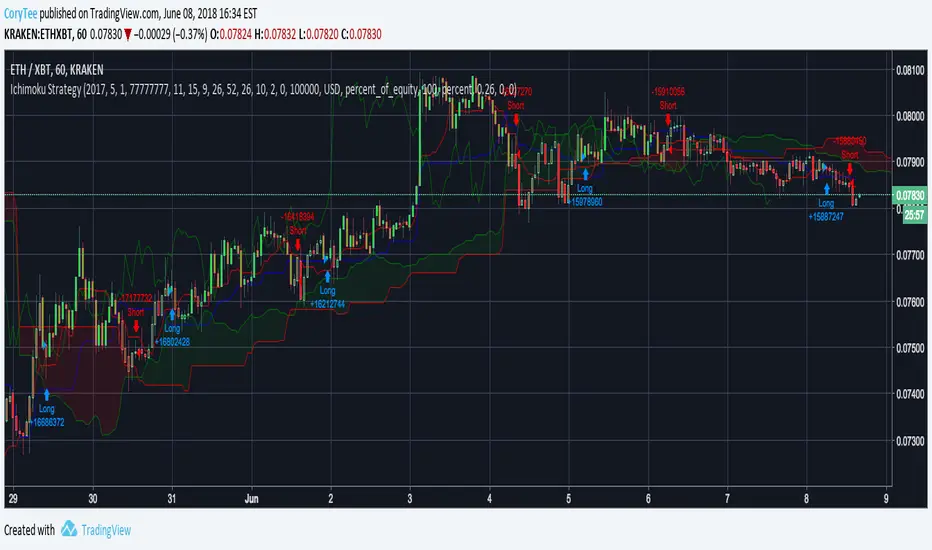
My Ichimoku indicator & Strategyhello I'm a beginner in trading, but I try to learn how to code strategies.
I recoded the Ichimoku indicator, and created my personnal strategy based on it.
The backtesting is done from 1/1/2017 to today in 45 min Time Unit for candles, with a 1 000 € equity.
The trades are all Long Entries and Exits with no pyramiding, no short trades at all.
/!\ Exchanges commission fees are not calculated and can in reality easily divide by 2 the total profit (am I right guys?) /!\
A buy signal is triggered upon these conditions:
- close is above the Kuma (cloud)
AND
- close crosses over Kijunsen AND Kijunsen is not flat (calculated with rising and falling with input "Kijunsen Lag")
OR
- Close crosses over ChikouSpan AND there was a sell signal in the last 8 candles
Sell signal is the same but reversed.
I appreciate your feedback ! Maybe I will update this later if I get better results.
