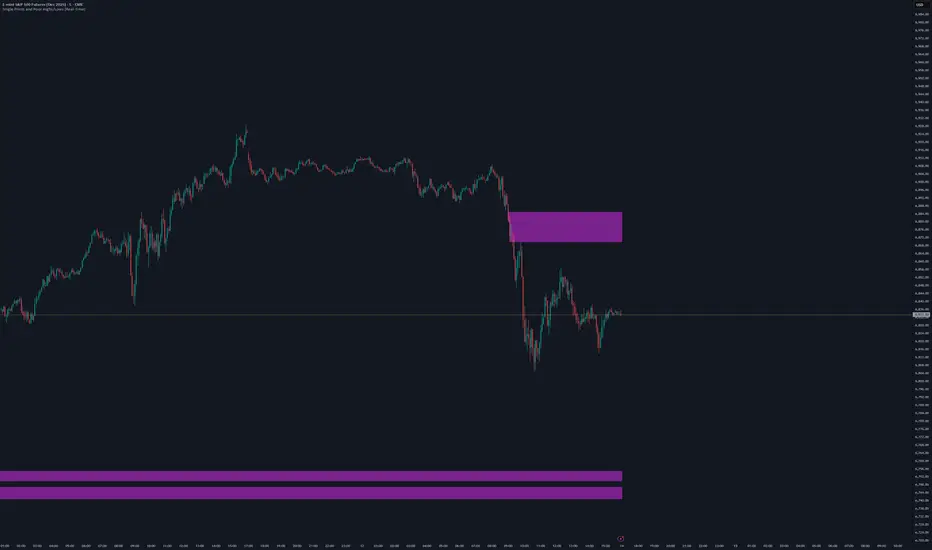
Unmitigated Cave Diving MTF High Low - BookMap Style Chart
Unmitigated Cave Diving MTF High Low - BookMap Style Chart
Introduction
This Pine Script indicator tracks unmitigated higher timeframe highs and lows with a session-aware approach, inspired by KinetiCapital's X D HL Targets.
Built for precision trading on instruments like NQ during extended trading hours (ETH), it visualizes support and resistance levels that have not yet been breached, helping traders identify key price zones for potential reversals or breakouts.
Core Features
The indicator monitors multi-timeframe levels (default 15-minute) and applies intelligent styling based on recency and survival duration:
Most Recent Levels: The 1st and 2nd most recent unmitigated highs and lows are highlighted with distinct colors and widths for quick visual identification
Session Age Tracking: Levels are categorized by how many full trading sessions (1800-1700 NQ ETH) they've survived unmitigated, with "old" levels receiving special highlighting once they exceed your defined threshold
BookMap-Style Visualization: Clean horizontal lines with optional price labels positioned above highs and below lows for minimal chart clutter
Real-Time Summary Table: Displays the four most recent levels with their prices, distance in points from current price, and session age
Mitigation Logic
Levels automatically update when price touches them - high levels are mitigated when price reaches or exceeds them, while low levels are mitigated when price touches or breaks below. Mitigated levels change to a neutral gray color and can optionally be deleted at session end to preserve chart memory.
This tool is particularly valuable for intraday traders who trade around key structural levels and need to understand which unmitigated zones represent the freshest or most significant price memory in the market.
"high low" için komut dosyalarını ara

FX Session High/Low Bands - Last 5 EST Days
FX Session High/Low Bands - Last 5 Days
Description:
This indicator plots horizontal bands representing the high and low price levels from the major forex trading sessions over the last 5 days. It helps traders identify key support and resistance zones based on recent session activity.
Features:
Multiple Session Tracking: Displays high/low levels for major FX sessions:
Asian Session (Tokyo)
European Session (London)
US Session (New York)
5-Day Lookback: Captures the highest high and lowest low from each session over the previous 5 trading days
Visual Bands: Clear horizontal lines or filled zones showing session boundaries
Dynamic Updates: Automatically recalculates as new session data becomes available
How to Use:
Support/Resistance: Previous session highs/lows often act as key price levels
Breakout Trading: Watch for price breaking above/below session bands
Range Trading: Trade within the bands during consolidation periods
Session Overlap: Pay attention to multiple session bands converging
Ideal For:
Forex day traders
Session-based trading strategies
Support/resistance identification
Multi-timeframe analysis

Single Prints and Poor Highs/Lows [Real-Time]This indicator is designed for traders utilizing Auction Market Theory (AMT) who need real-time visibility into market structure inefficiencies. Unlike standard TPO tools that often wait for closed bars or finished sessions, this script builds a developing TPO profile tick-by-tick to identify Single Prints and Poor Highs/Lows the moment they form.
Key Features:
Real-Time Single Prints: Automatically detects and highlights areas of single-print inefficiencies (buying/selling tails) as they happen. These "ghost" boxes persist on the chart until price repairs (fills) them, acting as immediate targets or support/resistance zones.
Poor High/Low Detection: Strictly implements AMT logic to identify "unfinished" auctions. If a session extreme is formed by two or more TPO blocks (indicating a flat top/bottom rather than a rejection tail), it marks the level with a dotted line.
Repair Logic: Both Single Prints and Poor High/Low lines are dynamic. If price revisits and repairs the structure, the markers automatically vanish to keep your chart clean.
Session Control: Fully customizable RTH (Regular Trading Hours) session input (default 08:30–15:15) to ensure profiles are built on relevant liquidity.
Quantization: Adjustable "Ticks per Block" allowing you to tune the sensitivity of the TPO profile to different assets (ES, NQ, CL, etc.).
How It Works:
TPO Construction: The script breaks the session into 30-minute periods (configurable) and tracks price overlap.
Single Prints: When the market expands rapidly, leaving gaps in the profile (single TPO blocks), a box is drawn. If price trades back through this box, it deletes itself.
Poor Extremes: It monitors the current session High and Low. If the extreme price level has a TPO count of ≥ 2, it is flagged as "Poor." If the extreme is a single print (count = 1), it is considered a valid tail and left unmarked.
Settings:
RTH Session: Define your specific trading session time.
TPO Period: Default is 30 minutes (standard AMT).
Ticks per Block: Controls the vertical resolution of the TPO. (Higher values = coarser profile, Lower values = more precision).
Colors: Fully customizable colors for Live Prints, Historical Prints, and Poor High/Low lines.
Usage:
Use this tool to spot immediate structural targets. A Poor High often acts as a magnet for price to revisit and "repair," while Single Prints often defend as support/resistance on the first retest.
6am Candle High/Low Indicator with Highlight6am Candle High/Low Indicator with Highlight
6am Candle High/Low Indicator with Highlight
6am Candle High/Low Indicator with Highlight
6am Candle High/Low Indicator with Highlight 6am Candle High/Low Indicator with Highlight

Multi HTF High/Low LevelsThis indicator plots the previous high and low from up to four user-defined higher timeframes (HTF), providing crucial levels of support and resistance. It's designed to be both powerful and clean, giving you a clear view of the market structure from multiple perspectives without cluttering your chart.
Key Features:
Four Customizable Timeframes: Configure up to four distinct higher timeframes (e.g., 1-hour, 4-hour, Daily, Weekly) to see the levels that matter most to your trading style.
Automatic Visibility: The indicator is smart. It automatically hides levels from any timeframe that is lower than your current chart's timeframe. For example, if you're viewing a Daily chart, the 4-hour levels won't be shown.
Clean On-Chart Lines: The high and low for each timeframe are displayed as clean, extended horizontal lines, but only for the duration of the current higher-timeframe period. This keeps your historical chart clean while still showing the most relevant current levels.
Persistent Price Scale Labels: For easy reference, the price of each high and low is always visible on the price scale and in the data window. This is achieved with an invisible plot, giving you the accessibility of a plot without the visual noise.
How to Use:
Go into the indicator settings.
Under each "Timeframe" group, check the "Show" box to enable that specific timeframe.
Select your desired timeframe from the dropdown menu.
The indicator will automatically calculate and display the previous high and low for each enabled timeframe.

Daily High/Low (15m) + EMA Pre-Market H/L + ORBStraightforward:
I built a swing-trading indicator with ChatGPT that plots 15-minute highs and lows, draws pre-market high/low lines, and adds a 15-minute opening-range breakout feature.
Technical:
Using ChatGPT, I developed a swing-trade indicator that calculates 15-minute highs/lows, overlays pre-market high and low levels, and includes a 15-minute Opening Range Breakout (ORB) module.
Promotional:
I created a ChatGPT-powered swing-trading indicator that maps 15-minute highs/lows, marks pre-market levels, and features a 15-minute Opening Range Breakout for clearer entries.

Enhanced 4H Candle Countdown & High/Low IndicatorBy profitgang
This Pine Script indicator provides real-time tracking of 4-hour timeframe levels with an integrated countdown timer, designed to help traders monitor key support and resistance zones.
Key Features
📊 Visual Elements
4H High/Low Lines: Clear visualization of previous 4-hour candle high and low levels
Range Fill: Subtle background fill between high and low for better context
Mid-Level Line: Shows the middle point of the 4H range
Position Indicator: Visual cue showing current price position within the range
⏰ Countdown Timer
Real-time countdown to next 4H candle close
Customizable table position (9 different locations)
Adjustable text size (6 size options from Tiny to Huge)
Distance calculations showing percentage distance from key levels
🎯 Signal Generation
Long signals when price crosses above 4H low
Short signals when price crosses below 4H high
RSI confluence filter to reduce false signals
Background highlighting for active signals
TradingView alerts compatible
⚙️ Customization Options
Toggle all features on/off independently
Custom colors for all elements
Table positioning (top/middle/bottom + left/center/right)
Text size selection for optimal readability
Alert notifications for level breaks and updates
How It Works
The indicator fetches the previous 4-hour candle's high and low values and displays them as horizontal lines on your current timeframe chart. It continuously calculates the time remaining until the current 4H candle closes and presents this information in a clean, customizable table.
Use Cases
Swing Trading: Identify key 4H support and resistance levels
Intraday Trading: Monitor when new 4H levels will be established
Risk Management: Calculate distance from key levels for position sizing
Multi-timeframe Analysis: Combine with lower timeframe setups
Educational Purpose
This indicator is designed for educational and analytical purposes to help traders understand price action relative to higher timeframe levels. It provides clear visual feedback about market structure and timing.
Settings Groups
Display Settings: Toggle features, positioning, and sizing
Colors: Customize all visual elements
Signal Settings: Configure alert conditions and confluence filters
Compatibility
Works on all timeframes (recommended for 1m to 1H charts)
Compatible with all instruments
Includes proper alert functionality for automated notifications
Optimized for both light and dark themes
This indicator does not provide financial advice. Always conduct your own research and risk management before making trading decisions.

TBL HTF Highs&LowsThis script plots the previous Daily, Weekly, and Monthly High and Low levels directly on your chart, helping you identify key higher-timeframe support and resistance zones.
Features:
Daily, Weekly, Monthly Lines: Toggle visibility for each timeframe's high/low levels.
Customization Options:
Choose color, style (Solid, Dashed, Dotted), width, and transparency for each line type.
Automatic Updates: Lines update at the start of each new session (day, week, or month).
Summary Table: Displays the latest Pre-Daily High/Low (PDH/PDL), Pre-Weekly High/Low (PWH/PWL), and Pre-Monthly High/Low (PMH/PML) in the top-right corner of the chart.
Configurable Table Font Size: Choose between Tiny, Small, Medium, or Large text.
Use Case:
Ideal for traders who rely on key higher-timeframe levels for confluence, breakout trading, or mean-reversion strategies. The visual lines and summary table provide instant context without cluttering your chart.

Equal High/Low (EQH/EQL) [AlgoAlpha]OVERVIEW
This script detects and visualizes Equal High (EQH) and Equal Low (EQL) zones—key liquidity areas where price has previously stalled or reversed. These levels often attract institutional interest due to the liquidity buildup around them. The indicator is built to highlight such zones using dynamic thresholding, overbought/oversold RSI filtering, and adaptive mitigation logic to manage zone relevance over time.
CONCEPTS
Equal Highs/Lows are price points where the market has repeatedly failed to break past a certain high or low, hinting at areas where stop orders and pending interest may be concentrated. These areas are often prime targets for liquidity grabs or reversals. By combining this with RSI filtering, the script avoids false signals during neutral conditions and instead focuses on zones where market pressure is more directional.
FEATURES
Detection Logic: The script identifies EQH and EQL zones by comparing the similarity between recent highs or lows with a dynamic volatility threshold. The `tolerance` input allows users to control how strict this comparison is.
RSI Filtering: If enabled, it only creates zones when RSI is significantly overbought or oversold (based on the `state_thresh` input). This helps ensure zones form only in meaningful market conditions.
Zone Display: Bullish (EQL) zones are shown in grey, while bearish (EQH) zones are in blue. Two horizontal lines mark the zone using wick and body extremes, and a filled area visualizes the zone between them.
Zone Management: Zones automatically extend with price until they’re invalidated. You can choose whether a zone is removed based on wick or body sweeps and whether it requires one or two candle confirmations. Zones also expire after a customizable number of bars.
Alerts: Four alert conditions are built in—when a new EQH/EQL is formed and when one is mitigated—making it easy to integrate into alert-based workflows.
USAGE
Equal highs/lows can be used as liquidity markers, either as entry points or as take-profit targets.
This tool is ideal for liquidity-based strategies and helps traders map out possible reversal or sweep zones that often precede aggressive moves.

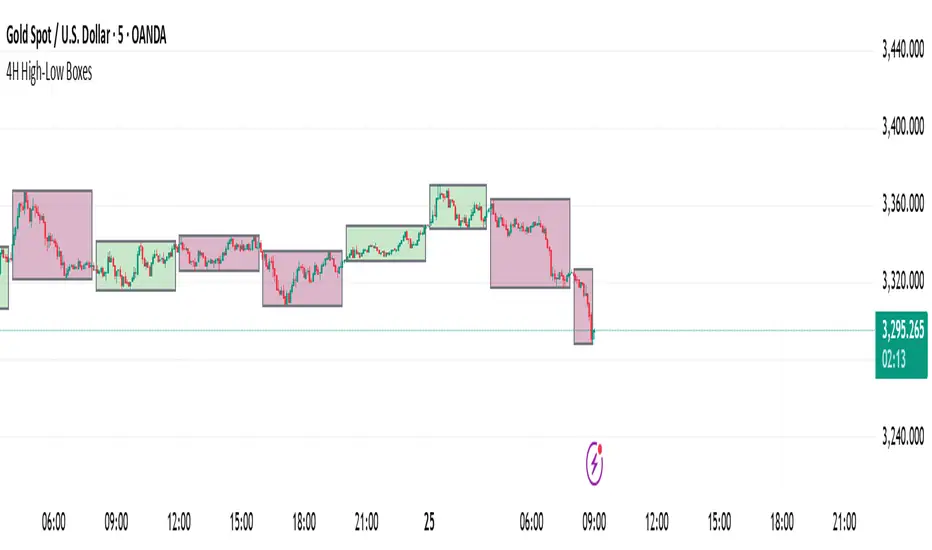
4H High-Low BoxesThis indicator dynamically plots high-low boxes based on the most recent 4-hour candle, providing visual markers for key price levels and trends. The box is updated in real-time to reflect the highest and lowest points of the current 4-hour candle, and its color changes based on the market's direction.
Key Features:
Dynamic Boxes: The indicator automatically adjusts to the 4-hour candle's high, low, and open price, creating a box that updates with price action.
Color-Coding: The box color changes based on the price direction. A green box indicates bullish market sentiment (price is above the 4H open), while a red box indicates bearish sentiment (price is below the 4H open).
Accurate Timeframe Representation: It works across any intraday timeframe (e.g., 5-minute, 15-minute, 1-hour), providing consistent, visually relevant markers for trading decisions.
Real-Time Updates: The box is adjusted dynamically as price evolves, ensuring it accurately represents the 4-hour price range during live trading.
Customizable Settings: Tailor the visual aspects of the box, including border color, background transparency, and other parameters.
Trading Strategy Ideas:
Rejection at High/Low: Look for price rejection at the 4H high/low for potential reversal signals.
Breakout Strategy: Trade breakouts above the 4H high or below the 4H low for momentum trades.
Mean Reversion: Enter when price moves away from the 4H open, expecting it to return to the open price.
This indicator can be used as a standalone tool or combined with other technical indicators to improve entry and exit points. Perfect for swing traders and those using price action to identify key support and resistance levels.
HAPPY TRADING
Daily & Multi-Day High/LowDaily & Multi-Candle High/Low Indicator
This indicator clearly highlights essential price levels directly on your chart, significantly improving your trading decisions:
First Candle High/Low (Session Open):
Quickly identify the high and low of the first candle each trading day, ideal for session-open traders.
Previous Day's High/Low:
Automatically plots the highest and lowest prices from the previous trading day, crucial for daily breakout or reversal strategies.
Multi-Candle High/Low (Customizable Period):
Easily track the highest and lowest points of the last X candles (default: 108 candles). Perfect for spotting key support and resistance zones.
Customization Options:
Adjust colors, line styles (solid, dashed, dotted), and line thickness directly from the settings for personalized visibility.
Ideal for day traders, swing traders, and price-action traders looking for clear and actionable daily levels on their charts.
Pre-London High-Low Breakout IndicatorOverview
The Pre-London High-Low Breakout Indicator helps traders identify breakout opportunities at the London session open. It marks the high and low one hour before London opens (5 PM - 6 PM AEST) and incorporates a 200 SMA filter to confirm trade direction. The indicator also provides real-time breakout markers for precise entries.
How the Indicator Works
1. Pre-London High & Low Identification (5 PM - 6 PM AEST)
The indicator tracks the highest and lowest price levels within this period.
These levels act as key breakout zones once London opens.
The high and low remain visible until 12 AM AEST for reference.
2. 200 SMA as a Trend Filter
A 200 SMA (yellow, thick line) is plotted to filter breakout trades.
Only long (buy) trades are valid if price is above the 200 SMA.
Only short (sell) trades are valid if price is below the 200 SMA.
3. Real-Time Breakout Confirmation
Buy Signal (Green Diamond):
Price breaks above the pre-London high.
Price is above the 200 SMA.
Sell Signal (Red Diamond):
Price breaks below the pre-London low.
Price is below the 200 SMA.
No signal appears if the breakout is against the SMA trend, reducing false trades.
How to Use the Indicator Properly
Step 1: Identify the Pre-London Range (5 PM - 6 PM AEST)
Observe price movements and note the session high & low.
Do not take trades within this period—wait for a clear breakout.
Step 2: Wait for a Breakout After 6 PM AEST
A breakout must occur beyond the session high or low.
The breakout should be clear and decisive, not hovering around the range.
Step 3: Confirm with the 200 SMA
If price is above the 200 SMA, only buy signals are valid.
If price is below the 200 SMA, only sell signals are valid.
If a breakout occurs against the SMA, ignore it.
Step 4: Enter the Trade and Manage Risk
Enter the trade after the breakout candle closes.
Set stop-loss just inside the pre-London range to minimize risk.
Take profit using a 1:2 or 1:3 risk-reward ratio, or trail the stop.
Why This Strategy Works
Pre-London Liquidity Grab: Institutional traders set positions before the London open, making this range significant.
Trend Confirmation with SMA: Reduces false breakouts by filtering trades in the direction of the trend.
Real-Time Breakout Detection: Green and red diamond markers highlight valid breakouts that meet all conditions.
Final Notes
If price breaks out but quickly reverses, it may be a false breakout—avoid impulsive trades.
The indicator works best when combined with other confluences such as volume analysis or key support/resistance levels.
Alerts can be added to notify traders when a valid breakout occurs.
This setup is ideal for traders looking for a structured, rule-based approach to trading London session breakouts with a strong trend confirmation mechanism.

Dynamic Customizable 50% Line & Daily High/Low + True Day OpenA Unique Indicator for Precise Market-Level Analysis
This indicator is a fully integrated solution that automates complex market-level calculations and visualizations, offering traders a tool that goes beyond the functionality of existing open-source alternatives. By seamlessly combining several trading concepts into a single script, it delivers efficiency, accuracy, and customization that cater to both novice and professional traders.
Key Features: A Breakdown of What Makes It Unique
1. Adaptive Daily Highs and Lows
Automatically detects and plots daily high and low levels based on the selected time frame, dynamically updating in real time.
Features session-based adjustments, allowing traders to focus on levels that matter for specific trading sessions (e.g., London, New York).
Fully customizable styling, visibility, and alerts tailored to each trader’s preferences.
How It Works:
The indicator calculates daily high and low levels directly from price data, integrating session-specific time offsets to account for global trading hours. These levels provide traders with clear visual markers for key liquidity zones.
2. Automated ICT 50% Range Line
A pioneering implementation of ICT’s mid-range concept, this feature dynamically calculates and displays the midpoint of the daily range.
Offers traders a visual guide to identify premium and discount zones, aiding in determining market bias and potential trade setups.
How It Works:
The script calculates the range between the day’s high and low, dividing it by two to generate the midline. This line updates in real-time, ensuring that traders always see the most current premium and discount levels as price action evolves.
3. Dynamic Market Open Levels
Plots session opens (e.g., Asia, London, New York) and the True Day Open to provide actionable reference points for intra-day trading strategies.
Enhances precision in identifying liquidity shifts and aligning trades with institutional price movements.
How It Works:
The indicator uses predefined session times to calculate and display the opening levels for key trading sessions. It dynamically adjusts for time zones, ensuring accuracy regardless of the trader’s location.
4. Custom Watermark for Enhanced Visualization
Includes an optional watermark feature that allows users to display custom text on their charts.
Ideal for personalization, branding, or highlighting session notes without disrupting the clarity of the chart.
Why This Indicator Stands Out
First-to-Market Automation:
While the ICT 50% range line is a widely recognized concept, this is the first script to automate its calculation, combining it with other pivotal trading levels in a single tool.
All-in-One Functionality:
Unlike open-source alternatives that focus on individual features, this script integrates daily highs/lows, mid-range levels, session opens, and customizable watermarks into one cohesive system. The consolidation reduces the need for multiple indicators and ensures a clean, efficient chart setup.
Dynamic Customization:
Every feature can be adjusted to align with a trader’s strategy, time zone, or aesthetic preferences. This level of adaptability is unmatched in existing tools.
Proprietary Logic:
The indicator’s underlying calculations are built from scratch, leveraging advanced programming techniques to ensure accuracy and reliability. These proprietary methods differentiate it from similar open-source scripts.
How to Use This Indicator
Apply the Indicator:
Add it to your TradingView chart from the library.
Configure Settings:
Use the intuitive settings panel to adjust plotted levels, colors, styles, and visibility. Tailor the indicator to your trading strategy.
Incorporate into Analysis:
Combine the plotted levels with your preferred trading approach to identify liquidity zones, establish market bias, and pinpoint potential reversals or entries.
Stay Focused:
With all key levels automated and updated in real time, traders can focus on execution rather than manual plotting.
Originality and Justification for Closed Source
This script is closed-source due to its unique combination of features and proprietary logic that automates complex trading concepts like the ICT 50% range line and session-specific levels. Open-source alternatives lack this level of integration and customization, making this indicator a valuable and original contribution to the TradingView ecosystem.
What Sets It Apart from Open-Source Scripts?
Unlike open-source tools, this indicator doesn’t just replicate individual features—it enhances and integrates them into a seamless, all-in-one solution that offers traders a more efficient and effective way to analyze the market.

Historical Swing High-Low Gann IndicatorThe Historical Swing High-Low Gann Indicator is a powerful tool designed to track and visualize key market swing points over time. This indicator identifies significant swing highs and lows within a specified time frame and draws connecting lines between these points, allowing traders to observe the natural ebb and flow of the market.
What sets this indicator apart is its ability to maintain all previously drawn swing lines, creating a comprehensive historical view of market movements. Additionally, the indicator projects Gann-style lines from the most recent swing highs and lows, providing traders with potential future support and resistance levels based on the geometric progression of price action.
Features:
Swing Detection: Automatically detects significant swing highs and lows over a user-defined period (default is 3 hours).
Persistent Historical Lines: Keeps all previously drawn lines, offering a complete visual history of the market's swing points.
Gann-Style Projections: Draws forward-looking lines from the latest swing points to help predict possible future market levels.
Customizable Parameters: Allows users to adjust the swing detection period to suit different trading styles and time frames.
This indicator is ideal for traders who rely on price action, support and resistance levels, and Gann theory for their analysis. Whether used in isolation or as part of a broader strategy, the Historical Swing High-Low Gann Indicator provides valuable insights into the market's behavior over time.

Swing Pivots High LowBINANCE:BTCUSDT
This indicator is an opensource merge of the built in 'Pivot Points High Low' and the most popular 'Swing-high-low-support-resistance' indicators. The original 'Pivot Points High Low' does not have extensions with better visibility, while the most popular 'Swing-high-low-support-resistance' has no source available. I've also added additional configurable alert conditions for Pivot High and Low Crossover/Crossunder.
Please read the official documentation for further information about the indicator.

Strat Assistant Alerts and Highs/LowsStrat Assistant FTC Only
----------------------------
█ OVERVIEW
This script is intended to highlight/draw lines for the prior high/low of 30, 60, day, week, month, quarter, as well as create the alerts for when these thresholds get crossed
Input
----------
The script has inputs for every time frame plotted - 30, 60, day, week, month, quarter. All of the following items below can be "modified"
is the high line active? (for the corresponding time frame, will plot the line yes or no - by default only the DAY is displayed)
is the low line active? (for the corresponding time frame, will plot the line yes or no - by default only the DAY is displayed))
The high line color - modify the color of the corresponding time frame high line to your liking
The low line color - modify the color of the corresponding time frame low line to your liking
The time frame line width - make some lines wider than others for easier distinction
Output
----------
Lines for each corresponding time frame activated in the selected color and width.
Custom alerts - open a stock, select the Alerts button at the top, click the condition as the name of this script. The next drop down will show you all the corresponding alerts you can set for the current price crossing above the prior timelines high or below the prior timelines low (the bracket number is just for sorting purposes).
Best Practices
----------
What's not mapped? - Style (you can't drive this by an input, by default day is dashed, the rest are a solid line)
What's not mapped? - Price on the Y axis. I'm still trying to figure this out, not sure you can do it. I can add a label, just gets cluttered fast
Played with this a little bit using crypto, but obviously I can't test out all these alerts without a lot of things moving. Please do your due diligence.
I know a million people are going to want a million things. I can create more alerts coming soon, for now I wanted to start with this. Please and comments or suggestions or feedback and I'll see what I can do. I can create labels (for price) randomly, but it will clutter the screen. Or I can create one big box or table with prices shown.

Code Plots - High, Low, Open, Close—Daily, Weekly, & Monthly!!!Custom Code Plots High, Low, Open, Close
Plots Today And/Or Previous Day
Daily, Weekly, & Monthly TimeFrames
Default Settings:
Green = High
Silver = Open
Fuchsia = Close
Red = Low
Current D-W-M = Circles as Plots
Previous D-W-M = Cross as Plots
By Default The Current Days High, Low, Open, Close Plots. There are Check boxes On The Inputs Tab To Turn All Options On And Off.
***Tip - For Intra-Day Trades…I Find It Useful To Plot Previous Days High, Low, Open, Close For Support/Resistance, & Breakout Levels. Plotting the Current Weekly and Monthly Levels Is Also Very Useful.
***If You Trade Daily Charts The Previous Months Levels Are Very Useful as Support/Resistance, & Breakout Levels….
Code For High, Low, Open, Close
pastebin.com
Video On Importing Custom Indicators from PasteBin:
videos.tradingview.com

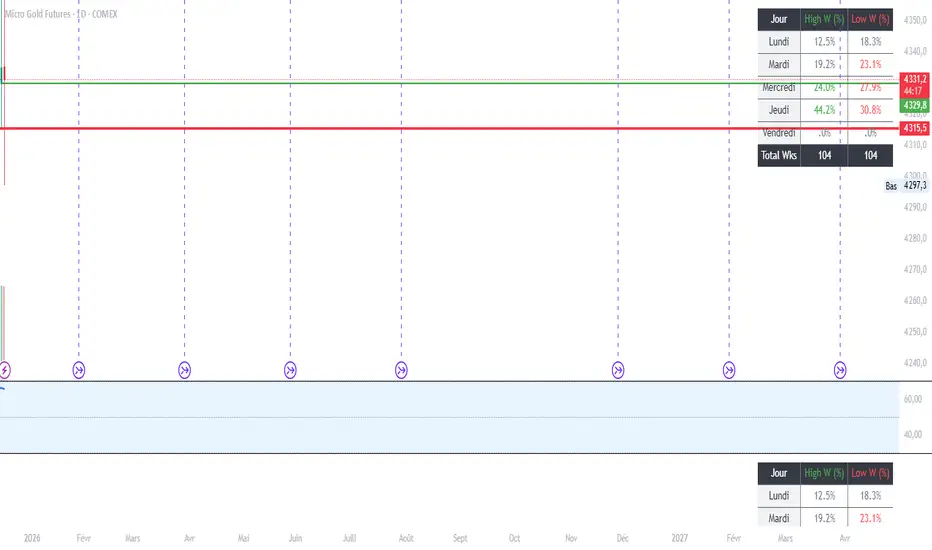
MGC1! - Stats jour du Weekly High/Low Lun VenIndicator Name: Weekly High/Low Day Statistics (Probability Dashboard)
Description:
This indicator provides a statistical edge by analyzing historical price action to determine which day of the week is most likely to form the Weekly High or the Weekly Low.
Designed for intraday traders and swing traders, this tool helps you anticipate the structure of the weekly candle. By understanding the probabilities of when the extremums (HOD/LOD of the week) usually occur, you can better align your trade setups with the true weekly expansion.
Key Features:
Historical Analysis: Calculates statistics based on a user-defined lookback period (default is 104 weeks / 2 years) to ensure statistical significance.
Probability Dashboard: Displays a clean table on the chart showing the percentage chance for each day (Monday to Friday) to be the High or Low of the week.
Rolling Window: Automatically updates data at the close of every week to keep probabilities current.
How to Use (ICT/SMC Context):
Weekly Profiles: Use this data to validate "Classic Tuesday Low" or "Wednesday/Thursday Reversal" profiles.
Bias Confirmation: If the statistics show a 40% chance of the Weekly Low forming on a Tuesday, and price is diving into a Higher Timeframe POI on Tuesday morning, this adds high-probability confluence to your long setups.
Targeting: If the Weekly High typically forms on Thursday and it is currently Wednesday, you can hold runners for an expansion into the next day.
MC High/LowMC High/Low is a minimalist precision tool designed to show traders the most critical price levels — the High and Low of the current Day and Week — in real-time, without any visual clutter or historical trails.
It automatically tracks:
🔼 HOD – High of Day
🔽 LOD – Low of Day
📈 HOW – High of Week
📉 LOW – Low of Week
Each level is plotted using simple black horizontal lines, updated dynamically as the session evolves. Labels are clearly marked and positioned to the right of the screen for easy reference.
There’s no trailing history, no background colors, and no distractions — just pure price structure for clean confluence.
Perfect for:
Intraday scalpers
Swing traders
Liquidity & range traders
This is a tool built for sniper-level execution — straight from the MadCharts mindset.
🛠 Created by:
🔒 Version: Public Release
🎯 Use this with your favorite price action, liquidity, or market structure strategies.

Essa - Yearly High, Low & MidYearly High, Low & Midpoint Indicator
This TradingView indicator helps traders track key yearly price levels by plotting the high, low, and midpoint values for each year within a user-specified range.
Features & Functionality:
Automatic Yearly Calculation: Determines the highest and lowest price for each year and computes the midpoint as their average.
Clear & Customisable Visuals:
The Yearly High is plotted as a solid green line.
The Yearly Low appears as a solid red line.
The Midpoint is displayed as a blue dashed line for easy distinction
Detailed Labels:
Each level is labeled at the far right of the chart, showing the year, level type (High, Low, or Mid), and price (e.g., 2016 High - 1.20000).
Labels are right-aligned in white, ensuring clear visibility against any background.
This indicator is perfect for traders who rely on long-term technical analysis, providing a quick and structured way to visualise significant yearly price levels.

CandelaCharts - Equal Highs/Lows (EQH/EQL) 📝 Overview
The Equal Highs/Lows indicator is a specialized tool for detecting equal highs and lows within price movements.
These levels hold importance as they frequently signal possible reversal zones or consolidation phases in the market. By leveraging Average True Range (ATR) thresholds, the indicator employs tailored settings to pinpoint these critical price levels with precision.
Visual Markings: Lines and labels highlight equal highs and lows directly on the chart.
Dynamic Adaptability: It adjusts in real time to market volatility, ensuring accurate level identification through ATR-based thresholds.
Equal Highs are not used as entry and exit points; instead, they are used as confirmation that the current market trend will reverse. This means that when an EQH is formed on a chart, traders can adapt a bearish bias and look for only short entries.
📦 Features
Key features of the indicator include:
Visual Markings: Lines and labels highlight equal highs and lows directly on the chart.
Dynamic Adaptability: It adjusts in real time to market volatility, ensuring accurate level identification through ATR-based thresholds.
Styling
⚙️ Settings
Show: Controls whether EQH/EQL are displayed on the chart.
Line Style: Controls the line type and line width
Bullish Color: Color of the bullish EQH/EQL
Bearish Color: Color of the bearish EQH/EQL
⚡️ Showcase
Short Term
Intermediate Term
Long Term
🚨 Alerts
This script provides alert options for all signals.
Bearish Signal
A bearish signal is triggered when the price forms an EQH.
Bullish Signal
A bullish signal is triggered when the price forms an EQL.
⚠️ Disclaimer
Trading involves significant risk, and many participants may incur losses. The content on this site is not intended as financial advice and should not be interpreted as such. Decisions to buy, sell, hold, or trade securities, commodities, or other financial instruments carry inherent risks and are best made with guidance from qualified financial professionals. Past performance is not indicative of future results.

Gann High LowGann High Low is a moving average based trend indicator consisting of two different simple moving averages.
The Gann High Low Activator Indicator was described by Robert Krausz in a 1998 issue of Stocks & Commodities Magazine. It is a simple moving average SMA of the previous n period's highs or lows.
The indicator tracks both curves (of the highs and the lows). The close of the bar defines which of the two gets plotted.
This version is showing the channel that needs to be broken if the trend is going to be changed, and it allows you to chose from the 4 basic averages type for calculation (by definition, Gann High Low Activator uses only simple moving average, but some other averages can give you results that are probably more acceptable for trading in some conditions).
Increasing HPeriod and decreasing LPeriod better for short trades, vice versa for long positions.

NoProcess Prior Month/Week/Day High/Low/EQ Prior Period Levels
Plots key support/resistance levels from previous timeframes: Day, Week, and Month.
Levels Displayed:
PDH/PDL/PDE — Prior Day High, Low, and Equilibrium (midpoint)
PWH/PWL/PWE — Prior Week High, Low, and Equilibrium
PMH/PML/PME — Prior Month High, Low, and Equilibrium
Features:
Toggle each timeframe independently
Single color control for clean chart aesthetics
Configurable right extension (1-50 bars)
Dotted line style with labels positioned at line endpoints
Use Case:
Reference levels for institutional order flow concepts. Prior period highs/lows act as liquidity pools; equilibriums mark fair value zones where price often rebalances. Works on any instrument and timeframe.
