New Highs-Lows NASDAQ-Buschi
English:
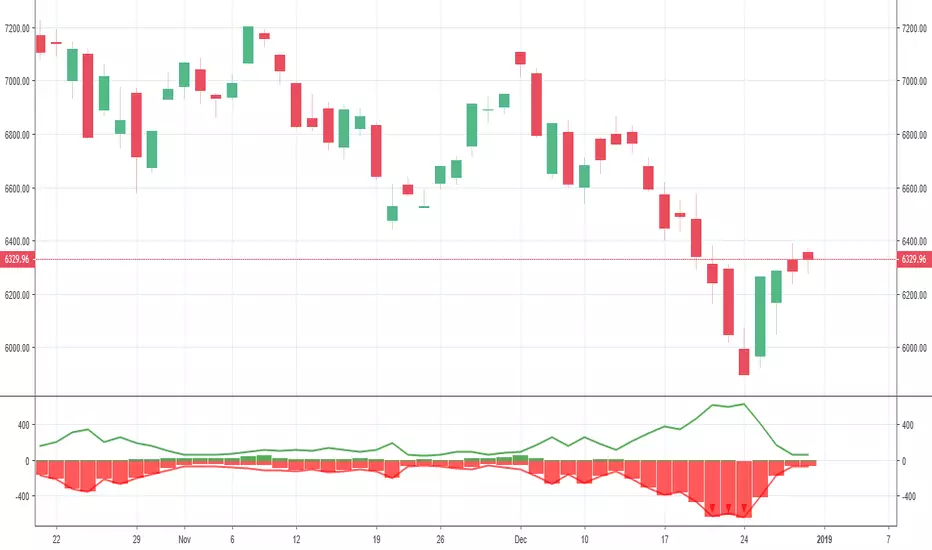
This indicator shows the NASDAQ's new highs (green) and new lows (red).
Extreme trading days with more than 99 % new highs relative to new lows vice versa are marked via lines (theoretically values) and triangles (breaches).
Deutsch:
Dieser Indikator zeigt die neuen Hochs (grün) und neuen Tiefs (rot) der NASDAQ.
Extreme Handelstage mit mehr als 99 % neuen Hochs relativ zu den neuen Tiefs und andersherum sind gekennzeichnet über Linien (theoretische Werte) und Dreiecke (Überschreitungen).
"high low" için komut dosyalarını ara
New Highs-Lows NYSE-Buschi
English:
This indicator shows the NYSE's new highs (green) and new lows (red).
Extreme trading days with more than 99 % new highs relative to new lows vice versa are marked via lines (theoretically values) and triangles (breaches).
Deutsch:
Dieser Indikator zeigt die neuen Hochs (grün) und neuen Tiefs (rot) der NYSE.
Extreme Handelstage mit mehr als 99 % neuen Hochs relativ zu den neuen Tiefs und andersherum sind gekennzeichnet über Linien (theoretische Werte) und Dreiecke (Überschreitungen).

anas Bollinger Bands high low normal bb use normally close in its calculation not considering high and low , and the channel is based on 2 std div , with will present 93% of the close reading with in the band .
my new design will calculate the upper band based on high values , and the lower band based on low values , and the center line on close values
, and 1,65 std will represent 90 % of all reading (high , low , close ) to fall with in the band .
up trend will be considered if close price exceeded the top band lower values (within or outside the band )
down trend will be considered if close price exceeded the lower band higher values (within or outside the band )

[RG9]High Low RibbonsThis indicator shows the 9 different period highs and lows dynamically spaced based off of fibonacci numbers. The parameter fib_start gives the script the starting iteration for the first ribbon period. EX. fib_start of 5 = period of 5. It then also shows 8 more Fibonacci numbers up for high low periods. Ex. 5 8 13 21 34 55 89 144 233 period highs and lows. The white lines are space 1/4, 2/4, and 3/4 of the distance between the longest period low and high.

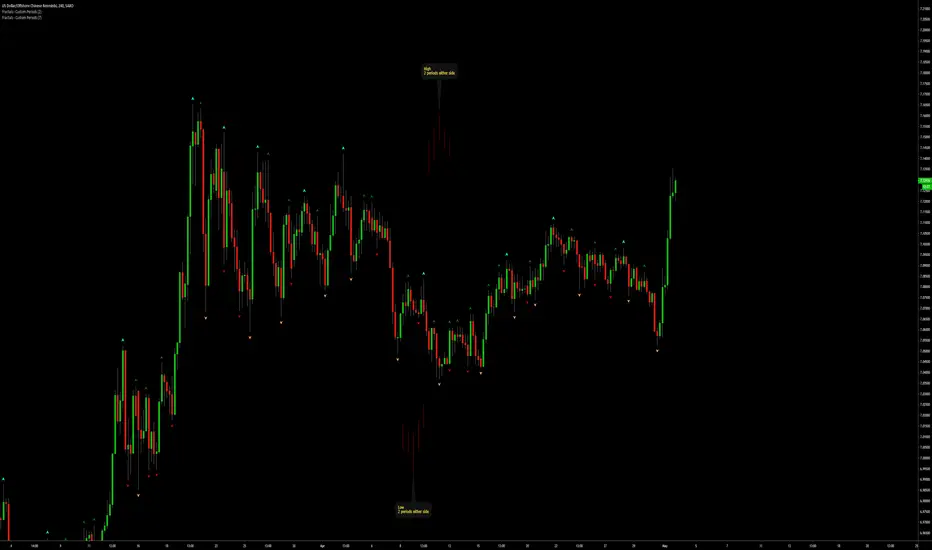
Day High/Low with Fibs for chartmojoFor chartmojo
- TODO: Switch up/down trend automatically, for now you will need to toggle it in the script settings
- The orange 'prediction' line can be toggled in the settings, it will show a new high/low based on the current high/low becoming the new 0.236 fib, look for flat areas to the left, those might become a potential new high/low in the future

CM Gann Swing High Low V2CM Gann Swing High Low V2
Added Improvements:
Used PineScript “linebr" code so solid lines plot only when condition = true.
Via Inputs Tab:
Ability to Turn On/Off Highlight Bars When Crossing Above/Below Swing High Low
Ability to Turn On/Off Back Ground Highlights When Crossing Above/Below Swing High Low
Ability to Turn On/Off linebr plots.
Other Features: All Available Via Inputs Tab
Ability to Adjust Moving Average Values to adjust Sensitivity.
Ability to Turn On/Off Triangles Above/Below Bars based on Indicator.
Ability to Turn On/Off Triangles at Top And Bottom Of Screen Showing Direction of Indicator.
***Basically you have Option to View Indicator about every way possible.
***Special Thanks to Glaz for Original Code.

Sessions High/LowIndicator lines to show the prior days NY high/low, overnight Asian high/low, and recent London high/low. Time frame variables are included as well as the option to change colors for both the high and low. Good luck.

Fractals | Swing Points | Highs & Lows | Custom PeriodsSimple script which marks out key swing highs & lows.
One of the only indicators I have on the chart most days
- perfect for naked charting
- quickly helps you to visually identify key areas of interest
An extension of Bill Williams fractals
- aka short term swing points
Allows you to filter for only the most prominent swing points
- you can even overlay multiple swingpoint filters in different colours (as per example chart)
The number ( Fractal Periods) is simply:
- the number of less prominent points either side of your swing high/low
- example shown on the chart
Otherwise make a fist
- look at your 5 knuckles
- swing high is your middle knuckle
- 2 lower points either side
Bill Williams Original Fractal:
Fractal Periods = 2
Your Fractal Period for Filtering:
3, 4, 5, 30, 365, etc
Allows you to find swing points down to:
Fractal Periods = 1
Simple, easy, shared to enjoy =)

Fractals | Swing Points | Highs & Lows | Custom PeriodsSimple script which marks out key swing highs & lows.
One of the only indicators I have on the chart most days
- perfect for naked charting
- quickly helps you to visually identify key areas of interest
An extension of Bill Williams fractals
- aka short term swing points
Allows you to filter for only the most prominent swing points
- you can even overlay multiple swingpoint filters in different colours (as per example chart)
The number (Fractal Periods) is simply:
- the number of less prominent points either side of your swing high/low
- example shown on the chart
Otherwise make a fist
- look at your 5 knuckles
- swing high is your middle knuckle
- 2 lower points either side
Bill Williams Original Fractal:
Fractal Periods = 2
Your Fractal Period for Filtering:
3, 4, 5, 30, 365, etc
Simple, easy, shared to enjoy =)
Session First 5-Min High/LowHere's a professional description for your indicator:
Session First 5-Min High/Low Marker
This indicator automatically identifies and marks the high and low price levels established during the first 5 minutes of major trading sessions, helping traders identify key intraday support and resistance zones.
Key Features:
Tracks three major trading sessions in IST (Indian Standard Time):
Asian Session: 5:30 AM - 5:35 AM
London Session: 12:30 PM - 12:35 PM
New York Session: 5:30 PM - 5:35 PM
Draws horizontal lines at the highest and lowest prices reached during each session's opening 5-minute window
Color-coded for easy identification (Yellow for Asian, Blue for London, Red for New York)
Lines extend across the chart to help track price reactions throughout the day
Clean, minimal design with optional labels
Best Used For:
Identifying key intraday support and resistance levels
Session breakout trading strategies
Understanding institutional order flow at market opens
Works on 1-minute timeframe for precise tracking
Customizable Settings:
Toggle line extensions on/off
Adjust line width (1-5)
Change colors for each session
Show/hide session labels
Perfect for day traders and scalpers who trade around major session openings and want to identify high-probability support/resistance zones established during peak liquidity periods.
This description explains what the indicator does, its practical applications, and its key features in a way that's clear for TradingView users.RetryClaude can make mistakes. Please double-check responses.

[DEM] No High/Low Bars No High/Low Bars is a simple yet effective price action indicator that identifies potential reversal points by marking bars where the closing price equals either the session's high or low. The indicator generates buy signals (blue triangles below the bar) when the close equals the high, suggesting strong bullish momentum that pushed price to its peak by session end, and sell signals (red triangles above the bar) when the close equals the low, indicating bearish pressure that drove price to its lowest point. This approach captures moments of decisive directional movement where buyers or sellers maintained control throughout the entire session, effectively filtering out indecisive price action and highlighting bars with clear directional commitment. The simplicity of this method makes it particularly useful for identifying momentum shifts and potential continuation or reversal points based purely on the relationship between closing prices and session extremes.
Previous Day/Week High, Low, Midpoint LinesI put together this script as I couldn’t find exactly what I was looking for on Tradingview.
The script plots the previous day and week high and low as well as the midpoint of the range between the daily and weekly high and low. These lines stop printing once a price candle crosses the lines.
This may be of use to you. Enjoy!

Previous Day High Low Close By Anil ChawraHow Users Can Make Profit Using This Script:
1. Calculate the difference between the previous day's high and low prices to determine the price range.
2. Identify if today's close price is significantly higher or lower than the previous day's close price.
3. If today's close price is at least 10 points higher than the previous close, consider a potential buy signal.
4. If today's close price is at least 10 points lower than the previous close, consider a potential sell signal.
5. These signals indicate potential profit opportunities based on significant price movements.
6. Users should verify market conditions and perform additional analysis before executing trades.
7. Monitoring price action and volume can help confirm the validity of these signals.
8. Implementing stop-loss orders can help mitigate risks associated with trading based on price movements.
9. Regularly reviewing and adjusting trading strategies based on market conditions is essential for long-term success.
10. Exercise caution and discipline when trading, and consider seeking advice from financial professionals if needed.
How the Script Works:
1. The strategy analyzes the high, low, and close prices of the previous trading day.
2. It calculates the range of prices by subtracting the low from the high.
3. The close price of the current trading day is compared to the previous day's close.
4. If today's close is significantly higher than yesterday's close, it could indicate bullish sentiment.
5. Conversely, if today's close is significantly lower, it could suggest bearish sentiment.
6. A threshold, typically 10 points, is set to identify significant price movements.
7. If today's close is at least 10 points higher, it triggers a potential buy signal.
8. If it's at least 10 points lower, it triggers a potential sell signal.
9. Users can act on these signals to enter or exit trades for potential profit.
10. Regular monitoring, risk management, and market analysis are essential for effective implementation of this strategy.

Key Levels (Open, Premarket, & Yesterday)OVERVIEW
This indicator automatically identifies and draws recent high-probability support and resistance levels (recent key levels). Specifically, yesterdays highs / lows, premarket highs / lows, as well as yesterdays end of day Volume Weighted Average Price and trader specified Moving Average.
This is most useful on charts with intraday time frames (1 minute, 5 minute etc.) commonly used for day trading. This is not ideal for larger time frames (greater than 1 hour) commonly used for swing trading or identifying larger trends.
INPUTS
You can configure:
Line size, style, and colors
Label colors
Which key levels you want to see
Moving Average Parameters
Market Hours and Time Zone
DEV NOTES
This script illustrates:
A method for iterative management of more complex data objects (not just discrete values) with loops and arrays.

All-In-One Sessions, Weekly, Monday, Previous Highs/LowsWe are forever drawing key levels on our charts with saved drawing templates, but finding the levels, adding the labels, is all tedious stuff. We have indicators, but we have multiple different ones at a time.
What if you could just tick a box on/off?
Well now you can.
This all in one 'levels' indicator is designed to show all the key highs and lows from previous weeks, Monday, the current week, as well as an option to highlight the market sessions and their highs and lows.
There are lots of options available for extending lines and choosing their colors, so once you have set it up how you want, don't forget to save YOUR defaults.
Oorah.

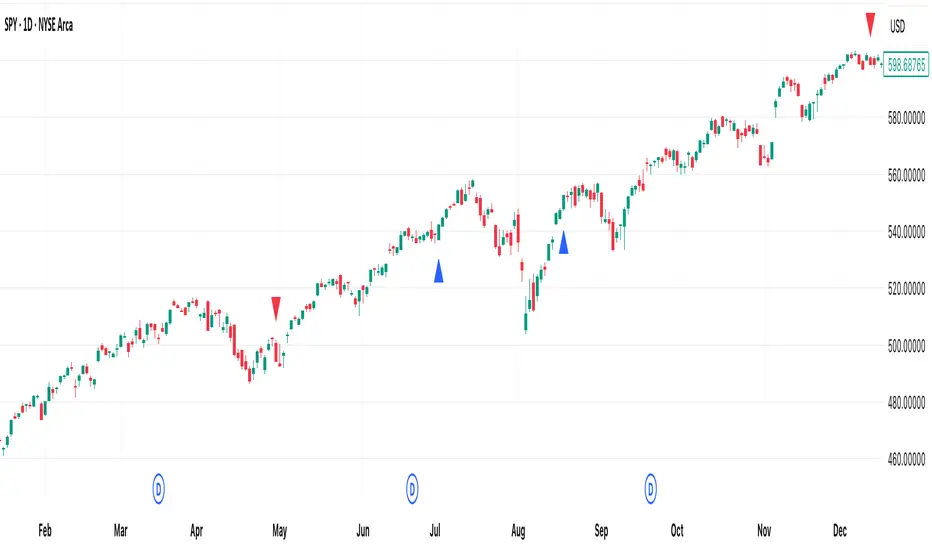
Pivot High/Low Analysis & Forecast [LuxAlgo]Returns pivot points high/low alongside the percentage change between one pivot and the previous one (Δ%) and the distance between the same type of pivots in bars (Δt). The trailing mean for each of these metrics is returned on a dashboard on the chart. The indicator also returns an estimate of the future time position of the pivot points.
This indicator by its very nature is not real-time and is meant for descriptive analysis alongside other components of the script. This is normal behavior for scripts detecting pivots as a part of a system and it is important you are aware the pivot labels are not designed to be traded in real-time themselves
🔶 USAGE
The indicator can provide information helping the user to infer the position of future pivot points. This information is directly used in the indicator to provide such forecasting. Note that each metric is calculated relative to the same type of pivot points.
It is also common for analysts to use pivot points for the construction of various figures, getting the percentage change and distance for each pivot point can allow them to eventually filter out points of non-interest.
🔹 Forecast
We use the trailing mean of the distance between respective pivots to estimate the time position of future pivot points, this can be useful to estimate the location of future tops/bottoms. The time position of the forecasted pivot is given by a vertical dashed line on the chart.
We can see a successful application of this method below:
Above we see the forecasted pivots for BTCUSD15. The forecast of interest being the pivot high. We highlight the forecast position with a blue dotted line for reference.
After some time we obtain a new pivot high with a new forecast. However, we can see that the time location of this new pivot high matches perfectly with the prior forecast.
The position in time for the forecast is given by:
x1_ph + E
x1_pl + E
where x1_ph denotes the position in time of the most recent pivot high. x1_pl denotes the position in time of the most recent pivot low and E the average distance between respective pivot points.
🔶 SETTINGS
Length: Window size for the detection of pivot points.
Show Forecasted Pivots: Display forecast of future pivot points.
🔹 Dashboard
Dashboard Location: Location of the dashboard on the chart
Dashboard Size: Size of the dashboard on the chart
Text/Frame Color: Determines the color of the frame grid as well as the text color

Session High/LowSession High Low
Trading Sessions
Forex Sessions (oder Futures Sessions, je nachdem, was du handelst)
Pine Script Indicator
Intraday Levels
Market Sessions
High Low Lines
Day Trading Tools

London Killzone High/Low (live → lock & extend @07:59 UTC-5)London Killzone High/Low (live → lock & extend @07:59 UTC-5)London Killzone High/Low (live → lock & extend @07:59 UTC-5)

Tokyo Session High/Low (live → lock & extend @02:59 UTC-5)Tokyo Session High/Low (live → lock & extend @02:59 UTC-5)Tokyo Session High/Low (live → lock & extend @02:59 UTC-5)

NY KZ High/Low (live → lock @10:00 UTC-5)NY KZ High/Low (live → lock @10:00 UTC-5) NY KZ High/Low (live → lock @10:00 UTC-5)

Scalp Recent High/Low (Stable v5 r4)UMA Scalp Levels(ウマ・スキャル・レベルズ)
UMA Scalp Levels
Automatically detects recent swing highs and lows —
the “psychological levels” most watched by traders —
and alerts you when a valid breakout occurs.
🔹 Detects swing highs/lows automatically (non-repainting)
🔹 Confirm breakouts by close or wick (configurable)
🔹 Filters small fakeouts using ATR / % thresholds
🔹 Supports breakout alerts (up / down / retest)
🔹 MTF compatible — e.g., show 15m levels on 5m chart
Ideal for scalpers and day traders who want to catch momentum
immediately after a breakout of key levels.
直近で“市場が意識している高値・安値ライン”を自動で検出し、
ブレイク時にサインとアラートを出す、順張り型のスキャルピング指標。
🔹 スイング高値・安値を自動抽出(リペイント耐性あり)
🔹 終値 or ヒゲ抜けでブレイク判定(選択可能)
🔹 ATRや%幅でノイズを除外(小さな抜けをフィルタリング)
🔹 アラート対応(上抜け/下抜け/リテスト検知)
🔹 MTF対応(例:15分足ラインを5分足チャートに表示)
短期トレードで最も意識される「節目の抜け」を視覚化し、
勢いに乗る順張りトレードの精度を高めます。

RTH & ETH High/Low (Today & Prev)RTH and ETH High Low Indicator. This draws a line for the ETH and RTH highs and lows for todays session and yesterdays session. it allows you to toggle off any of the 8 potential levels as well as change the colour of the 8 levels. WIP

New Highs-Lows US (NYSE,NASDAQ,AMEX) New 52-weeks Highs vs. Lows US market (NYSE,NASDAQ,AMEX)
Enjoy ;)
