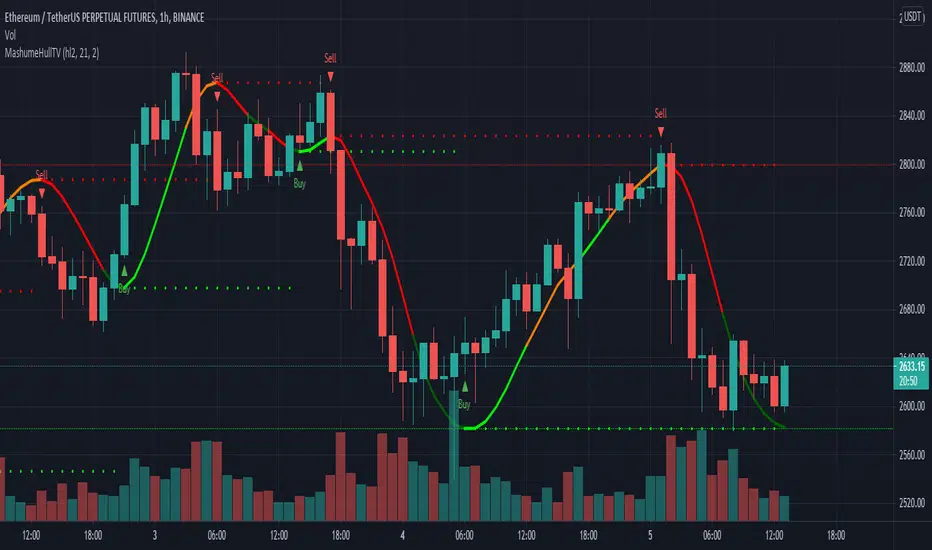
MashumeHullTV█ OVERVIEW
This plots the Hull Moving Average Turning Points and Concavity
with the addition of colored segments representing concavity and turning points: maxima, minima and inflection.
a fast way to determine the trend direction and possible reversals based on concavity of the trend
Dark Green: Concave Up but HMA decreasing. The 'mood' has changed and the declining trend of the HMA is slowing. Possible trend change to Uptrend soon
Light Green: Concave up and HMA increasing. Price is increasing, and since the curve is still concave up, it is accelerating upward. Uptrend
Orange: Concavity is now downward, and though price is still increasing, the rate has slowed, perhaps the mood has become less enthusiastic. Possible trend change to Downtrend soon
Red: Concave down and HMA decreasing. Downtrend
Buy signals generated when Hull turns from Dark Green -> Light Green
Sell signals generated when Hull turns from Orange -> Red
To best determine if this is a entry point or a trend reversal, it is recommended to use in conjunction with the QQEMoMoTV indicator
█ FEATURES
Calculations
Calculates the concavity of the Hull Moving Average comparing the Hull concavity of the current bar to the previous bar and displays the concavity in the form of 4 different colors.
Note: may cause repainting, so recommended to use with another indicator such as the QQEMoMoTV indicator to confirm signals.
Calculates divergence between the calculated HMA and the actual price and displays this in the Divergence Label.
Calculates the local minima, maxima and inflection points with the ability to display these as auto support/resistance lines.
Inputs
You can use the script's inputs to configure:
• Calculation Source (default HL2)
• HMA Length (default 21)
• Lookback (default 2)
• Whether to show Auto Support/Resist Lines
• Whether to show Buy/Sell Arrows
• Whether to show Divergence Label
• Whether to extend Local Auto Support/Resist Lines
Alerts
Buy Signal alert based on HMA crossing above MA_Min/Hull Support, when Hull turns from Dark Green -> Light Green, Bullish
Sell Signal alert based on HMA crossing below MA_Max/Hull Resistance, when Hull turns from Orange -> Red, Bearish
Experimental support for applying the indicator to higher time frames
eg. charting the hourly MashumeHull indicator on 15 min chart. See the commented code to access this feature
█ CREDITS
Original Author: Seth Urion (Mashume)
Feature upgrades and usage: Xiuying
Converted to Tradingview by: Machdragon
"ha溢价率" için komut dosyalarını ara
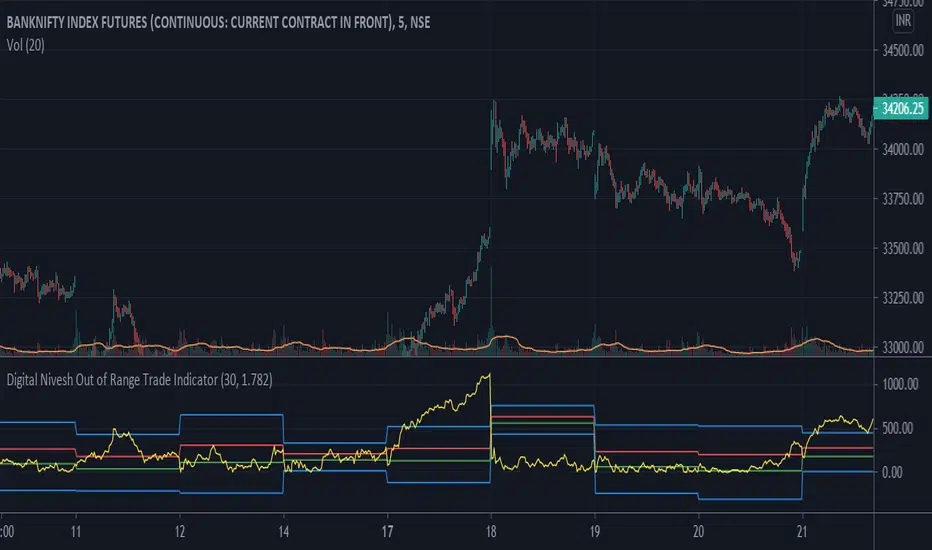
Digital Nivesh Out of Range Trade IndicatorThis indicator is for intraday with the basic logic that any script will always trade in its range.
So , if any script moves away from its range, it will try to come back to its normal range movement.
Suppose average movement of any share is 100 points, and share has moved more than 150 points there is high probability that it will move in opposite direction in order to have average movement of price of 100.
For Stocks please use average period as 15 days for index 30 days.
If share price(YELLOW LINE) moves away from higher or lower blue line, then with the help of volume confirmation a trade can be initiated in opposite direction.
Please note direction needs to be opposite of what has happened in the day.
for eg. upper blue line could be broken , in both situation i.e.. share price is rising or falling,
so if share price is rising and upper blue line is broken:
Bearsish trade can be initiated with the help of price action n volume.
if share price has falledn and upper blue is broken:
Bullish trade can be initiated with the help of volume n price action confirmation.
Baus BandsThe Baus Bands are a simplified version of another one of my trend following indicators, the Neapolitan Bands. This version only shows the trend trading zones in green and red. An additional 21 EMA with an ATR band was added as part of my own trend trading rules using these bands.
How do I read this indicator?
Is the blue band between and not touching the green or red clouds? The condition is ranging.
Is the blue band touching the green cloud? The condition is a bullish trend.
Is the blue band touching the red cloud? The condition is a bearish trend.
The trend trading rules are exactly the same as the default Neapolitans, but include an extra condition.
A trend has started once 2 conditions are met:
Price has entered either trending cloud.
The 21 EMA ATR band in blue is within the same cloud.
With those conditions met, if you expect the trend to continue, trade pull-backs to the blue band in the direction of the trending cloud.
Isn't this just a 21 EMA trading pull-backs strategy?
No. The 21 EMA alone is not sufficient in my opinion to define a range or trend technically. Always buying the 21 EMA pull-back, especially in a range, is not a great strategy by itself unless you've already identified price as trending. Baus Bands adds that trend identification.
Why make this?
Baus Bands show the conditions I personally use for catching trends and identifying ranges with these indicators, and shows only the information I use.
What's the purpose of the ATR band around the 21 EMA?
Sometimes price will open and close below the 21 EMA and cause some technical analysts will say the trend is over. I added the ATR specifically to get a volatility based, upper and lower bound range around the 21 EMA. that way I have an acceptable price range where price could move past the 21 EMA and still keep a trend valid using similar rules. I then saw that so long this ATR band (not the 21 EMA itself) was touching those trending clouds, then the trend has a good chance of continuing as long as that was true.

72s Strat: Backtesting Adaptive HMA+ pt.1This is a follow up to my previous publication of Adaptive HMA+ few months ago, as a mean to provide some kind of initial backtesting tools. Which can be use to explore many possible strategies, optimise its settings to better conform user's pair/tf, and hopefully able to help tweaking your general strategy.
If you haven't read the study or use the indicator, kindly go here first to get the overall idea.
The first strategy introduce in this backtest is one most basic already described in the study; buy/sell is when movement is there and everything is on the right side; When RSI has turned to other side, we can use it as exit point (if in profit of course, else just let it hit our TP/SL, why would we exit before profit). Also, base on RSI when we make entry, we can further differentiate type of signals. --Please check all comments in code directly where the signals , entries , and exits section are.
Second additional strategy to check; is when we also use second faster Adaptive HMA+ for exit. So this is like a double orders on a signal but with different exit-rule (/more on this on snapshots below). Alternatively, you can also work the code so to only use this type of exit.
There's also an additional feature which you can enable its visuals, the Distance Zone , is to help measuring price distance to our xHMA+. It's just a simple atr based envelope really, I already put the sample code in study's comment section, but better gonna update it there directly for non-coder too, after this.
In this sample I use Lot for order quantity size just because that's what I use on my broker. Also what few friends use while we forward-testing it since the study is published, so we also checked/compared each profit/loss report by real number. To use default or other unit of measurement, change the entry code accordingly.
If you change your order size, you should also change the commission in Properties Tab. My broker commission is 5 USD per order/lot, so in there with example order size 0.1 lot I put commission 0.5$ per order (I'll put 2.5$ for 0.5 lot, 10$ for 2 lot, and so on). Crypto usually has higher charge. --It is important that you should fill it base on your broker.
SETTINGS
I'm trying to keep it short. Please explore it further again. (Beginner should also first get acquaintance with terms use here.)
ORDERS:
Base Minimum Profit Before Exit:
The number is multiplier of ongoing ATR. Means that when basic exit condition is met, algo will check whether you're already in minimum profit or not, if not, let it still run to TP or SL, or until it meets subsequent exit condition, then it will check again.
Default Target Profit:
Multiplier of ATR at signal. If reached before any eligible exit condition is met, exit TP.
Base StopLoss Point:
You can change directly in code to use other like ATR Trailing SL, fix percent SL, or whatever. In the sample, 4 options provided.
Maximum StopLoss:
This is like a safety-net, that if at some point your chosen SL point from input above happens to be exceeding this maximum input that you can tolerate, then this max point is the one will be use as SL.
Activate 2nd order...:
The additional doubling of certain buy/sell with different exits as described above. If enable, you should also set pyramiding to at least: 2. If not, it does nothing.
ADAPTIVE HMA+ PERIOD
Many users already have their own settings for these. So in here I only sample the default as first presented in the study. Make it to your adaptive.
MARKET MOVEMENT
(1) Now you can check in realtime how much slope degree is best to define your specific pair/tf is out of congestion (yellow) area. And (2) also able to check directly what ATR lengths are more suitable defining your pair's volatility.
DISTANCE ZONE
Distance Multiplier. Each pair/tf has its own best distance zone (in xHMA+ perspective). The zone also determine whether a signal should appear or not. (Or what type of signal, if you wanna go more detail in constructing your strategy)
USAGE
(Provided you already have your own comfortable settings for minimum-maximum period of Adaptive HMA+. Best if you already have backtested it manually too and/or apply as an add-on to your working strategy)
1. In our experiences, first most important to define is both elements in the Market Movement Settings . These also tend to be persistent for whole season since it's kinda describing that pair/tf overall behaviour. Don't worry if you still get a low Profit Factor here, but by tweaking you should start to see positive changes in one of Max Drawdown and Net Profit, or Percent Profitable.
2. Afterwards, find your pair/tf Distance Zone . When optimising this, what we seek is just a "not to bad" equity curves to start forming. At least Max Drawdown should lessen more. Doesn't have to be great already, but should be better, no red in Net Profit.
3. Then go manage the "Trailing Minimum Profit", TP, SL, and max SL.
4. Repeat 1,2,3. 👻
5. Manage order size, commission, and/or enable double-order (need pyramiding) if you like. Check if your equity can handle max drawdown before margin call.
6. After getting an acceptable backtest result, go to List of Trades tab and find the biggest loss or when many sequencing loss in a row happened. Click on it to go to exact point on chart, observe why the signal failed and get at least general idea how it can be prevented . The rest is yours, you should know your pair/tf more than other.
You can also re-explore your minimum-maximum period for both Major and minor xHMA+.
Keep in mind that all numbers in Setting are conceptually in a form of range . You don't want to get superb equity curves but actually a "fragile" , means one can easily turn it to disaster just by changing only a fraction in one/two of the setting.
---
If you just wanna test the strength of the indicator alone, you can disable "Use StopLoss" temporarily while optimising settings.
Using no SL might be tempting in overall result data in some cases, but NOTE: It is not recommended to not using SL, don't forget that we deliberately enter when it's in high volatility. If want to add flexibility or trading for long-term, just maximise your SL. ie.: chose SL Point>ATR only and set it maximum. (Check your max drawdown after this).
I think this is quite important specially for beginners, so here's an example; Hypothetically in below scenario, because of some settings, the buy order after the loss sell signal didn't appear. Let's say if our initial capital only 1000$ using leverage and order size 0,5 lot (risky position sizing already), moreover if this happens at the beginning of your trading season, that's half of account gone already in one trade . Your max SL should've made you exit after that pumping bar.
The Trailing Minimum Profit is actually look like this. Search in the code if you want to plot it. I just don't like too many lines on chart.
To maximise profit we can try enabling double-order. The only added rule coded is: RSI should rising when buy and falling when sell. 2nd signal will appears above or below default buy/sell signal. (Of course it's also prone to double-loss, re-check your max drawdown after. Profit factor play its part in here for a long run). Snapshot in comparison:
Two default sell signals on left closed at RSI exit, the additional sell signal closed later on when price crossover minor xHMA+. On buy side, price haven't met our minimum profit when first crossunder minor xHMA+. If later on we hit SL on this "+buy" signal, at least we already profited from default buy signal. You can also consider/treat this as multiple TP points.
For longer-term trading, what you need to maximise is the Minimum Profit , so it won't exit whenever an exit condition happened, it can happen several times before reaching minimum profit. Hopefully this snapshot can explain:
Notice in comparison default sell and buy signal now close in average after 3 days. What's best is when we also have confirmation from higher TF. It's like targeting higher TF by entering from smaller TF.
As also mention in the study, we can still experiment via original HMA by putting same value for minimum-maximum period setting. This is experimental EU 1H with Major xHMA+: 144-144, Flat market 13, Distance multiplier 3.6, with 2nd order activated.
Kiwi was a bit surprising for me. It's flat market is effectively below 6, with quite far distance zone of 3.5. Probably because I'm using big numbers in adaptive period.
---
The result you see in strategy tester report below for EURUSD 15m is using just default settings you see in code, as follow:
0,1 lot for each order (which is the smallest allowed by my broker).
No pyramiding. Commission: 0.5 usd per order. Slippage: 3
Opening position is only using basic strategy #1 (RSI exit). Additional exit not activated.
Minimum Profit: 1. TP: 3.
SL use: Half-distance zone. Max SL: 4.5.
Major xHMA+: 172-233. minor xHMA+: 89-121
Distance Zone Multiplier: 2.7
RSI: Standard 14.
(From our forward-testing, the difference we get from net profit is because of the spread, our entry isn't exactly at the close/open price. Not so much though, but not the same. If somebody can direct me to any example where we can code our entry via current bid/ask price, that would be awesome!)
It's already a long post (sorry), think I'm gonna pause here. Check out the code :)
---
DISCLAIMER: Past performance is no guarantee of future results , and so on.. you know the drill ;)
Please read whole description first before using, don't take 1-2 paragraph and claim it's the whole logic, you are responsible of your own actions and understanding.

Crypto Bands with ToolsThis indicator has 3 bands
1. Upper Band
2. Middle Band
3. Lower Band
1. Upper Band
Average of Moving Average of the Close (add Standard Deviations) and Highest price reached in the prior period
2. Middle Band
Average of upper and middle bands. And middle band also has BUY-SELL function. If middle band is blue you can BUY and if the middle band colored red you can SELL
3. Lower Band
Average of Moving Average of the Close(subtract Standard Deviations) and Lowest price reached in the prior period
Upper and Lower bands can be used for BUY&SELL strategy.
You can buy when price touches the lower band
You can sell when price touches the upper band
Indicator can work with long and short positions aswell
As you can see when price touches the lower band you can be LONG
and when the price touches the upper band you can be SHORT
When stock prices continually touch the upper DMR Band, the prices are thought to be overbought; conversely, when they continually touch the lower band, prices are thought to be oversold, triggering a buy signal. When using DMR Bands, designate the upper and lower bands as price targets.
indicator has ichimoku and some moving averages for checking the support and resistances.

Alpha & BetaHow to use Alpha(α)?
If Alpha is positive the stock outperforms, if the value is negative means the stock underperforms.
α < 0: The investment has earned too little for its risk (or, was too risky for the return)
α = 0: The investment has earned a return adequate for the risk taken
α > 0: The investment has a return in excess of the reward for the assumed risk
How to use Beta(β)?
β = 1: Exactly as volatile as the index
β > 1: More volatile than the index
β < 1 > 0: Less volatile than the index
β = 0: Uncorrelated to the index
β < 0: Negatively correlated to the index
β > 2: Trending stock
Higher the β higher risk/reward
Example: If the beta is 1.1, the share price is like to move by 10% more than the index
Trading Tip
Choose a stock with Alpha greater than 0 and Beta greater than 1.9 for intraday in 5min timeframe for long positions
Remember that such stocks will have high risk and high reward
Shortlist stocks with Beta greater than 1.9 for next day in 5min timeframe

Directional Movement Index and ADXDMI (ADX) consists of three indicators that measure a trend’s strength and direction. Three lines compose the Direction Movement Index (DMI): ADX (white/gray line), DI+ (green line), and DI- (orange line). The Average Directional Index (ADX) line shows the strength of the trend. The higher the ADX value, the stronger the trend. The ADX line is white when it has a positive slope, otherwise it is gray.
The Plus Direction Indicator (DI+) and Minus Direction Indicator (DI-) show the current price direction. When the DI+ is above DI-, the current price momentum is up. When the DI- is above DI+, the current price momentum is down.
Trend detection: When the background has a bluish color there is an upward trend, and when the background has a reddish color there is a downward trend.
Includes an information panel that shows the current value and trend of some well-known indicators.

Zweig Market Breadth Thrust Indicator StrategyThe Breadth Thrust Indicator is a technical indicator which determines market momentum, signaling the start of a potential new bull market.
The Breadth Thrust Indicator was developed by Martin Zweig, an American stock investor, financial analyst, and investment adviser. According to Zweig, the concept is based on the principle that the sudden change of money in the investment markets elevates stocks and signals increased liquidity. In other words, this indicator is all about how quickly the NYSE's advancing and declining numbers go from poor to great in a compressed time period.
A "Thrust" indicates that the stock market has rapidly changed from an oversold condition to one of strength, but has not yet become overbought. This is very rare and has happened only a few times. Dr . Zweig also points out that most bull markets begin with a Breadth Thrust.
More info can be found at www.investopedia.com
I have inspired by indicator introduced in TradingView by LazyBear and adopted the logic from there. Thanks LazyBear !!!
Though indicator signals the new Bull market, but I have not found much information how to use it in daily market. So I had come up with a strategy, which would allow us to trade SPY, QQQ , AMEX and securities under these markets.
I have used MA setting as 65 (since Zweig indicator setting was 10 days , based on that I set 65 for Hourly chart ... 10d x 6.5 Hrs = 65 in my startegy). You have to change this setting if you change the timeframe. Also , note that this strategy is for Stock Market only.
Strategy Rule/Settings
===================
Select the market type based on your security symbol.
SPY => use NYSE
QQQ => use NASDAQ
any other security => check exchange it was listed and select the corresponding market.
if you dont know , use COMBINED option
BUY
====
when indicator cross 0.40 from below
Note:
1. see how well it picks the bottoms ... example : Nov 2020 ....
2. setting 0.45 is also produces good results , only thing is you get more signals.
EXIT
=====
Exit when indicator cross down from 0.60 . I have used RSI (5) for partial exits. These two are available in settings
Close the whole position when indicator crossing down 0.40
STOP LOSS
=========
defaulted to 5%
Please Note , I have tested SPY , QQQ on Horly chart with MA 65. You need to chnage the MA setting based on your time frame and check the results.
WARNING
========
For the use of educational purposes only

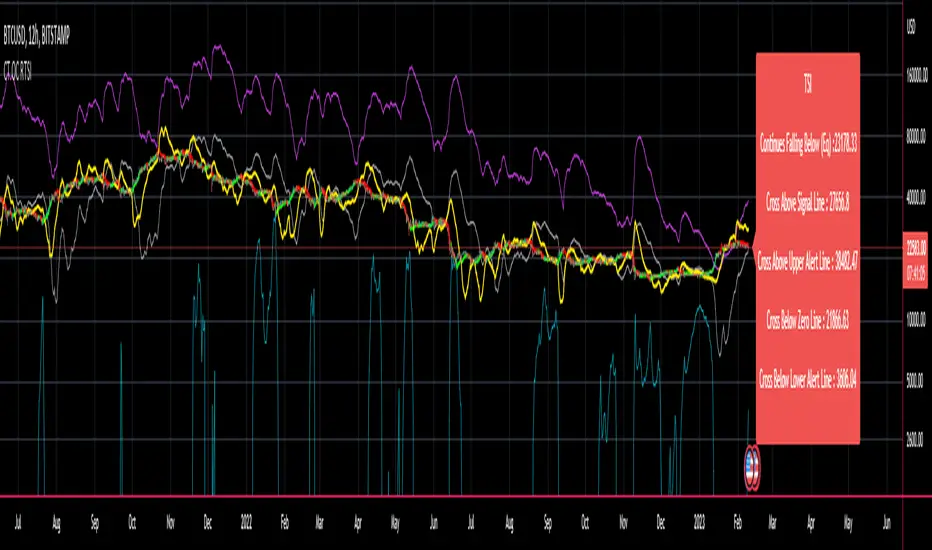
CT Reverse True Strength Indicator On ChartIntroducing the Caretakers “On Chart” Reverse True Strength Index.
According to Wikipedia….
“The True Strength Index (TSI) is a technical indicator used in the analysis of financial markets that attempts to show both trend direction and overbought/oversold conditions. It was first published William Blau in 1991.
The indicator uses moving averages of the underlying momentum of a financial instrument.
Momentum is considered a leading indicator of price movements, and a moving average characteristically lags behind price.
The TSI combines these characteristics to create an indication of price and direction more in sync with market turns than either momentum or moving average.”
The TSI has a normal range of values between +100 and -100.
Traditionally traders and analysts will consider:
Positives values above 25 to indicate an “overbought” condition
Negative values below -25 to indicate an “oversold” condition
I have reverse engineered the True Strength Index formula to derive 2 new functions.
1) The reverse TSI function is dual purpose which can be used to calculate….
The chart price at which the TSI will reach a particular TSI scale value.
The chart price at which the TSI will equal its previous value.
2) The reverse TSI signal cross function can be used to calculate the chart price at which the TSI will cross its signal line.
I have employed these functions here to return the price levels where the True Strength Index would equal :
Upper alert level ( default 25 )
Zero-Line
Lower alert level ( default -25 )
Previous TSI (eq) value
TSI signal line
In this “On Chart” version of the reverse True Strength Index the crossover levels are displayed both as lines on the chart and via an optional info-box with choice of user selected info.
Chart Line Colors
Upper alert level... ( Fuchsia )
Zero-Line............ ( White )
Lower alert level... ( Aqua )
TSI (eq)...............( TSI (eq) > close..Orange, TSI (eq) < close..Lime )
TSI signal line........( Signal Cross Line > Close..Aqua, Signal Cross Line < Close..Fuchsia )
How to interpret the displayed prices returned from the TSI scale zero line and upper and lower alert levels.
Closing exactly at the given price will cause the True Strength Index value to equal the scale value.
Closing above the given price will cause the True Strength Index to cross above the scale value.
Closing below the given price will cause the True Strength Index to cross below the scale value.
How to interpret the displayed price returned from the TSI (eq)
Closing exactly at the price will cause the True Strength Index value to equal the previous TSI value.
Closing above the price will cause the True Strength Index value to increase.
Closing below the price will cause the True Strength Index value to decrease.
How to interpret the displayed price returned from the TSI signal line crossover.
Closing exactly at the given price will cause the True Strength Index value to equal the signal line.
Closing above the given price will cause the True Strength Index to cross above the signal line.
Closing below the given price will cause the True Strength Index to cross below the signal line.
Common methods to derive signals from the TSI :
Zero-line crossovers
When the CMO crosses above the zero-line, a buy signal is generated.
When the CMO crosses below the zero-line, a sell signal is generated.
“Overbought” and “Oversold” crossovers
When the SMI crosses below -25 and then moves back above it, a buy signal is generated.
When the SMI crosses above +25 and then moves back below it, a sell signal is generated.
What Does the True Strength Index (TSI) Tell You?
The indicator is primarily used to identify overbought and oversold conditions in an asset's price, spot divergence, identify trend direction and changes via the zero-line, and highlight short-term price momentum with signal line crossovers.
Since the TSI is based on price movements, oversold and overbought levels will vary by the asset being traded. Some stocks may reach +30 and -30 before tending to see price reversals, while another stock may reverse near +20 and -20.
Mark extreme TSI levels, on the asset being traded, to see where overbought and oversold is. Being oversold doesn't necessarily mean it is time to buy, and when an asset is overbought it doesn't necessarily mean it is time to sell. Traders will typically watch for other signals to trigger a trade decision. For example, they may wait for the price or TSI to start dropping before selling in overbought territory. Alternatively, they may wait for a signal line crossover.
Signal Line Crossovers
The true strength index has a signal line, which is usually a seven- to 13-period EMA of the TSI line. A signal line crossover occurs when the TSI line crosses the signal line. When the TSI crosses above the signal line from below, that may warrant a long position. When the TSI crosses below the signal line from above, that may warrant selling or short selling.
Signal line crossovers occur frequently, so should be utilized only in conjunction with other signals from the TSI. For example, buy signals may be favoured when the TSI is above the zero-line. Or sell signals may be favoured when the TSI is in overbought territory.
Zero-line Crossovers
The zero-line crossover is another signal the TSI generates. Price momentum is positive when the indicator is above zero and negative when it is below zero. Some traders use the zero-line for a directional bias. For example, a trader may decide only to enter a long position if the indicator is above its zero-line. Conversely, the trader would be bearish and only consider short positions if the indicator's value is below zero.
Breakouts and Divergence
Traders can use support and resistance levels created by the true strength index to identify breakouts and price momentum shifts. For instance, if the indicator breaks below a trendline, the price may see continued selling.
Divergence is another tool the TSI provides. If the price of an asset is moving higher, while the TSI is dropping, that is called bearish divergence and could result in a downside price move. If the TSI is rising while the price is falling, that could signal higher prices to come. This is called bullish divergence.
Divergence is a poor timing signal, so it should only be used in conjunction with other signals generated by the TSI or other technical indicators.
The Difference Between the True Strength Index (TSI) and the Moving Average Convergence Divergence (MACD) Indicator.
The TSI is smoothing price changes to create a technical oscillator. The moving average convergence divergence (MACD) indicator is measuring the separation between two moving averages. Both indicators are used in similar ways for trading purposes, yet they are not calculated the same and will provide different signals at different times.
The Limitations of Using the True Strength Index (TSI)
Many of the signals provided by the TSI will be false signals. That means the price action will be different than expected following a trade signal. For example, during an uptrend, the TSI may cross below the zero-line several times, but then the price proceeds higher even though the TSI indicates momentum has shifted down.
Signal line crossovers also occur so frequently that they may not provide a lot of trading benefit. Such signals need to be heavily filtered based on other elements of the indicator or through other forms of analysis. The TSI will also sometimes change direction without price changing direction, resulting in trade signals that look good on the TSI but continue to lose money based on price.
Divergence also tends to unreliable on the indicator. Divergence can last so long that it provides little insight into when a reversal will actually occur. Also, divergence isn't always present when price reversals actually do occur.
The TSI should only be used in conjunction with other forms of analysis, such as price action analysis and other technical indicators.
This is not financial advice, use at your own risk.
CT Reverse True Strength IndicatorIntroducing the Caretakers Reverse True Strength Index.
According to Wikipedia….
“The True Strength Index (TSI) is a technical indicator used in the analysis of financial markets that attempts to show both trend direction and overbought/oversold conditions. It was first published William Blau in 1991.
The indicator uses moving averages of the underlying momentum of a financial instrument.
Momentum is considered a leading indicator of price movements, and a moving average characteristically lags behind price.
The TSI combines these characteristics to create an indication of price and direction more in sync with market turns than either momentum or moving average.”
The TSI has a normal range of values between +100 and -100.
Traditionally traders and analysts will consider:
Positives values above 25 to indicate an “overbought” condition
Negative values below -25 to indicate an “oversold” condition
I have reverse engineered the True Strength Index formula to derive 2 new functions.
The reverse TSI function is dual purpose which can be used to calculate….
The chart price at which the TSI will reach a particular TSI scale value.
The chart price at which the TSI will equal its previous value.
The reverse TSI signal cross function can be used to calculate the chart price at which the TSI will cross its signal line.
I have employed these functions here to return the price levels where the True Strength Index would equal :
Upper alert level ( default 25 )
Zero-Line
Lower alert level ( default -25 )
Previous TSI (eq) value.
TSI signal line
These crossover levels are displayed via an optional info-box with choice of user selected info.
How to interpret the displayed prices returned from the TSI scale zero line and upper and lower alert levels.
Closing exactly at the given price will cause the True Strength Index value to equal the scale value.
Closing above the given price will cause the True Strength Index to cross above the scale value.
Closing below the given price will cause the True Strength Index to cross below the scale value.
How to interpret the displayed price returned from the TSI (eq)
Closing exactly at the price will cause the True Strength Index value to equal the previous TSI value.
Closing above the price will cause the True Strength Index value to increase.
Closing below the price will cause the True Strength Index value to decrease.
How to interpret the displayed price returned from the TSI signal line crossover.
Closing exactly at the given price will cause the True Strength Index value to equal the signal line.
Closing above the given price will cause the True Strength Index to cross above the signal line.
Closing below the given price will cause the True Strength Index to cross below the signal line.
Common methods to derive signals from the TSI :
Zero-line crossovers
When the CMO crosses above the zero-line, a buy signal is generated.
When the CMO crosses below the zero-line, a sell signal is generated.
“Overbought” and “Oversold” crossover
When the SMI crosses below -25 and then moves back above it, a buy signal is generated.
When the SMI crosses above +25 and then moves back below it, a sell signal is generated.
What Does the True Strength Index (TSI) Tell You?
The indicator is primarily used to identify overbought and oversold conditions in an asset's price, spot divergence, identify trend direction and changes via the zero-line, and highlight short-term price momentum with signal line crossovers.
Since the TSI is based on price movements, oversold and overbought levels will vary by the asset being traded. Some stocks may reach +30 and -30 before tending to see price reversals, while another stock may reverse near +20 and -20.
Mark extreme TSI levels, on the asset being traded, to see where overbought and oversold is. Being oversold doesn't necessarily mean it is time to buy, and when an asset is overbought it doesn't necessarily mean it is time to sell. Traders will typically watch for other signals to trigger a trade decision. For example, they may wait for the price or TSI to start dropping before selling in overbought territory. Alternatively, they may wait for a signal line crossover.
Signal Line Crossovers
The true strength index has a signal line, which is usually a seven- to 13-period EMA of the TSI line. A signal line crossover occurs when the TSI line crosses the signal line. When the TSI crosses above the signal line from below, that may warrant a long position. When the TSI crosses below the signal line from above, that may warrant selling or short selling.
Signal line crossovers occur frequently, so should be utilized only in conjunction with other signals from the TSI. For example, buy signals may be favoured when the TSI is above the zero-line. Or sell signals may be favoured when the TSI is in overbought territory.
Zero-line Crossovers
The zero-line crossover is another signal the TSI generates. Price momentum is positive when the indicator is above zero and negative when it is below zero. Some traders use the zero-line for a directional bias. For example, a trader may decide only to enter a long position if the indicator is above its zero-line. Conversely, the trader would be bearish and only consider short positions if the indicator's value is below zero.
Breakouts and Divergence
Traders can use support and resistance levels created by the true strength index to identify breakouts and price momentum shifts. For instance, if the indicator breaks below a trendline, the price may see continued selling.
Divergence is another tool the TSI provides. If the price of an asset is moving higher, while the TSI is dropping, that is called bearish divergence and could result in a downside price move. If the TSI is rising while the price is falling, that could signal higher prices to come. This is called bullish divergence.
Divergence is a poor timing signal, so it should only be used in conjunction with other signals generated by the TSI or other technical indicators.
The Difference Between the True Strength Index (TSI) and the Moving Average Convergence Divergence (MACD) Indicator.
The TSI is smoothing price changes to create a technical oscillator. The moving average convergence divergence (MACD) indicator is measuring the separation between two moving averages. Both indicators are used in similar ways for trading purposes, yet they are not calculated the same and will provide different signals at different times.
The Limitations of Using the True Strength Index (TSI)
Many of the signals provided by the TSI will be false signals. That means the price action will be different than expected following a trade signal. For example, during an uptrend, the TSI may cross below the zero-line several times, but then the price proceeds higher even though the TSI indicates momentum has shifted down.
Signal line crossovers also occur so frequently that they may not provide a lot of trading benefit. Such signals need to be heavily filtered based on other elements of the indicator or through other forms of analysis. The TSI will also sometimes change direction without price changing direction, resulting in trade signals that look good on the TSI but continue to lose money based on price.
Divergence also tends to unreliable on the indicator. Divergence can last so long that it provides little insight into when a reversal will actually occur. Also, divergence isn't always present when price reversals actually do occur.
The TSI should only be used in conjunction with other forms of analysis, such as price action analysis and other technical indicators.
This is not financial advice, use at your own risk.
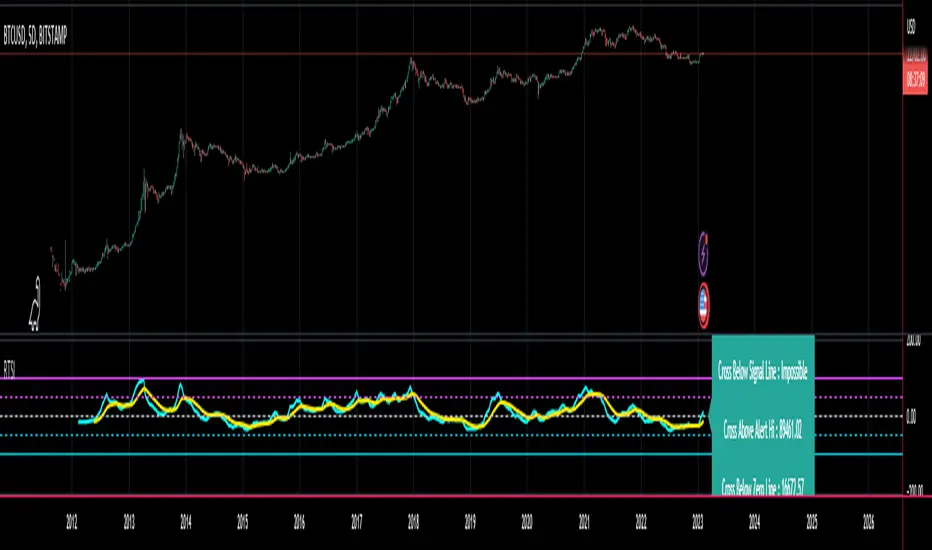
Pi Cycle Top Indicator for BTCUSDThis indicator adds the Pi Cycle Top Indicator for BTCUSD to your chart.
Indicator Overview
The Pi Cycle Top Indicator has historically been effective in picking out the timing of market cycle highs to within 3 days. It uses the 111 day moving average (111DMA) and a newly created multiple of the 350 day moving average, the 350DMA x 2.
For the past three market cycles, when the 111DMA moves up and crosses the 350DMA x 2 we see that it coincides with the price of Bitcoin peaking. It is also interesting to note that 350 / 111 is 3.153, which is very close to Pi = 3.142. In fact, it is the closest we can get to Pi when dividing 350 by another whole number.
It once again demonstrates the cyclical nature of Bitcoin price action over long time frames. Though in this instance it does so with a high degree of accuracy over the past 7 years.
How It Can Be Used
Pi Cycle Top is useful to indicate when the market is very overheated. So overheated that the shorter term moving average, which is the 111 day moving average, has reached a x2 multiple of the 350 day moving average. Historically it has proved advantageous to sell Bitcoin at this time in Bitcoin's price cycles.

Matrix Library (Linear Algebra, incl Multiple Linear Regression)What's this all about?
Ever since 1D arrays were added to Pine Script, many wonderful new opportunities have opened up. There has been a few implementations of matrices and matrix math (most notably by TradingView-user tbiktag in his recent Moving Regression script: ). However, so far, no comprehensive libraries for matrix math and linear algebra has been developed. This script aims to change that.
I'm not math expert, but I like learning new things, so I took it upon myself to relearn linear algebra these past few months, and create a matrix math library for Pine Script. The goal with the library was to make a comprehensive collection of functions that can be used to perform as many of the standard operations on matrices as possible, and to implement functions to solve systems of linear equations. The library implements matrices using arrays, and many standard functions to manipulate these matrices have been added as well.
The main purpose of the library is to give users the ability to solve systems of linear equations (useful for Multiple Linear Regression with K number of independent variables for example), but it can also be used to simulate 2D arrays for any purpose.
So how do I use this thing?
Personally, what I do with my private Pine Script libraries is I keep them stored as text-files in a Libraries folder, and I copy and paste them into my code when I need them. This library is quite large, so I have made sure to use brackets in comments to easily hide any part of the code. This helps with big libraries like this one.
The parts of this script that you need to copy are labeled "MathLib", "ArrayLib", and "MatrixLib". The matrix library is dependent on the functions from these other two libraries, but they are stripped down to only include the functions used by the MatrixLib library.
When you have the code in your script (pasted somewhere below the "study()" call), you can create a matrix by calling one of the constructor functions. All functions in this library start with "matrix_", and all constructors start with either "create" or "copy". I suggest you read through the code though. The functions have very descriptive names, and a short description of what each function does is included in a header comment directly above it. The functions generally come in the following order:
Constructors: These are used to create matrices (empy with no rows or columns, set shape filled with 0s, from a time series or an array, and so on).
Getters and setters: These are used to get data from a matrix (like the value of an element or a full row or column).
Matrix manipulations: These functions manipulate the matrix in some way (for example, functions to append columns or rows to a matrix).
Matrix operations: These are the matrix operations. They include things like basic math operations for two indices, to transposing a matrix.
Decompositions and solvers: Next up are functions to solve systems of linear equations. These include LU and QR decomposition and solvers, and functions for calculating the pseudo-inverse or inverse of a matrix.
Multiple Linear Regression: Lastly, we find an implementation of a multiple linear regression, including all the standard statistics one can expect to find in most statistical software packages.
Are there any working examples of how to use the library?
Yes, at the very end of the script, there is an example that plots the predictions from a multiple linear regression with two independent (explanatory) X variables, regressing the chart data (the Y variable) on these X variables. You can look at this code to see a real-world example of how to use the code in this library.
Are there any limitations?
There are no hard limiations, but the matrices uses arrays, so the number of elements can never exceed the number of elements supported by Pine Script (minus 2, since two elements are used internally by the library to store row and column count). Some of the operations do use a lot of resources though, and as a result, some things can not be done without timing out. This can vary from time to time as well, as this is primarily dependent on the available resources from the Pine Script servers. For instance, the multiple linear regression cannot be used with a lookback window above 10 or 12 most of the time, if the statistics are reported. If no statistics are reported (and therefore not calculated), the lookback window can usually be extended to around 60-80 bars before the servers time out the execution.
Hopefully the dev-team at TradingView sees this script and find ways to implement this functionality diretly into Pine Script, as that would speed up many of the operations and make things like MLR (multiple linear regression) possible on a bigger lookback window.
Some parting words
This library has taken a few months to write, and I have taken all the steps I can think of to test it for bugs. Some may have slipped through anyway, so please let me know if you find any, and I'll try my best to fix them when I have time to do so. This library is intended to help the community. Therefore, I am releasing the library as open source, in the hopes that people may improving on it, or using it in their own work. If you do make something cool with this, or if you find ways to improve the code, please let me know in the comments.

TSI HMA CCIHi!
This strategy has TSI and CCI indicators with the CCI being based on a HMA instead of the Price.
There is a number of conditions that must combine to create buy or sell signals, but it is basically a couple of MA crossovers.
The strategy opens new orders on each candle if the conditions are met, Either direction, so it is hedging.
It wont open new orders if there is a floating loss, and so is constantly attempting to hold a floating profit (drawup instead of drawdown)
But It has a StopLoss (set by user) for closing of losing orders, and it closes all orders in basket style when account is in profit to users set amount target profit.
Low commission set to simulate swap but Forex pairs generally dont have commission like the crypto exchanges do. So if you use this on cryptos, remember to increase the commission to your brokers amount.
Crypto users will likely find that because this opens so many orders the commission could erase its profits.
So i recommend this for Forex only, and perhaps, only NZDUSD 4H chart. other pairs, change settings for.
The strategy has settings for testing on target time spans, so you could test it on just Jan-Feb 2020 for example, if you want, or from Jan 2020 to present day.
Have Fun! Open Script for copy/paste/edit/publish your own version :)

Correlation MeterThis script calculates the covariance and correlation coefficient between two markets using arrays.
Lookback: How many bars to perform the calculation on.
Source: Price source to calculate the correlation on.
Reference Market: The reference market to compare to the current market.
It's a simple indicator, but very useful for determining how correlated your preferred markets to trade are.
A correlation reading of +1.0 means the markets are perfectly positively correlated, a reading of -1.0 means they are perfectly negatively correlated.
If you're not sure what correlation & covariance are then Google the terms with "Investopedia" added to the end - they have some great definitions and examples.
For traders this can be useful for deciding how much risk to spread across two markets that have a high correlation, or how to hedge existing positions by trading a negatively correlated market.
For investors this can be useful for building a truly diversified portfolio.
If a market has a high positive correlation, the black line will stay above zero most of the time. If a market has a high negative correlation, the black line will stay below zero most of the time.
A market with no or little correlation will bounce between the two or hover around zero most of the time.
The example market above is comparing Apple's weekly price action to the S&P500's over the past 20 weeks. It has a high positive correlation as the black line is above zero most of the time.
Good luck with your trading!

Risk Management: Position Size & Risk RewardHere is a Risk Management Indicator that calculates stop loss and position sizing based on the volatility of the stock. Most traders use a basic 1 or 2% Risk Rule, where they will not risk more than 1 or 2% of their capital on any one trade. I went further and applied four levels of risk: 0.25%, 0.50%, 1% and 2%. How you apply these different levels of risk is what makes this indicator extremely useful. Here are some common ways to apply this script:
• If the stock is extremely volatile and has a better than 50% chance of hitting the stop loss, then risk only 0.25% of your capital on that trade.
• If a stock has low volatility and has less than 20% change of hitting the stop loss, then risk 2% of your capital on that trade.
• Risking anywhere between 0.25% and 2% is purely based on your intuition and assessment of the market.
• If you are on a losing streak and you want to cut back on your position sizing, then lowering the Risk % can help you weather the storm.
• If you are on a winning streak and your entries are experiencing a higher level of success, then gradually increase the Risk % to reap bigger profits.
• If you want to trade outside the noise of the market or take on more noise/risk, you can adjust the ATR Factor.
• … and whatever else you can imagine using it to benefit your trading.
The position size is calculated using the Capital and Risk % fields, which is the percentage of your total trading capital (a.k.a net liquidity or Capital at Risk). If you instead want to calculate the position size based on a specific amount of money, then enter the amount in the Custom Risk Amt input box. Any amount greater than 0 in the Custom Risk Amt field will override the values in the Capital and Risk % fields.
The stop loss is calculated by using the ATR. The default setting is the 14 RMA, but you can change the length and smoothing of the true range moving average to your liking. Selecting a different length and smoothing affects the stop loss and position size, so choose these values very carefully.
The ATR Factor is a multiplier of the ATR. The ATR Factor can be used to adjust the stop loss and move it outside of the market noise. For the more volatile stock, increase the factor to lower the stop loss and reduce the chance of getting stopped out. For stocks with less volatility , you can lower the factor to raise the stop loss and increase position size. Adjusting the ATR Factor can also be useful when you want the stop loss to be at or below key levels of support.
The Market Session is the hours the market is open. The Market Session only affects the Opening Range Breakout (ORB) option, so it’s important to change these values if you’re trading the ORB and you’re outside of Eastern Standard Time or you’re trading in a foreign exchange.
The ORB is a bonus to the script. When enabled, the indicator will only appear in the first green candle of the day (09:30:00 or 09:30 AM EST or the start time specified in Market Session). When using the ORB, the stop loss is based on the spread of the first candle at the Open. The spread is the difference between the High and Low of the green candle. On 1-day or higher timeframes, the indicator will be the spread of the last (or current) candle.
The output of the indicator is a label overlaying the chart:
1. ATR (14 RMA x2) – This indicated that the stop loss is determined by the ATR. The x2 is the ATR Factor. If ORB is selected, then the first line will show SPREAD, instead of ATR.
2. Capital – This is your total capital or capital at risk.
3. Risk X% of Capital – The amount you’re risking on a % of the Capital. If a Custom Risk Amt is entered, then Risk Amount will be shown in place of Capital and Risk % of Capital.
4. Entry – The current price.
5. Stop Loss – The stop loss price.
6. -1R – The stop loss price and the amount that will be lost of the stop loss is hit.
7. – These are the target prices, or levels where you will want to take profit.
This script is primarily meant for people who are new to active trading and who are looking for a sound risk management strategy based on market volatility . This script can also be used by the more experienced trader who is using a similar system, but also wants to see it applied as an indicator on TradingView. I’m looking forward to maintaining this script and making it better in future revisions. If you want to include or change anything you believe will be a good change or feature, then please contact me in TradingView.

Pi Cycle Top IndicatorIndicator Overview
The Pi Cycle Top Indicator has historically been effective in picking out the timing of market cycle highs to within 3 days.
It uses the 111 day moving average (111DMA) and a newly created multiple of the 350 day moving average, the 350DMA x 2.
Note: The multiple is of the price values of the 350DMA not the number of days.
For the past three market cycles, when the 111DMA moves up and crosses the 350DMA x 2 we see that it coincides with the price of Bitcoin peaking.
It is also interesting to note that 350 / 111 is 3.153, which is very close to Pi = 3.142. In fact, it is the closest we can get to Pi when dividing 350 by another whole number.
It once again demonstrates the cyclical nature of Bitcoin price action over long time frames. Though in this instance it does so with a high degree of accuracy over the past 7 years.
How It Can Be Used
Pi Cycle Top is useful to indicate when the market is very overheated. So overheated that the shorter term moving average, which is the 111 day moving average, has reached a x2 multiple of the 350 day moving average. Historically it has proved advantageous to sell Bitcoin at this time in Bitcoin's price cycles.
Created By
Philip Swift

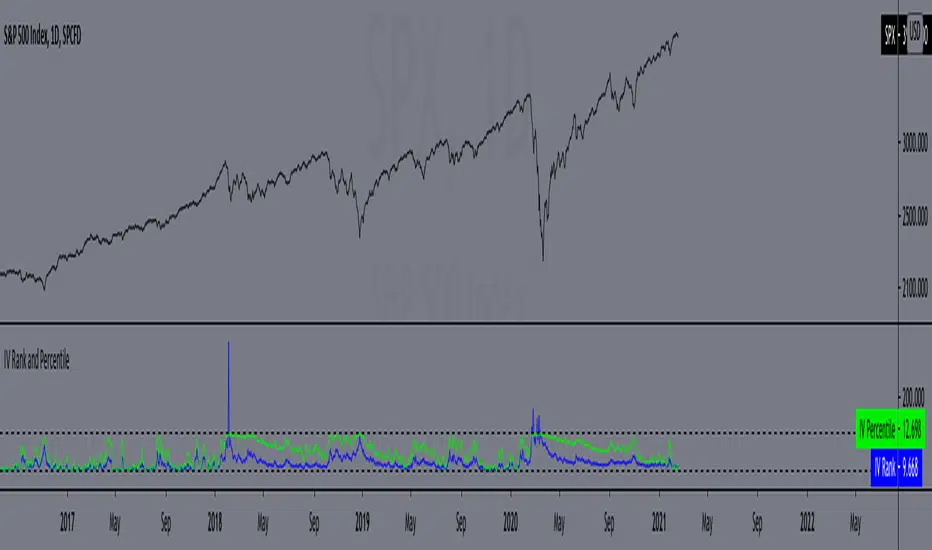
IV Rank and Percentile"All stocks in the market have unique personalities in terms of implied volatility (their option prices). For example, one stock might have an implied volatility of 30%, while another has an implied volatility of 50%. Even more, the 30% IV stock might usually trade with 20% IV, in which case 30% is high. On the other hand, the 50% IV stock might usually trade with 75% IV, in which case 50% is low.
So, how do we determine whether a stock's option prices (IV) are relatively high or low?
The solution is to compare each stock's IV against its historical IV levels. We can accomplish this by converting a stock's current IV into a rank or percentile.
Implied Volatility Rank (IV Rank) Explained
Implied volatility rank (IV rank) compares a stock's current IV to its IV range over a certain time period (typically one year).
Here's the formula for one-year IV rank:
(Current IV - 1 Year Low IV) / (1 Year High IV - 1 Year Low IV) * 100
For example, the IV rank for a 20% IV stock with a one-year IV range between 15% and 35% would be:
(20% - 15%) / (35% - 15%) = 25%
An IV rank of 25% means that the difference between the current IV and the low IV is only 25% of the entire IV range over the past year, which means the current IV is closer to the low end of historical levels of implied volatility.
Furthermore, an IV rank of 0% indicates that the current IV is the very bottom of the one-year range, and an IV rank of 100% indicates that the current IV is at the top of the one-year range.
Implied Volatility Percentile (IV Percentile) Explained
Implied volatility percentile (IV percentile) tells you the percentage of days in the past that a stock's IV was lower than its current IV.
Here's the formula for calculating a one-year IV percentile:
Number of trading days below current IV / 252 * 100
As an example, let's say a stock's current IV is 35%, and in 180 of the past 252 days, the stock's IV has been below 35%. In this case, the stock's 35% implied volatility represents an IV percentile equal to:
180/252 * 100 = 71.42%
An IV percentile of 71.42% tells us that the stock's IV has been below 35% approximately 71% of the time over the past year.
Applications of IV Rank and IV Percentile
Why does it help to know whether a stock's current implied volatility is relatively high or low? Well, many traders use IV rank or IV percentile as a way to determine appropriate strategies for that stock.
For example, if a stock's IV rank is 90%, then a trader might look to implement strategies that profit from a decrease in the stock's implied volatility, as the IV rank of 90% indicates that the stock's current IV is at the top of its range over the past year (for a one-year IV rank).
On the other hand, if a stock's IV rank is 0%, then traders might look to implement strategies that profit from an increase in implied volatility, as the IV rank of 0% indicates the stock's current implied volatility is at the bottom of its range over the past year."
This script approximates IV by using the VIX products, which calculate the 30-day implied volatility of the specified security.
*Includes an option for repainting -- default value is true, meaning the script will repaint the current bar.
False = Not Repainting = Value for the current bar is not repainted, but all past values are offset by 1 bar.
True = Repainting = Value for the current bar is repainted, but all past values are correct and not offset by 1 bar.
In both cases, all of the historical values are correct, it is just a matter of whether you prefer the current bar to be realistically painted and the historical bars offset by 1, or the current bar to be repainted and the historical data to match their respective price bars.
As explained by TradingView,`f_security()` is for coders who want to offer their users a repainting/no-repainting version of the HTF data.
Ark Crypto HeatlineThis is the 'on chart' indicator. See also "Ark Crypto Heatband" indicator for a side-by-side BTC view, without a re-scaled line.
The crypto landscape is largely dominated by BTC and characterised by cyclical stages with varying degrees of mean reversion.
To understand what stage of the cycle we are currently experiencing, it is useful to examine to what degree the current price has extended beyond the long term average that BTC has established. This is true even when analysing other crypto assets as BTC is the dominant force in the crypto asset class.
This indicator uses the 1400 period daily SMA , which is broadly the 200 period weekly SMA. This can be configured, but historically has represented a baseline to which BTC commonly returns.
The graph plots current price in terms of multiples of this long term average. Traditionally, at multiples beyond 10, BTC is considered overextended with a higher likelihood of trending towards the mean thereafter. Colors indicate the extent of price extension.
Where the indicator is applied to non BTCUSD pairs, a smoothed conversion is applied, seeking to superimpose the BTC long period SMA onto the current chart.
The indicator specifically references BTC by default on all charts, as it is designed to use BTC as general purpose indication of where crypto as a whole currently sits. Accordingly the indicator is only to be used on crypto charts.
For best results on BTC, using BNC:BLX will give the longest historical view.

Waindrops [Makit0]█ OVERALL
Plot waindrops (custom volume profiles) on user defined periods, for each period you get high and low, it slices each period in half to get independent vwap, volume profile and the volume traded per price at each half.
It works on intraday charts only, up to 720m (12H). It can plot balanced or unbalanced waindrops, and volume profiles up to 24H sessions.
As example you can setup unbalanced periods to get independent volume profiles for the overnight and cash sessions on the futures market, or 24H periods to get the full session volume profile of EURUSD
The purpose of this indicator is twofold:
1 — from a Chartist point of view, to have an indicator which displays the volume in a more readable way
2 — from a Pine Coder point of view, to have an example of use for two very powerful tools on Pine Script:
• the recently updated drawing limit to 500 (from 50)
• the recently ability to use drawings arrays (lines and labels)
If you are new to Pine Script and you are learning how to code, I hope you read all the code and comments on this indicator, all is designed for you,
the variables and functions names, the sometimes too big explanations, the overall structure of the code, all is intended as an example on how to code
in Pine Script a specific indicator from a very good specification in form of white paper
If you wanna learn Pine Script form scratch just start HERE
In case you have any kind of problem with Pine Script please use some of the awesome resources at our disposal: USRMAN , REFMAN , AWESOMENESS , MAGIC
█ FEATURES
Waindrops are a different way of seeing the volume and price plotted in a chart, its a volume profile indicator where you can see the volume of each price level
plotted as a vertical histogram for each half of a custom period. By default the period is 60 so it plots an independent volume profile each 30m
You can think of each waindrop as an user defined candlestick or bar with four key values:
• high of the period
• low of the period
• left vwap (volume weighted average price of the first half period)
• right vwap (volume weighted average price of the second half period)
The waindrop can have 3 different colors (configurable by the user):
• GREEN: when the right vwap is higher than the left vwap (bullish sentiment )
• RED: when the right vwap is lower than the left vwap (bearish sentiment )
• BLUE: when the right vwap is equal than the left vwap ( neutral sentiment )
KEY FEATURES
• Help menu
• Custom periods
• Central bars
• Left/Right VWAPs
• Custom central bars and vwaps: color and pixels
• Highly configurable volume histogram: execution window, ticks, pixels, color, update frequency and fine tuning the neutral meaning
• Volume labels with custom size and color
• Tracking price dot to be able to see the current price when you hide your default candlesticks or bars
█ SETTINGS
Click here or set any impar period to see the HELP INFO : show the HELP INFO, if it is activated the indicator will not plot
PERIOD SIZE (max 2880 min) : waindrop size in minutes, default 60, max 2880 to allow the first half of a 48H period as a full session volume profile
BARS : show the central and vwap bars, default true
Central bars : show the central bars, default true
VWAP bars : show the left and right vwap bars, default true
Bars pixels : width of the bars in pixels, default 2
Bars color mode : bars color behavior
• BARS : gets the color from the 'Bars color' option on the settings panel
• HISTOGRAM : gets the color from the Bearish/Bullish/Neutral Histogram color options from the settings panel
Bars color : color for the central and vwap bars, default white
HISTOGRAM show the volume histogram, default true
Execution window (x24H) : last 24H periods where the volume funcionality will be plotted, default 5
Ticks per bar (max 50) : width in ticks of each histogram bar, default 2
Updates per period : number of times the histogram will update
• ONE : update at the last bar of the period
• TWO : update at the last bar of each half period
• FOUR : slice the period in 4 quarters and updates at the last bar of each of them
• EACH BAR : updates at the close of each bar
Pixels per bar : width in pixels of each histogram bar, default 4
Neutral Treshold (ticks) : delta in ticks between left and right vwaps to identify a waindrop as neutral, default 0
Bearish Histogram color : histogram color when right vwap is lower than left vwap, default red
Bullish Histogram color : histogram color when right vwap is higher than left vwap, default green
Neutral Histogram color : histogram color when the delta between right and left vwaps is equal or lower than the Neutral treshold, default blue
VOLUME LABELS : show volume labels
Volume labels color : color for the volume labels, default white
Volume Labels size : text size for the volume labels, choose between AUTO, TINY, SMALL, NORMAL or LARGE, default TINY
TRACK PRICE : show a yellow ball tracking the last price, default true
█ LIMITS
This indicator only works on intraday charts (minutes only) up to 12H (720m), the lower chart timeframe you can use is 1m
This indicator needs price, time and volume to work, it will not work on an index (there is no volume), the execution will not be allowed
The histogram (volume profile) can be plotted on 24H sessions as limit but you can plot several 24H sessions
█ ERRORS AND PERFORMANCE
Depending on the choosed settings, the script performance will be highly affected and it will experience errors
Two of the more common errors it can throw are:
• Calculation takes too long to execute
• Loop takes too long
The indicator performance is highly related to the underlying volatility (tick wise), the script takes each candlestick or bar and for each tick in it stores the price and volume, if the ticker in your chart has thousands and thousands of ticks per bar the indicator will throw an error for sure, it can not calculate in time such amount of ticks.
What all of that means? Simply put, this will throw error on the BITCOIN pair BTCUSD (high volatility with tick size 0.01) because it has too many ticks per bar, but lucky you it will work just fine on the futures contract BTC1! (tick size 5) because it has a lot less ticks per bar
There are some options you can fine tune to boost the script performance, the more demanding option in terms of resources consumption is Updates per period , by default is maxed out so lowering this setting will improve the performance in a high way.
If you wanna know more about how to improve the script performance, read the HELP INFO accessible from the settings panel
█ HOW-TO SETUP
The basic parameters to adjust are Period size , Ticks per bar and Pixels per bar
• Period size is the main setting, defines the waindrop size, to get a better looking histogram set bigger period and smaller chart timeframe
• Ticks per bar is the tricky one, adjust it differently for each underlying (ticker) volatility wise, for some you will need a low value, for others a high one.
To get a more accurate histogram set it as lower as you can (min value is 1)
• Pixels per bar allows you to adjust the width of each histogram bar, with it you can adjust the blank space between them or allow overlaping
You must play with these three parameters until you obtain the desired histogram: smoother, sharper, etc...
These are some of the different kind of charts you can setup thru the settings:
• Balanced Waindrops (default): charts with waindrops where the two halfs are of same size.
This is the default chart, just select a period (30m, 60m, 120m, 240m, pick your poison), adjust the histogram ticks and pixels and watch
• Unbalanced Waindrops: chart with waindrops where the two halfs are of different sizes.
Do you trade futures and want to plot a waindrop with the first half for the overnight session and the second half for the cash session? you got it;
just adjust the period to 1860 for any CME ticker (like ES1! for example) adjust the histogram ticks and pixels and watch
• Full Session Volume Profile: chart with waindrops where only the first half plots.
Do you use Volume profile to analize the market? Lucky you, now you can trick this one to plot it, just try a period of 780 on SPY, 2760 on ES1!, or 2880 on EURUSD
remember to adjust the histogram ticks and pixels for each underlying
• Only Bars: charts with only central and vwap bars plotted, simply deactivate the histogram and volume labels
• Only Histogram: charts with only the histogram plotted (volume profile charts), simply deactivate the bars and volume labels
• Only Volume: charts with only the raw volume numbers plotted, simply deactivate the bars and histogram
If you wanna know more about custom full session periods for different asset classes, read the HELP INFO accessible from the settings panel
EXAMPLES
Full Session Volume Profile on MES 5m chart:
Full Session Unbalanced Waindrop on MNQ 2m chart (left side Overnight session, right side Cash Session):
The following examples will have the exact same charts but on four different tickers representing a futures contract, a forex pair, an etf and a stock.
We are doing this to be able to see the different parameters we need for plotting the same kind of chart on different assets
The chart composition is as follows:
• Left side: Volume Labels chart (period 10)
• Upper Right side: Waindrops (period 60)
• Lower Right side: Full Session Volume Profile
The first example will specify the main parameters, the rest of the charts will have only the differences
MES :
• Left: Period size: 10, Bars: uncheck, Histogram: uncheck, Execution window: 1, Ticks per bar: 2, Updates per period: EACH BAR,
Pixels per bar: 4, Volume labels: check, Track price: check
• Upper Right: Period size: 60, Bars: check, Bars color mode: HISTOGRAM, Histogram: check, Execution window: 2, Ticks per bar: 2,
Updates per period: EACH BAR, Pixels per bar: 4, Volume labels: uncheck, Track price: check
• Lower Right: Period size: 2760, Bars: uncheck, Histogram: check, Execution window: 1, Ticks per bar: 1, Updates per period: EACH BAR,
Pixels per bar: 2, Volume labels: uncheck, Track price: check
EURUSD :
• Upper Right: Ticks per bar: 10
• Lower Right: Period size: 2880, Ticks per bar: 1, Pixels per bar: 1
SPY :
• Left: Ticks per bar: 3
• Upper Right: Ticks per bar: 5, Pixels per bar: 3
• Lower Right: Period size: 780, Ticks per bar: 2, Pixels per bar: 2
AAPL :
• Left: Ticks per bar: 2
• Upper Right: Ticks per bar: 6, Pixels per bar: 3
• Lower Right: Period size: 780, Ticks per bar: 1, Pixels per bar: 2
█ THANKS TO
PineCoders for all they do, all the tools and help they provide and their involvement in making a better community
scarf for the idea of coding a waindrops like indicator, I did not know something like that existed at all
All the Pine Coders, Pine Pros and Pine Wizards, people who share their work and knowledge for the sake of it and helping others, I'm very grateful indeed
I'm learning at each step of the way from you all, thanks for this awesome community;
Opensource and shared knowledge: this is the way! (said with canned voice from inside my helmet :D)
█ NOTE
This description was formatted following THIS guidelines
═════════════════════════════════════════════════════════════════════════
I sincerely hope you enjoy reading and using this work as much as I enjoyed developing it :D
GOOD LUCK AND HAPPY TRADING!

Follow the Trend - Trade PullbacksKindly follow the rules stated below for entry, exit and stop loss. Not every Buy / Sell signal will be profitable.
Timeframe of the chart acts as current timeframe. You need to choose 2 more as middle and higher timeframes.
This indicator is based on candlesticks, ATR and CCI indicators and the logic provides buy / sell signals at the pullbacks of the trend depicted by higher timeframe, that must be respected throughout.
Enter the long / short trade respectively when the indicator gives buy / sell signal after price has gone below the green / above the red line for higher timeframe.
Stop loss shall be low / high of recent swing. Exit when the price closes below / above the middle timeframe, to be used as trailing target.
Use it for any instrument for any timeframe of your choice.
For example, check the shared chart. It is a 1 min intraday, but the indicator can be used for short or long term positional trades as well.
Enter long at 14102, with stop loss 14077. Trailing target is achieved at 14156 giving a Risk:Reward ratio of 1:2.
Another Buy signal is observed around same level and uptrend continues till day end, again for a Risk:Reward ratio of approx. 1:2.
Rules to follow for Long trades -
Enter long position at Buy signal given after price has moved below green line of higher timeframe.
Exit the position when price closes below orange / blue line of middle timeframe.
Stop loss must be at low of recent swing, appearing just before the Buy signal.
Rules to follow for Short trades -
Enter short position at Sell signal given after price has moved above red line of higher timeframe.
Exit the position when price closes above orange / blue line of middle timeframe.
Stop loss must be at high of recent swing, appearing just before the Sell signal.

MrBS:Directional Movement Index [Trend Friend]I started this project with the goal of making a DMI/ADX that was easy to read at a glance. Its since become a little more then just colouring the slopes. The majority of the time, the best returns come from trending markets (THE TREND IS YOUR FRIEND... until the end) and I hope this helps people become good friends with the trends.
----- Features
- A function to change the values used for calculation from real OHLC and Heikin Ashi. This allows us to look at different chart types but see the specific ADX we choose. Originally HA values were used for calculation since it is easier to see trend on HA charts. However when testing it was not as effective as the ADX calculated from the real values on normal charts. So the default function was flipped and real OHLC values are used as default.
- Two ADX plots so we can see two different smoothness's. With a smoothing of 2, a slight slow down in PA can cause a negative slope but the smoother ADX will stay trending unless its a major change. 2nd ADX is slightly transparent.
- There is an EMA of the main ADX that can be used as a exit signal filter. If the ADX starts going down but has not crossed the EMA we would stay in a trade.
- Plots (excluding EMA) are coloured based on positive or negative slopes.
- Fibonacci numbers have been used to create different trend levels, instead of the standard 25, 50, 100.
- Alerts for every useful situation to help save time and not have to manually enter levels or crosses each time.
- In the code there are 8 EMAs and 3 ADXs but it was too much so they have been slashed out, but are fully functional if you choose to activate and use them. To reactivate the 3rd ADX delete slashes on lines 50, 65, 78, 92-95, 165. The slashed out EMAs are much more obvious and easy to reactivate.
Colours:
ADX going up = Green
ADX going down = Red
DMI+ going up = Bright Aqua
DMI+ going down = Turquoise / Dark Aqua
DMI- going up = Bright Purple
DMI- going down = Dark Purple
EMA = White (50% transparent)
If there is anything that would be useful, let me know and I will add it in. I've already got some improvements/changes planned and some of my notes can be found in the code.
There is also a strategy to go with this indicator that will be uploaded very soon.

Long RSIThe RSI is a technical indicator generally used with the general setting being 14 days, and often shorter.
The accepted view is that a level of 70 indicates overbought conditions, and 30 indicates oversold conditions.
A short RSI setting will give signals quite often, and they might sometimes contradict each other.
As a individual investor, perhaps with a background in fundamental analysis, the RSI might be overlooked for other fundamental metrics.
But the idea here is that longer RSI settings can be used for investing.
The problem that arises is how to know when the indicator has reached a level that is either overbought or oversold.
This script solves that by using a specific look back period (selectable, but the standard is 1 year), and plotting the highest/lowest value that the RSI has had for that time period.
The idea is that a buy signal occurs when the indicator is at a 'historic' low, and a sell signal occurs when it at its 'historic' high.
Since you generally want to buy when the indicator is at its low, and has stopped decreasing, the script comes with a function that shows you when yesterdays value reached a historic low, but todays value is higher than yesterday.
This is shown by a color change of the background to green. The same is true, but opposite, for sell signals and then the background turns red.
THIS IS NOT TRADING ADVICE, AND YOU SHOULD ALWAYS DO YOUR OWN RESEARCH
GOOD LUCK AND HAPPY TRADING

CSPDMost Advanced & Accurate CandleStick Pattern Detector
Looking All Over of All Markets for All Important Powerful Reversal | Corrective Patterns (25 type)
Filtering the Results with Optional Features like Oscillator, Bollinger Bands, Volume Confirmation, Prior and Following Candles Confirmation which are Fully Customizable.
With this you can detect:
Hammer | Shooting star
Inverted Hammer | Hanging
Long legged Doji | Dragonfly Doji | Gravestone Doji
Bullish tweezers | Bearish tweezers
Bullish inside bar | Bearish inside bar
Bullish three line strike | Bearish three line strike
Bullish engulfing | Bearish engulfing
Piercing line | Dark cloud cover
Bullish abandoned baby | Bearish abandoned baby
Morning star | Evening star
Three white soldiers | Three black crows
*Bullish kayo | *Bearish kayo
Features:
Prior and Following candles Confirmation
You can set prior and following candle as basic prerequisites for marking candles as pattern to make sure you are at the top or bottom of the trend.
Volume confirmation
You can active volume increasing confirmation for some of pattern with adjustable increase % relative to prior candle | candles.
Oscillator Confirmation
Active oscillator confirmation. Select your approved oscillator from list (Stochastic, RSI, StochRSI, MFI, StochMFI) then enter desired value for marking candles as bullish | bearish pattern.
Bollinger Bands Confirmation
Active BB confirmation. Configure your Bollinger Bands. Now only see the patterns which reached or crossed from Bands. Also you can enable BB clod to have your BB indicator at the same time.
Adjustable Flexibility and Precision
You can set tolerance% for Osc and BB Confirmation - each one separately - for more control.
Self-adaptability
The properties of markets change over time, for example the amplitude of fluctuations and the intensity of movements. The script is designed in such a way that you can examine the price history as a benchmark for changes in market properties to adopt determinants. Also you can control those manually.
Self-regulatory
The user has the ability to change input factors depending on their point of view.
Behind the pattern recognition algorithms, there are relationships and similarities in their appearance that cause them to be influenced by each other. Simultaneously with changing the determining factors of each pattern by you, script automatically adjusts other details in accordance with your changes.
Alerts
You can set for type of pattern or each one of pattern have been detected.
Fully Costumizable
All of these options can be change and adjust.
Note 1.
The patterns are based on extensive study of reference and famous sources and the experience of me and my friends in trading and analysis with price action methods.
Note 2.
Due to the Pine limitations in the number of outputs | plots for each script, our attempt has been made to select the best and most important patterns.
Note 3.
So far, many scripts have been written in this field, but our experience with all of them and even the build in version was not satisfactory, and this was the initial motivation for making the script.
We strive to improve progress and elimination of shortcomings and we will continue to make this better.
Note 4.
Through personal experience and based on the principles of market and candlestick psychology, we discovered a new type of pattern and named it as Kayo.
kayo is a two candle pattern which formed when:
1.We have a pivot point with prior candles as left bars and following candles as right bar. Pivot candle called as second candle.
2.In a bullish kayo, first candle must closed descending and second candle must closed as ascending. For bearish kayo vise versa.
3.In a bullish kayo, second candle's lower wick must be longer then upper wick.
4. A pattern marked as kayo when its conditions do not correspond to any of the other patterns(include the confirmation that user added), ie it has the last naming priority over the other patterns.
Note 5.
When you active confirmation options for patterns like hammer, engulf and etc which they conditions are like kayo in some extent, if they can't pass the confirmation steps, they can be marked as kayo pattern.
Note 6.
If you active volume confirmation for Three white soldiers | Three black crows, the confirmation get passed if the volume of forth or third candle increased as value as entered relative to volume EMA3 of 3 candles.
Note 7.
In a bullish pattern all highs of following candles MUST be higher than prior highs and all lows of following candles MUST be higher than prior lows. For bearish patterns vise versa.
This type of confirmation depends on High and Low NOT close!
Gift to price action lovers!
Support us with your like and comments. let us know your experience, points and idea to make this better together.
