Real Close Overlay for Heiken AshiDescription:
The Real Close on Heiken Ashi indicator solves one of the biggest problems traders face when using Heiken Ashi candles, the fact that the displayed close is not the true market close.
By default, Heiken Ashi modifies the open, high, low, and close values to create smoother-looking candles. This makes them great for identifying trends, but it also means entries and exits can be misleading if you rely only on the chart.
This tool fixes that by overlaying the real closing price (traditional candlestick close) directly onto your Heiken Ashi chart.
How It Works:
- Plots the true closing price of each bar (from standard candles) onto your Heiken Ashi chart.
- Displays a small, unobtrusive marker (black dot by default) so you can instantly see where price actually closed. Not only does it plot the close, but it moves with real price as the candle is forming so price action is not lost.
- Updates in real time with every new bar.
Why It Matters:
- Use Heiken Ashi for trend clarity without losing price accuracy.
- Avoid entering/exiting based on inaccurate Heiken Ashi body closes.
- Improves stop-loss and take-profit placement by showing where price truly ended the candle.
- Essential for scalpers and short-term traders who need precision without losing true price action.
Best Uses:
- Combine with Heiken Ashi for momentum trading.
- Verify breakout confirmations against the real close.
- Use as an execution reference if you trade a HA-based system.
Disclaimer:
This script is for educational purposes only. It is open source and fully accessible. It does not provide financial advice. Always test thoroughly before applying to live markets.
"ha溢价率" için komut dosyalarını ara
Fibs Has Lied 🌟 Fibs Has Lied - Indicator Overview 🌟
Designed for indices like US30, NQ, and SPX, this indicator highlights setups where price interacts with key EMA levels during specific trading sessions (default: 6:30–11:30 AM EST).
🌟 Key Features & Levels 🌟
🔹EMA Crossover Setups
The indicator uses the 100-period and 200-period EMAs to identify bullish and bearish setups:
- Bullish Setup: Triggers when the 100 EMA crosses above the 200 EMA, followed by two consecutive candles opening above the 100 EMA, with the low within a specified point distance (e.g., 20 points for US30).
- Bearish Setup: Triggers when the 100 EMA crosses below the 200 EMA, followed by two consecutive candles opening below the 100 EMA, with the high within the point distance.
- Signals are marked with green (buy) or red (sell) triangles and text, ensuring you don’t miss a setup. 📈
🔹 Reset Conditions for Re-Entries
After an initial setup, the indicator watches for “reset” opportunities:
- Buy Reset: If price moves below the 200 EMA after a bullish crossover, then returns with two consecutive candles where lows are above the 100 EMA (within point distance), a new buy signal is plotted.
- Sell Reset: If price moves above the 200 EMA after a bearish crossover, then returns with two consecutive candles where highs are below the 100 EMA (within point distance), a new sell signal is plotted.
This feature captures additional entries after liquidity grabs or fakeouts, aligning with ICT’s manipulation concepts. 🔄
🔹 Session-Based Filtering
Focus your trades during high-liquidity windows! The default session (6:30–11:30 AM EST, New York timezone) targets the London/NY overlap, where price often seeks liquidity or sets up for reversals. Toggle the time filter off for 24/7 signals if desired. 🕒
🔹Symbol-Specific Point Distance
Customizable entry zones based on your chosen index:
- US30: 20 points from the 100 EMA.
- NQ: 3 points from the 100 EMA.
- SPX: 2.5 points from the 100 EMA.
This ensures setups are tailored to the volatility of your market, maximizing relevance. 🎯
🔹 Market Structure Markers (Optional)
Visualize swing points with pivot-based labels:
- HH (Higher High): Signals uptrend continuation.
- HL (Higher Low): Indicates potential bullish support.
- LH (Lower High): Suggests weakening uptrend or reversal.
- LL (Lower Low): Points to downtrend continuation.
- Toggle these on/off to keep your chart clean while analyzing trend direction. 📊
🔹 EMA Visualization
Optionally plot the 100 EMA (blue) and 200 EMA (red) to see key levels where price reacts. These act as dynamic support/resistance, perfect for spotting liquidity pools or ICT’s Power of 3 setups. ⚖️
🌟 Customization Options 🌟
- Symbol Selection: Choose US30, NQ, or SPX to adjust point distance for entries.
- Time Filter: Enable/disable the 6:30–11:30 AM EST session to focus on high-liquidity periods.
- EMA Display: Toggle 100/200 EMAs on/off to reduce chart clutter.
- Market Structure: Show/hide HH/HL/LH/LL labels for cleaner analysis.
- Signal Markers: Green (buy) and red (sell) triangles with text are auto-plotted for easy identification.
🌟 Usage Tips 🌟
- Best Timeframes: Use on 3m for intraday scalping and 30m for swing trades.
- Combine with ICT Tools: Pair with order blocks, fair value gaps, or kill zones for stronger setups.
- Focus on Session: The default 6:30–11:30 AM EST session captures London/NY volatility—perfect for liquidity-driven moves.
- Avoid Overcrowding: Disable market structure or EMAs if you only want setup signals.

[3Commas] HA & MAHA & MA
🔷What it does: This tool is designed to test a trend-following strategy using Heikin Ashi candles and moving averages. It enters trades after pullbacks, aiming to let profits run once the risk-to-reward ratio reaches 1:1 while securing the position.
🔷Who is it for: It is ideal for traders looking to compare final results using fixed versus dynamic take profits by adjusting parameters and trade direction—a concept applicable to most trading strategies.
🔷How does it work: We use moving averages to define the market trend, then wait for opposite Heikin Ashi candles to form against it. Once these candles reverse in favor of the trend, we enter the trade, using the last swing created by the pullback as the stop loss. By applying the breakeven ratio, we protect the trade and let it run, using the slower moving average as a trailing stop.
A buy signal is generated when:
The previous candle is bearish (ha_bear ), indicating a pullback.
The fast moving average (ma1) is above the slow moving average (ma2), confirming an uptrend.
The current candle is bullish (ha_bull), showing trend continuation.
The Heikin Ashi close is above the fast moving average (ma1), reinforcing the bullish bias.
The real price close is above the open (close > open), ensuring bullish momentum in actual price data.
The signal is confirmed on the closed candle (barstate.isconfirmed) to avoid premature signals.
dir is undefined (na(dir)), preventing repeated signals in the same direction.
A sell signal is generated when:
The previous candle is bullish (ha_bull ), indicating a temporary upward move before a potential reversal.
The fast moving average (ma1) is below the slow moving average (ma2), confirming a downtrend.
The current candle is bearish (ha_bear), showing trend continuation to the downside.
The Heikin Ashi close is below the fast moving average (ma1), reinforcing bearish pressure.
The real price close is below the open (close < open), confirming bearish momentum in actual price data.
The signal is confirmed after the candle closes (barstate.isconfirmed), avoiding premature entries.
dir is undefined (na(dir)), preventing consecutive signals in the same direction.
In simple terms, this setup looks for trend continuation after a pullback, confirming entries with both Heikin Ashi and real price action, supported by moving average alignment to avoid false signals.
If the price reaches a 1:1 risk-to-reward ratio, the stop will be moved to the entry point. However, if the slow moving average surpasses this level, it will become the new exit point, acting as a trailing stop
🔷Why It’s Unique
Easily visualizes the benefits of using risk-to-reward ratios when trading instead of fixed percentages.
Provides a simple and straightforward approach to trading, embracing the "keep it simple" concept.
Offers clear visualization of DCA Bot entry and exit points based on user preferences.
Includes an option to review the message format before sending signals to bots, with compatibility for multi-pair and futures contract pairs.
🔷 Considerations Before Using the Indicator
⚠️Very important: The indicator must be used on charts with real price data, such as Japanese candlesticks, line charts, etc. Do not use it on Heikin Ashi charts, as this may lead to unrealistic results.
🔸Since this is a trend-following strategy, use it on timeframes above 4 hours, where market noise is reduced and trends are clearer. Also, carefully review the statistics before using it, focusing on pairs that tend to have long periods of well-defined trends.
🔸Disadvantages:
False Signals in Ranges: Consolidating markets can generate unreliable signals.
Lagging Indicator: Being based on moving averages, it may react late to sudden price movements.
🔸Advantages:
Trend Focused: Simplifies the identification of trending markets.
Noise Reduction: Uses Heikin Ashi candles to identify trend continuation after pullbacks.
Broad Applicability: Suitable for forex, crypto, stocks, and commodities.
🔸The strategy provides a systematic way to analyze markets but does not guarantee successful outcomes. Use it as an additional tool rather than relying solely on an automated system.
Trading results depend on various factors, including market conditions, trader discipline, and risk management. Past performance does not ensure future success, so always approach the market cautiously.
🔸Risk Management: Define stop-loss levels, position sizes, and profit targets before entering any trade. Be prepared for potential losses and ensure your approach aligns with your overall trading plan.
🔷 STRATEGY PROPERTIES
Symbol: BINANCE:BTCUSDT (Spot).
Timeframe: 4h.
Test Period: All historical data available.
Initial Capital: 10000 USDT.
Order Size per Trade: 1% of Capital, you can use a higher value e.g. 5%, be cautious that the Max Drawdown does not exceed 10%, as it would indicate a very risky trading approach.
Commission: Binance commission 0.1%, adjust according to the exchange being used, lower numbers will generate unrealistic results. By using low values e.g. 5%, it allows us to adapt over time and check the functioning of the strategy.
Slippage: 5 ticks, for pairs with low liquidity or very large orders, this number should be increased as the order may not be filled at the desired level.
Margin for Long and Short Positions: 100%.
Indicator Settings: Default Configuration.
MA1 Length: 9.
MA2 Length: 18.
MA Calculations: EMA.
Take Profit Ratio: Disable. Ratio 1:4.
Breakeven Ratio: Enable, Ratio 1:1.
Strategy: Long & Short.
🔷 STRATEGY RESULTS
⚠️Remember, past results do not guarantee future performance.
Net Profit: +324.88 USDT (+3.25%).
Max Drawdown: -81.18 USDT (-0.78%).
Total Closed Trades: 672.
Percent Profitable: 35.57%.
Profit Factor: 1.347.
Average Trade: +0.48 USDT (+0.48%).
Average # Bars in Trades: 13.
🔷 HOW TO USE
🔸 Adjust Settings:
The default values—MA1 (9) and MA2 (18) with EMA calculation—generally work well. However, you can increase these values, such as 20 and 40, to better identify stronger trends.
🔸 Choose a Symbol that Typically Trends:
Select an asset that tends to form clear trends. Keep in mind that the Strategy Tester results may show poor performance for certain assets, making them less suitable for sending signals to bots.
🔸 Experiment with Ratios:
Test different take profit and breakeven ratios to compare various scenarios—especially to observe how the strategy performs when only the trade is protected.
🔸This is an example of how protecting the trade works: once the price moves in favor of the position with a 1:1 risk-to-reward ratio, the stop loss is moved to the entry price. If the Slow MA surpasses this level, it will act as a trailing stop, aiming to follow the trend and maximize potential gains.
🔸In contrast, in this example, for the same trade, if we set a take profit at a 1:3 risk-to-reward ratio—which is generally considered a good risk-reward relationship—we can see how a significant portion of the upward move is left on the table.
🔸Results Review:
It is important to check the Max Drawdown. This value should ideally not exceed 10% of your capital. Consider adjusting the trade size to ensure this threshold is not surpassed.
Remember to include the correct values for commission and slippage according to the symbol and exchange where you are conducting the tests. Otherwise, the results will not be realistic.
If you are satisfied with the results, you may consider automating your trades. However, it is strongly recommended to use a small amount of capital or a demo account to test proper execution before committing real funds.
🔸Create alerts to trigger the DCA Bot:
Verify Messages: Ensure the message matches the one specified by the DCA Bot.
Multi-Pair Configuration: For multi-pair setups, enable the option to add the symbol in the correct format.
Signal Settings: Enable whether you want to receive long or short signals (Entry | TP | SL), copy and paste the the messages for the DCA Bots configured.
Alert Setup:
When creating an alert, set the condition to the indicator and choose "alert() function call only.
Enter any desired Alert Name.
Open the Notifications tab, enable Webhook URL, and paste the Webhook URL.
For more details, refer to the section: "How to use TradingView Custom Signals".
Finalize Alerts: Click Create, you're done! Alerts will now be sent automatically in the correct format.
🔷 INDICATOR SETTINGS
MA 1: Fast MA Length
MA 2: Slow MA Length
MA Calc: MA's Calculations (SMA,EMA, RMA,WMA)
TP Ratio: This is the take profit ratio relative to the stop loss, where the trade will be closed in profit.
BE Ratio: This is the breakeven ratio relative to the stop loss, where the stop loss will be updated to breakeven or if the MA2 is greater than this level.
Strategy: Order Type direction in which trades are executed.
Use Custom Test Period: When enabled signals only works in the selected time window. If disabled it will use all historical data available on the chart.
Test Start and End: Once the Custom Test Period is enabled, here you select the start and end date that you want to analyze.
Check Messages: Enable the table to review the messages to be sent to the bot.
Entry | TP | SL: Enable this options to send Buy Entry, Take Profit (TP), and Stop Loss (SL) signals.
Deal Entry and Deal Exit : Copy and paste the message for the deal start signal and close order at Market Price of the DCA Bot. This is the message that will be sent with the alert to the Bot, you must verify that it is the same as the bot so that it can process properly so that it executes and starts the trade.
DCA Bot Multi-Pair: You must activate it if you want to use the signals in a DCA Bot Multi-pair in the text box you must enter (using the correct format) the symbol in which you are creating the alert, you can check the format of each symbol when you create the bot.
👨🏻💻💭 We hope this tool helps enhance your trading. Your feedback is invaluable, so feel free to share any suggestions for improvements or new features you'd like to see implemented.
__
The information and publications within the 3Commas TradingView account are not meant to be and do not constitute financial, investment, trading, or other types of advice or recommendations supplied or endorsed by 3Commas and any of the parties acting on behalf of 3Commas, including its employees, contractors, ambassadors, etc.

RF+ Replay for Heikin AshiRF+ Replay for Heikin Ashi
RF+ Replay for Heikin Ashi generates fully customisable Heikin Ashi candlesticks presented on a standard chart, enabling traders to utilise the Tradingview Replay feature with Heikin Ashi candlesticks when analysing and backtesting HA style strategies.
The features of this indicator include:
- Fully customisable Heikin Ashi Candles, including custom colour options for candle bodies, borders and wicks.
- Optional real-time, real-price close dots painted onto each candlestick.
- A optional set of 2 x Range Filters designed to indicate short term trend identification upon color change, ideal for low timeframe scalping.
- A optional set of 3 x fully customisable Moving Averages.
- An option to enable Heikin Ashi calculated data for the Range Filters and Moving Averages, so they present as they would on a Heikin Ashi non-standard chart type, without having to use an actual Heikin Ashi chart. Enabled by default.
- An optional sessions indicator, to highlight your prefered trading session for the purpose of backtesting.
- An optional watermark featuring customisable text and well as symbol and timeframe information, as seen in the screenshot of this indicator.
Instructions for use:
1) Because this indicator generates candlesticks and presents them onto your chart, you will need to hide the existing candlesticks so you do not see two sets of candles. You can do this by going into your Tradingview chart settings and making the candle bodies, borders and wicks fully transparent. You can then save this as a layout template. You can access your Chart Settings by clicking on the cog icon, or by right clicking on the chart itself and selecting 'Chart Settings' from the list.
2) Ensure you have the standard chart type selected - you do not need to select a Heikin Ashi type chart.
3) You will now be able to analyise and even backtest your Heikin Ashi style strategies including the use of the Tradingview Replay feature found at the top of the chart.
Heikin Ashi means 'average bar' in Japanese, which speaks to the fact that Heikin Ashi candles are calculated differently to standard Japanese candlesticks. The general idea of Heikin Ashi candles is to 'smooth' the appearance of price movement, by the use of averages within their calculation. It is important to understand that the Open and Close values of a Heikin Ashi candlestick do not reflect real Open and Close prices. You can use the real price dots feature to clearly see the real time and real price Close of each candle.
The formula for calculating a Heikin Ashi candlestick is as follows:
High = Maximum of High, Open, or Close (whichever is highest)
Low = Minimum of Low, Open, or Close (whichever is lowest)
Open = Open (previous bar) + Close (previous bar) /2
Close = (Open + High + Low + Close) / 4
If you found this useful, be sure to leave a like, comment and subscribe to show your support.
Until next time.

Heikin Ashi Candle Startegy for Long PositionThis strategy utilize Heikin-Ashi candlestick chart.
Heikin-Ashi technique is a Japanese candlestick-based technical trading tool that uses candlestick charts to represent and visualize market price data.
Heikin-Ashi candle is essentially taking an average of the movement.
There is a tendency with Heikin-Ashi for the candles to stay red during a downtrend and green during an uptrend.
This strategy only apply for long trading position.
The idea is trader will waiting 3 green candles for validation period (confirmation) before entering long position.
Different timeframe will result different result.
Number of validation period can be changed to see different result
This strategy has parameter for take profit percentage, trailing stop and stop loss.
User can set maximum active position to minimize risk and qty order.
This tool is useful for user who wants to backtest Heikin-Ashi trading strategy.
Script will emit alert when long position is opened and closed.
Warning of Backtesting
Backtesting is backward-looking. As the name implies, you are testing how something would have worked if you traded it perfectly in the past.
Past performance does not indicate future performance and you should not assume it does.
Backtesting assumes you never miss-fire, that you get in and out at the exactly perfect moment each time.
Backtesting assumes you have perfect liquidity, and your limit orders fill at a specific, pre-defined price every time (either the open, close, low, high, or some average of these).
Disclaimer
Do your own research and consider fundamental price of asset.
The indicators provided on this script is for educational purposes only.
Author does not offer advisory or brokerage services, nor does it recommend or advise users to buy or sell particular stocks or securities.
Please examined script and give feedback for further improvement.
Script are open to public, everyone see and clone source code or just apply to chart. Please make comment for improvement.

MavilimW Strategy MTF EMA with HA CandlesThis is a strategy adapted initially for Mavilim moving average indicator, based on WMA MA.
It seems to works amazingly on long term markets, like stocks, some futures, some comodities and so on.
In this strategy, I form initially the candle, using EMA values, so I take the EMA of last 50 closes, open, highs and lows and form the candle
After this I take interally HA and convert the EMA candle to HA.
Then using the moving averages on multiple timeframes, like in this example we have a chart on 4h, but I use 1h and 1d moving averages.
For long condition we have : close is above moving average timeframe1 and oving average timeframe2 and oving average timeframe3
Initially short would be close below ma timeframe1, ma timeframe2 and timeframe3 -> but here I also convert it into a long signal.
So we actually go only long .
And we have 2 different exits : for first long if we have a crossdown of 1h ma with 1 day ma, and for second long if we have a cross up of 1h ma with 1 day ma in this example.
Message me if you have any questions about this strategy.

Impulse Guage Indicator for HA CandlesThis script uses Heikin Ashi candles to smooth out the candles, then counts how many consecutive candles in a row are the same colour (red or green). It then takes each count and multiples it by the difference between close and open, to provide a weighted movement.
Where larger moves create greater impulses.

TD - HA Trend ReversalVery script to identify Doji's for trend reversal and alerting. I intentionally left out identification of other candle types to make it simple for people who are using HA candles in particular.
LongSetups with Entry Signals and Trailing Stop(HA)High probable Long Setups for any time frame and asset.
75+ win rate
Trailing stop always used as exit point
To trade only with the trand - enable MAs in the Inputs tab
x - means Entry signal is active and waiting for long validation
B - on a closed bar is entry signal for long
C - on a developing bar is exit long signal
Green line - long validation line. must close above to go long
Pink line - trailing stop
On Long Entry alert - use Once Per Bar Close option.
On Long Exit alert (Trailing stop triggered) - use Once Per Bar option to trigger sooner and protect your capital.
Always do your own analysis and make trades on your own risk. Find a confluence point where everything aligns and make your own decision. Don't enter a trade because the indicator tells you so. You are free to make a copy of the script and change it to your own needs for your own personal use.
EMA_Cross_Trading_JHVer3.0
- EMA14 and EMA50 Cross detection
- HA 1st profit taking
- Overshoot detection
- Candle shape and Wick analysis

HA Reversal + Doji 🔥 Heikin Ashi Reversal + Stochastic Filter (Precision Entry System)
This indicator is designed to detect high–quality reversal entries using a Heikin Ashi candle pattern (Doji + 2 no–wick confirmation) combined with a strict Stochastic filter that uses memory of extreme touches to control trade direction.
✅ Entry Logic
🔹 Bullish BUY Signal
A BUY is triggered only when:
A valid reversal pattern is detected:
Doji candle (pivot) 3 bars back
Followed by 2 bullish candles with no lower wicks
Stochastic touched Oversold (≤ 20) at least once before the signal
Pattern + Stoch alignment = BUY
🔹 Bearish SELL Signal
A SELL is triggered only when:
Valid bearish reversal pattern:
Doji candle (pivot) 3 bars back
Followed by 2 bearish candles with no upper wicks
Stochastic touched Overbought (≥ 80) before the signal
Pattern + Stoch alignment = SELL
🧠 Stochastic “Memory” Filter
This is not a basic OB/OS filter — it uses event memory:
If Stochastic touches Oversold, the system becomes ready for BUY
If it touches Overbought, it becomes ready for SELL
Both directions can be armed at once
Once a BUY or SELL actually triggers, memory resets to neutral
Prevents “signal spam” during chop and keeps direction meaningful
🎯 Why This Works
✔ Filters out random countertrend noise
✔ Only trades after momentum exhaustion
✔ Uses strict Heikin Ashi reversal structure
✔ Works great across crypto, forex, indices, metals
✔ Designed for precision entries and swing continuation traps
⚙️ Customizable Options
Doji detection mode (body % / ticks / hybrid)
Wick tolerance
Heikin Ashi source (chart or calculated)
Stochastic source (raw or smoothed)
Option to avoid duplicate same-direction signals
Visual aids: pattern markers, blocked signals, doji debugging
📌 Best Use Cases
Reversal scalping on 5m/15m
Swing entries on 1H/4H
Trend exhaustion confirmation
Smart Money Concepts entry refinement
Entry timing after liquidity sweeps
🚨 Important
This is not a repainting system. Signals are generated at bar close only. Always combine with proper risk management and market context.
Let me know if you want:
✅ A shorter description
✅ An SEO optimized TradingView title
✅ A strategy version with backtesting
✅ Alerts version for automation

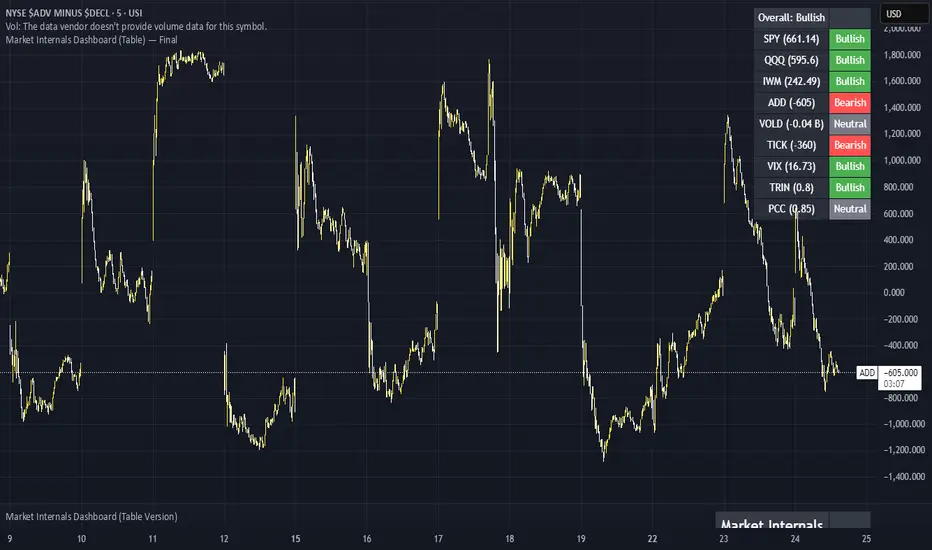
Market Internals Dashboard (Table) v5 - FixedHas a Dashboard for Market Internals and 3 Indices, very helpful
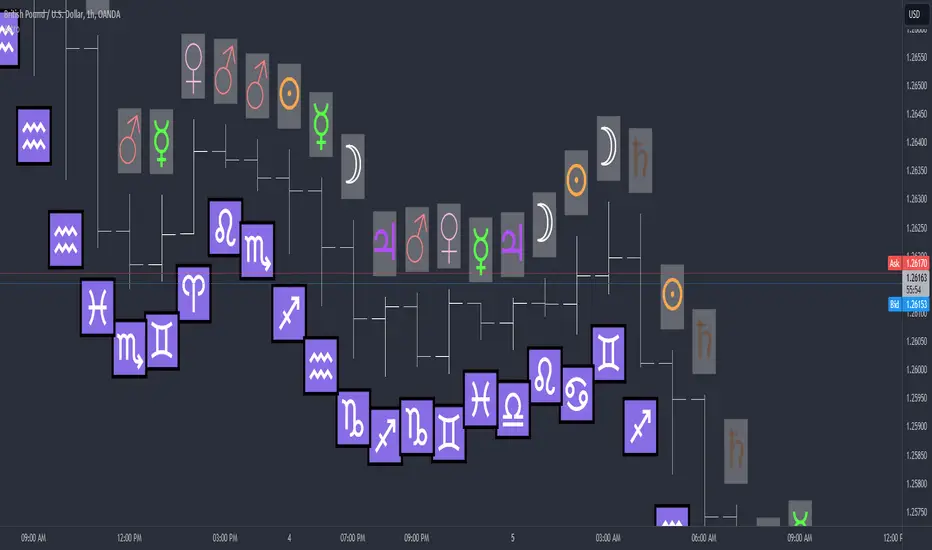
Astro-CandlesThis script is just for fun.
It generates a Planet and a Zodiac Sign at the close of each candle.
The candle is "sliced" into 7 sections, one for each Planet and the close lands in one of those sections.
The candle is "sliced" into 12 sections, one for each Zodiac and the open lands in one of those sections.
You could use it to generate a quick "answer" to a question.
You could use to contemplate your day if you use the daily candle.
You could even try to use it to trade and make some money, somehow.
Every combination should be possible, Moon in Aries, Mars in Capricorn, whatever.
Since it's based on candle structure, it might yield some interesting information.
Or not!
Enjoy!
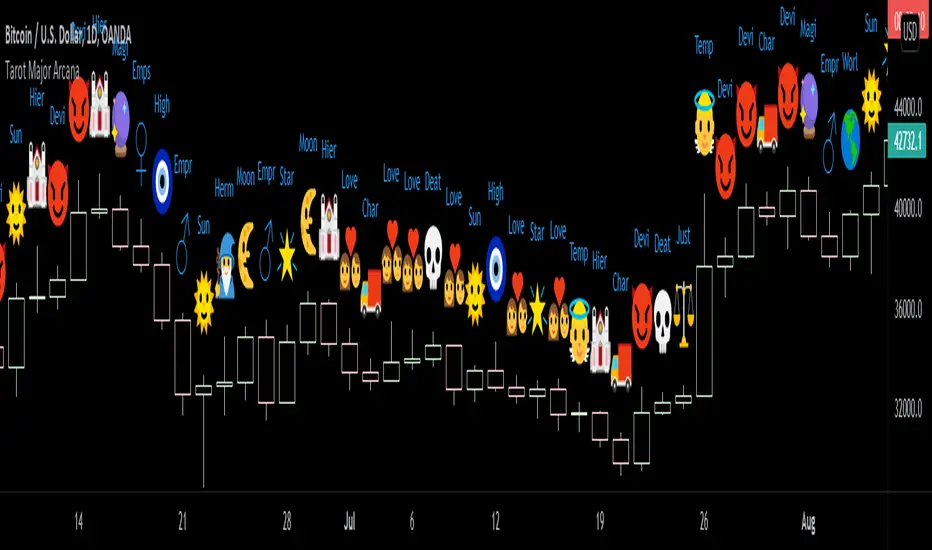
Tarot : Major ArcanaThis script generates a Major Arcana Tarot card for each candle at its close.
The candle is divided into 22 sections, each section corresponding to one of the Major Arcana.
When a candle closes, it closes in one of those 22 sections and that generates the card.
You could read green candles as upright and red candles as reversals.
Uses
----
Use this to pull a daily card on your chart.
Ask a question on the one-minute chart before the candle closes and wait for your answer.
Use it to forecast the upcoming market.
Anything else!
Enjoy.
Effective RSI with PivotsHas Different Levels of RSI along with Pivot Points High Low marked on the RSI Pane to identify Swings,M,W Patterns.

HA,Renko, Linebreak,Kagi and Average all Charts Layouts in One This is an educational study, using the security functions provided by @PineCoders(big thanks to them for creating this ) in order to see the difference between multiple candle close plots using:
Heikin Ashi
Renko
Linebreak
Kagi
Average of them all.
Both the different securities and the average can be used as a source for different indicators like moving averages or oscillators getting with them some new and unique opportunities.
If you have any questions, let me know !

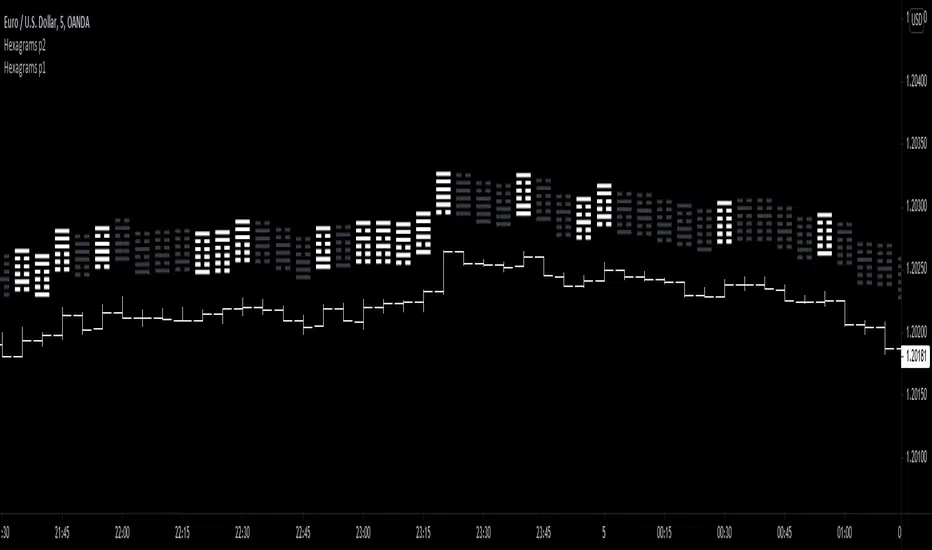
I Ching Hexagrams Part 2IMPORTANT!
Get the other indicator I Ching Hexagrams Part 1 for the full set!
Here is the first half of the I Ching's hexagrams.
Each candle generates a hexagram at close, based on that candle and the previous 5.
A green candle is yang and a red candle is yin.
In this way, price action generates a hexagram.
Use this to generate a hexagram for the day or even to find interesting patterns to trade.
Have fun!
I Ching Hexagrams Part 1IMPORTANT!
Get the other indicator I Ching Hexagrams Part 2 for the full set!
Here is the first half of the I Ching's hexagrams.
Each candle generates a hexagram at close, based on that candle and the previous 5.
A green candle is yang and a red candle is yin.
In this way, price action generates a hexagram.
Use this to generate a hexagram for the day or even to find interesting patterns to trade.
Have fun!

Trigram (I Ching)This script generates a Trigram for the current candle at its close.
The idea is simple. It takes the current candle close and the two previous to generate the lines of the Trigram.
In traditional I Ching practices, these are built bottom up. So in this case, the Candle in 2 bars back is the base, 1 bar back is the central line and the current close is the top.
Up candles are yang lines, down candles yin.
Anyways, not sure what use it is yet, but if there is anyone else out there interested in I Ching, Yin/Yang theory and trading, this is for you.

HA StudyShows trends based on 1W and 3D heikin ahsi candles and moving averages crossing next possible close prediction on 1W and 3D heiking ashi candles


HA Candles MTFJust try to make non repainting MTF candles
cross over of open and close , seen by small triangles