USDJPY Fair Value Gap + Session Strategy🎯 Overview
This strategy combines Fair Value Gaps (FVGs) with session-based order flow analysis, specifically optimized for USDJPY. It identifies price inefficiencies left behind by institutional order flow during high-volatility trading sessions, offering a modern alternative to traditional lagging indicators.
🔬 What Are Fair Value Gaps?
Fair Value Gaps represent areas where aggressive institutional buying or selling created "gaps" in the market structure:
Bullish FVG: Price moves up so aggressively that it leaves unfilled buy orders behind
Bearish FVG: Price moves down so quickly that it leaves unfilled sell orders behind
Research shows approximately 80% of FVGs get "filled" (price returns to the gap) within 20-60 bars, making them highly predictable trading zones.
(see the generated image above)
(see the generated image above)
FVG Detection Logic:
text
// Bullish FVG: Gap between high and current low
bullishFVG = low > high and high > high
// Bearish FVG: Gap between low and current high
bearishFVG = high < low and low < low
🌏 Session-Based Trading
Why Sessions Matter for USDJPY
(see the generated image above)
Tokyo Session (00:00-09:00 UTC)
Highest volatility during first hour (00:00-01:00 UTC)
Average movement: 51-60 pips
Best for breakout strategies
London/NY Overlap (13:00-16:00 UTC)
Maximum liquidity and institutional participation
Tightest spreads and most reliable FVG formations
Optimal for continuation trades
Monday Premium Effect
USDJPY moves 120+ pips on Mondays due to weekend positioning
Enhanced FVG formation during session opens
📊 Strategy Components
(see the generated image above)
1. Fair Value Gap Detection
Identifies bullish and bearish FVGs automatically
Age limit: FVGs expire after 20 bars to avoid stale setups
Size filter: Minimum gap size to filter out noise
2. Session Filtering
Tokyo Open focus: Trades during first hour of Asian session
London/NY Overlap: Captures high-liquidity institutional flows
Weekend gap strategy: Enhanced signals on Monday opens
3. Volume Confirmation
Requires 1.5x average volume spike
Confirms institutional participation
Reduces false signals
4. Trend Alignment
50 EMA filter ensures trades align with higher timeframe trend
Long trades above EMA, short trades below
Prevents costly counter-trend trades
5. Risk Management
2:1 Risk/Reward minimum ensures profitability with 40%+ win rate
Percentage-based stops adapt to USDJPY volatility (0.3% default)
Configurable position sizing
🎯 Entry Conditions
(see the generated image above)
Long Entry (BUY)
✅ Bullish FVG detected in previous bars
✅ Price returns to FVG zone during active trading session
✅ Volume spike above 1.5x average
✅ Price above 50 EMA (trend confirmation)
✅ Bullish candle closes within FVG zone
✅ Trading during Tokyo open OR London/NY overlap
Short Entry (SELL)
✅ Bearish FVG detected in previous bars
✅ Price returns to FVG zone during active trading session
✅ Volume spike above 1.5x average
✅ Price below 50 EMA (trend confirmation)
✅ Bearish candle closes within FVG zone
✅ Trading during Tokyo open OR London/NY overlap
📈 Expected Performance
Backtesting Results (Based on Similar Strategies):
Win Rate: 44-59% (profitable due to high R:R ratio)
Average Winner: 60-90 pips during London/NY sessions
Average Loser: 30-40 pips (tight stops at FVG boundaries)
Risk/Reward: 2:1 minimum, often 3:1 during strong trends
Best Performance: Monday Tokyo opens and Wednesday London/NY overlaps
Why This Works for USDJPY:
90% correlation with US-Japan bond yield spreads
High volatility provides sufficient pip movement
Heavy institutional/central bank participation creates clear FVGs
Consistent volatility patterns across trading sessions
⚙️ Configurable Parameters
Session Settings:
Trade Tokyo Session (Enable/Disable)
Trade London/NY Overlap (Enable/Disable)
FVG Settings:
FVG Minimum Size (Filter small gaps)
Maximum FVG Age (20 bars default)
Show FVG Markers (Visual display)
Volume Settings:
Use Volume Filter (Enable/Disable)
Volume Multiplier (1.5x default)
Volume Average Period (20 bars)
Trend Settings:
Use Trend Filter (Enable/Disable)
Trend EMA Period (50 default)
Risk Management:
Risk/Reward Ratio (2.0 default)
Stop Loss Percentage (0.3% default)
🎨 Visual Indicators
🟡 Yellow Line: 50 EMA trend filter
🟢 Green Triangles: Long entry signals
🔴 Red Triangles: Short entry signals
🟢 Green Dots: Bullish FVG zones
🔴 Red Dots: Bearish FVG zones
🟦 Blue Background: Tokyo open session
🟧 Orange Background: London/NY overlap
📊 Recommended Settings
Optimal Timeframes:
Primary: 5-minute charts (scalping)
Secondary: 15-minute charts (swing trading)
Parameter Optimization:
Conservative: Stop Loss 0.2%, R:R 2:1, Volume 2.0x
Balanced: Stop Loss 0.3%, R:R 2:1, Volume 1.5x (default)
Aggressive: Stop Loss 0.4%, R:R 1.5:1, Volume 1.2x
Risk Management:
Maximum 1-2% of account per trade
Daily loss limit: Stop after 3-5 consecutive losses
Use fixed percentage position sizing
⚠️ Important Considerations
Avoid Trading During:
Major news events (BOJ interventions, NFP, FOMC)
Holiday periods with reduced liquidity
Low volatility Asian afternoon sessions
When US-Japan yield differential narrows sharply
Best Practices:
Limit to 2-3 trades per session maximum
Always respect the 50 EMA trend filter
Never risk more than planned per trade
Paper trade for 2-4 weeks before live implementation
Track performance by session and day of week
🚀 How to Use
Add the script to your USDJPY chart
Set timeframe to 5-minute or 15-minute
Adjust parameters based on your risk tolerance
Enable strategy alerts for automated notifications
Wait for visual signals (triangles) to appear
Enter trades according to your risk management rules
📚 Strategy Foundation
This strategy is based on:
Smart Money Concepts (SMC): Institutional order flow tracking
Market Microstructure: Understanding how FVGs form in electronic trading
Quantified Risk Management: Statistical edge through proper R:R ratios
Session Liquidity Patterns: Exploiting predictable volatility cycles
"gaps" için komut dosyalarını ara

FVG Zones with Signals█ OVERVIEW
"FVG Zones with Signals" is a technical analysis tool that identifies Fair Value Gaps (FVG) on the chart and draws customizable zones in the form of boxes. It is ideal for traders using price action and market structure strategies, helping to identify potential imbalance zones and trading opportunities based on breakout and exit signals. With flexible size filter settings, box styles, and signal options, the indicator ensures clarity and precision on the chart.
█ CONCEPTS
The indicator is designed to identify potential entry points for trades based on FVG breakouts or retests. For chart clarity, a size filter for FVGs is included, based on a multiplier of the average candle size over a specified period.
Why are FVGs important? FVG zones represent areas of market imbalance, often attracting price back to "fill" the gap. Larger gaps (with a higher size multiplier) have a greater chance of being retested, as they indicate deeper imbalances—leaving more unexecuted orders in those zones, which attracts liquidity. Market makers and institutions often return to these levels to "refresh" liquidity before further moves. However, not every large FVG is retested quickly—in strong trends, smaller imbalances may be ignored, and the location (e.g., near swing highs/lows) is critical for retest probability.
█ FEATURES
- FVG Detection: Identifies bullish and bearish FVGs based on size filters (Candle Size Period and FVG Size Multiplier), with automatic initialization of historical gaps up to 500 candles back.
- Customizable Boxes: Draws FVG boxes with adjustable border colors, background gradients, border styles (solid, dashed, dotted), border widths, and transparency for both the background and the 50% FVG midline.
- Breakout and Exit Signals: Generates "Break" signals (green upward triangle for breakouts above bearish FVG, red downward triangle for breakouts below bullish FVG) and "Exit" signals (circles for exiting the zone), with options to select signal types (Break, Exit, or Both). A break signal causes the box to disappear, leaving a triangle as a trace of the breakout, which may serve as a signal to open a position. Exit signals (circles) may also indicate entry opportunities but require additional confirmation, such as alignment with the main trend.
- Midline: Automatically draws a dashed line at the 50% FVG level with adjustable transparency, aiding in assessing price reactions within the zone.
- Box Limitation: Automatically removes old or inactive FVGs after 500 candles to avoid chart clutter.
- Alerts: Built-in alerts for all signal types, including price and FVG type descriptions.
█ HOW TO USE
Add to Chart: Apply the indicator to your TradingView chart via the Pine Editor or Indicators menu.
Configure Settings:
- FVG Settings: Adjust Candle Size Period (default 20) and FVG Size Multiplier (default 1) to filter out small gaps—higher values generate fewer but more significant FVGs.
- Box Settings: Configure colors and styles for bullish (green) and bearish (red) boxes, including background transparency (default 80) and midline transparency.
- Signal Settings: Select signal types (Break, Exit, or Both) in Signal Type. Breakout signals appear after a candle closes outside the zone, while exit signals appear when exiting an FVG without a full breakout.
- Styling: Customize signal colors (green for buy/up, red for sell/down) and shape sizes.
Interpreting Signals:
- Break Up Signal: A green triangle below the bar indicates a breakout above a bearish FVG, suggesting potential continuation of an uptrend.
- Break Down Signal: A red triangle above the bar indicates a breakout below a bullish FVG, suggesting potential continuation of a downtrend.
- Exit Up/Down Signal: A green/red circle indicates an exit from an FVG without a full breakout, which may signal the end of a correction or preparation for a reversal.
- FVG Zones: If the price returns to an FVG and fills the gap, it may indicate equilibrium; an unfilled gap often leads to a retest.
- Use signals in conjunction with other technical analysis tools for confirmation, such as RSI (to identify overbought/oversold conditions) or MACD (to confirm momentum). Analyze FVGs from higher timeframes—these zones act as stronger imbalance levels and carry greater structural significance.
Exit signals (retests without breakouts) tend to be most effective when traded in line with the current trend.
█ APPLICATIONS
- Price Action Trading: Use FVG zones as dynamic support and resistance levels. In an uptrend, look for buying opportunities in bullish FVGs, where price often tests the gap before continuing. Combining with RSI, MACD, or Fibonacci levels enhances the significance of zones.
- Breakout Strategies: Trade based on breakout signals from FVGs. A buy signal after breaking a bearish FVG may indicate a strong upward impulse, especially when supported by a rising MACD or RSI exiting oversold conditions.
Larger FVG gaps (higher multiplier) have a greater chance of retest, as they indicate deeper imbalances.
█ NOTES
- Test the indicator across different timeframes and markets (stocks, forex, crypto) to optimize size filters for your trading style.
- The indicator initializes historical FVGs up to 500 candles back, which may slow loading on longer charts.
- For best results, use on high-liquidity markets where FVGs are more frequently retested.
- In consolidation zones, the indicator may generate more false signals, so additional confirmation is recommended.

Multi-TF 👀### Multi-Timeframe Analysis (MTF-Analysis)
**Overview**
The Multi-Timeframe Analysis indicator is a powerful visualization tool designed for traders who incorporate multi-timeframe (MTF) strategies into their decision-making process. It overlays compact, customizable candle representations from up to four higher timeframes directly on your chart, positioned to the right of the last bar for quick reference. This allows you to monitor price action, momentum via EMAs, and key levels like Fair Value Gaps (FVGs) across multiple resolutions without switching charts. Built with efficiency in mind, it supports automatic timeframe detection, real-time updates, and a clean, non-intrusive design that enhances your trading workflow.
Ideal for day traders, swing traders, and scalpers, this indicator helps identify alignments between timeframes, spot potential reversals or continuations, and validate entries/exits based on higher-timeframe context. It leverages Pine Script v6 for smooth performance, with optimizations to handle up to 5000 bars back and extensive drawing limits.
**Key Features**
- **Multi-Timeframe Candle Display**: Renders recent candles (configurable from 5 to 100 per timeframe) from selected higher timeframes (e.g., 5m, 15m, 1H, 4H) as compact bars with customizable width, spacing, and padding. Bullish and bearish candles are color-coded for instant recognition.
- **Automatic Timeframe Adaptation**: When enabled, the indicator intelligently selects complementary timeframes based on your chart's resolution (e.g., on a 1m chart, it might show 5m, 15m, and 1H). Manual overrides are available for full control.
- **EMA Overlays**: Plots EMA9, EMA21, and EMA50 on each MTF section using a user-defined source (e.g., OHLC/4, close). EMAs can be dashed for clarity and enabled/disabled per timeframe, helping to gauge momentum and trend strength.
- **Fair Value Gaps (FVGs)**: Detects bullish (+FVG) and bearish (-FVG) gaps with a configurable lookback length (5-50 bars). Gaps are visualized as dotted boxes extending from the candle, highlighting potential support/resistance zones or imbalances.
- **Time Labels and Debugging**: Displays timestamp labels under every fourth candle for chronological context. A debug mode expands spacing and adds detailed labels (e.g., OHLC, volume, EMA values) for testing and verification.
- **Customization Options**: Extensive inputs for colors (bodies, wicks, EMAs, FVGs), label sizes/styles, and layout ensure seamless integration with your chart theme. Supports futures symbols with a time offset adjustment.
- **Performance Optimizations**: Uses arrays for efficient data management, clears drawings on realtime updates or timeframe changes, and limits buffer sizes to prevent overload.
**How to Use**
1. Add the indicator to your chart via TradingView's "Indicators" menu.
2. Configure timeframes: Enable/disable up to four TFs and set the number of candles to display. Use "Auto Timeframe" for smart defaults.
3. Adjust EMAs: Select the source type and toggle per TF to focus on relevant momentum signals (e.g., EMA9 crossovers for short-term trades).
4. Enable FVGs: Activate per TF and tweak the length to suit your market (shorter for volatile assets, longer for trends).
5. Fine-tune appearance: Modify padding, candle width, and colors to avoid clutter. Use debug mode during setup.
6. Interpret: Align your chart's price action with MTF candles—look for confluence in trends, FVGs filling as support/resistance, or EMA alignments for high-probability setups.
**Input Settings**
- **General**: Hour offset for time adjustments (useful for futures).
- **Timeframes**: Enable TFs 1-4, select resolutions (e.g., "5m"), and set candle counts. Auto mode simplifies this.
- **FVG/iFVG**: Toggle per TF, customize colors and detection length.
- **EMA**: Enable per TF, choose source, colors, and dashed style.
- **Candle Appearance**: Bull/bear colors for bodies/wicks, width/spacing/padding, label size/color.
- **Debug**: Expands view for detailed inspection.
**Notes**
- This indicator is non-repainting and updates in realtime, but performance may vary on lower timeframes with many candles—reduce counts if needed.
- FVGs are calculated locally on recent bars for efficiency; historical gaps beyond the buffer aren't shown.
- Compatible with all symbols, but best on volatile markets like forex, crypto, or indices.
- Feedback welcome—updates may include more MA types or advanced FVG filters.
Enhance your edge with multi-timeframe insights—try MTF-Analysis today!

Overnight Bias: Net Long/Short with PercentOvernight bias can assist with NY session gap fades or gap and go trading once the NY session is open.
Some general gap rules are:
1. Gap Direction Aligned with Overnight Bias
Rule: If the NY session gaps up and the overnight bias is Net Long (e.g., >60% of bars above the overnight open), favor longs.
Confirmation: Look for price to hold above overnight open or VWAP.
Invalidation: If price re-enters the overnight range, reassess.
2. Gap Opposing Overnight Bias (Contrarian Setup)
Rule: If the NY opens opposite the overnight bias, expect potential gap fill or reversal.
Trade Bias: Look for retracement back toward the overnight open or VWAP.
Example: Overnight was Net Long, but NY gaps down → wait for reclaim of VWAP to go long, else fade strength.
3. Gap Into Prior Day Value Area (VAH to VAL)
Rule: If the NY session gaps into the prior day value area:
It implies mean reversion behavior.
Expect price to rotate toward the POC (point of control).
Trade Bias: Fade toward POC if overnight bias is balanced or opposite the gap direction.
4. Gap Outside Prior Day Value Area
Rule: A gap above VAH or below VAL suggests potential breakout or new trend day.
Trade Bias: If overnight bias aligns (e.g., gap above VAH + Net Long overnight), consider trend continuation.
Invalidation: If price breaks back inside the prior day value area, watch for failed breakout → fade trade possible.
5. Gap Above Prior Day High / Below Prior Day Low
Rule: This is a true breakout gap.
Above Prior High + Net Long Bias: Look for continuation.
Below Prior Low + Net Short Bias: Look for sell pressure continuation.
Trade Bias: Use pullbacks to the prior high/low or overnight open for continuation setups.
6. Gap Within Prior Day Range
Rule: If the NY open is within the prior day’s high and low, expect chop or balanced conditions.
Trade Bias: Use overnight VWAP and prior POC as decision zones. Be cautious unless a breakout occurs.
7. Failed Gap and Re-entry into Prior Day Range
Rule: If price gaps above prior high but re-enters the prior range, it's a failed breakout.
Trade Bias: Look for a fade back to VAH or POC.
Confirmation: Watch for breakdown below overnight VWAP or failure to hold overnight open.
8. Gap + Overnight VWAP Divergence
Rule: If price gaps opposite the direction of VWAP (e.g., VWAP rising, gap down), wait for confirmation.
Trade Bias: Be cautious with early trades. Bias may flip if VWAP is reclaimed.
9. Gap + Overnight Open Test
Rule: If price opens with a gap and then retests the overnight open, that level becomes a decision zone.
Trade Bias:
Hold above = trend continuation.
Rejection = gap fill or reversal.
10. Unfilled Gap = Trend Bias
Rule: If the gap remains unfilled for the first 30–60 minutes, it increases the odds of a trend day.
Trade Bias: Trade pullbacks in the direction of the gap and overnight bias.
Should anyone have suggestion to add please do so.

FVG + Swings + ConfigurableOverview
This Pine Script v5 indicator highlights Fair Value Gaps (FVGs), plots swing‑high and swing‑low pivots, and marks single breakouts above the last swing‑high or below the last swing‑low by recoloring the breakout candle. Every aspect—gap size, count limits, colors, and feature toggles—is exposed as an input so you can tailor it to your own workflow.
Key Features
Fair Value Gaps
Detects bullish gaps when the high of bar i-2 is below the low of the current bar.
Detects bearish gaps when the low of bar i-2 is above the high of the current bar.
Draws a semi‑transparent rectangle spanning from bar i-2 to bar i + extension.
Automatically deletes oldest boxes when exceeding the user’s “Max FVG Boxes” limit.
Swing‑High / Swing‑Low Pivots
Identifies a swing‑high when the middle candle of a three‑bar sequence has the highest high.
Identifies a swing‑low when the middle candle has the lowest low.
Marks each pivot with a tiny dot above (high) or below (low) the bar.
Single Breakouts
Tracks the most recent swing‑high and swing‑low levels.
On the first close above the last swing‑high (or below the last swing‑low), recolors that single candle.
Prevents repeated coloring until a new swing pivot forms.
Full Customization
Show/Hide toggles for FVGs, swing pivots, breakouts.
Numeric inputs for FVG extension length and maximum retained boxes.
Color pickers for bullish/bearish gaps, swing pivots, and breakout candles.

SMC+The "SMC+" indicator is a comprehensive tool designed to overlay key Smart Money Concepts (SMC) levels, support/resistance zones, order blocks (OB), fair value gaps (FVG), and trap detection on your TradingView chart. It aims to assist traders in identifying potential areas of interest based on price action, swing structures, and volume dynamics across multiple timeframes. This indicator is fully customizable, allowing users to adjust lookback periods, colors, opacity, and sensitivity to suit their trading style.
Key Components and Functionality
1. Key Levels (Support and Resistance)
This section plots horizontal lines representing support and resistance levels based on highs and lows over three distinct lookback periods, plus daily nearest levels.
Short-Term Lookback Period (Default: 20 bars)
Plots the highest high (short_high) and lowest low (short_low) over the specified period.
Visualized as dotted lines with customizable colors (Short-Term Resistance Color, Short-Term Support Color) and opacity (Short-Term Resistance Opacity, Short-Term Support Opacity).
Adjustment Tip: Increase the lookback (e.g., to 30-50) for less frequent but stronger levels on higher timeframes, or decrease (e.g., to 10-15) for scalping on lower timeframes.
Long-Term Lookback Period (Default: 50 bars)
Plots broader support (long_low) and resistance (long_high) levels using a solid line style.
Customizable via Long-Term Resistance Color, Long-Term Support Color, and their respective opacity settings.
Adjustment Tip: Extend to 100-200 bars for swing trading or major trend analysis on daily/weekly charts.
Extra-Long Lookback Period (Default: 100 bars)
Identifies significant historical highs (extra_long_high) and lows (extra_long_low) with dashed lines.
Configurable with Extra-Long Resistance Color, Extra-Long Support Color, and opacity settings.
Adjustment Tip: Use 200-500 bars for monthly charts to capture macro-level key zones.
Daily Nearest Resistance and Support Levels
Dynamically calculates the nearest resistance (daily_res_level) and support (daily_sup_level) based on the current day’s price action relative to historical highs and lows.
Displayed with Daily Resistance Color and Daily Support Color (with opacity options).
Adjustment Tip: Works best on intraday charts (e.g., 15m, 1h) to track daily pivots; combine with volume profile for confirmation.
How It Works: These levels update dynamically as new highs/lows form, providing a visual guide to potential reversal or breakout zones.
2. SMC Inputs (Smart Money Concepts)
This section identifies swing structures, order blocks, fair value gaps, and entry signals based on SMC principles.
SMC Swing Lookback Period (Default: 12 bars)
Defines the period for detecting swing highs (smc_swing_high) and lows (smc_swing_low).
Adjustment Tip: Increase to 20-30 for smoother swings on higher timeframes; reduce to 5-10 for faster signals on lower timeframes.
Minimum Swing Size (%) (Default: 0.5%)
Filters out minor price movements to focus on significant swings.
Adjustment Tip: Raise to 1-2% for volatile markets (e.g., crypto) to avoid noise; lower to 0.2-0.3% for forex pairs with tight ranges.
Order Block Sensitivity (Default: 1.0)
Scales the size of detected order blocks (OBs) for bullish reversal (smc_ob_bull), bearish reversal (smc_ob_bear), and continuation (smc_cont_ob).
Visuals include customizable colors, opacity, border thickness, and blinking effects (e.g., SMC Bullish Reversal OB Color, SMC Bearish Reversal OB Blink Thickness).
Adjustment Tip: Increase to 1.5-2.0 for wider OBs in choppy markets; keep at 1.0 for precision in trending conditions.
Minimum FVG Size (%) (Default: 0.3%)
Sets the minimum gap size for Fair Value Gaps (fvg_high, fvg_low), displayed as boxes with Fair Value Gap Color and FVG Opacity.
Adjustment Tip: Increase to 0.5-1% for larger, more reliable gaps; decrease to 0.1-0.2% for scalping smaller inefficiencies.
How It Works:
Bullish Reversal OB: Detects a bearish candle followed by a bullish break, marking a potential demand zone.
Bearish Reversal OB: Identifies a bullish candle followed by a bearish break, marking a supply zone.
Continuation OB: Spots strong bullish momentum after a prior high, indicating a continuation zone.
FVG: Highlights bullish gaps where price may retrace to fill.
Entry Signals: Plots triangles (SMC Long Entry) when price retests an OB with a liquidity sweep or break of structure (BOS).
3. Trap Inputs
This section detects potential bull and bear traps based on price action, volume, and key level rejections.
Min Down Move for Bear Trap (%) (Default: 1.0%)
Sets the minimum drop required after a bearish OB to qualify as a trap.
Visualized with Bear Trap Color, Bear Trap Opacity, and blinking borders.
Adjustment Tip: Increase to 2-3% for stronger traps in trending markets; lower to 0.5% for ranging conditions.
Min Up Move for Bull Trap (%) (Default: 1.0%)
Sets the minimum rise required after a bullish OB to flag a trap.
Customizable with Bull Trap Color, Bull Trap Border Thickness, etc.
Adjustment Tip: Adjust similarly to bear traps based on market volatility.
Volume Lookback for Traps (Default: 5 bars)
Compares current volume to a moving average (avg_volume) to filter low-volume traps.
Adjustment Tip: Increase to 10-20 for confirmation on higher timeframes; reduce to 3 for intraday sensitivity.
How It Works:
Bear Trap: Triggers when price drops significantly after a bearish OB but reverses up with low volume or support rejection.
Bull Trap: Activates when price rises after a bullish OB but fails with low volume or resistance rejection.
Boxes highlight trap zones, resetting when price breaks out.
4. Visual Customization
Line Width (Default: 2)
Adjusts thickness of support/resistance lines.
Tip: Increase to 3-4 for visibility on cluttered charts.
Blink On (Default: Close)
Sets whether OB/FVG borders blink based on Open or Close price interaction.
Tip: Use "Open" for intraday precision; "Close" for confirmed reactions.
Colors and Opacity: Each element (OBs, FVGs, traps, key levels) has customizable colors, opacity (0-100), border thickness (1-5 or 1-7), and blink effects for dynamic visualization.
How to Use SMC+
Setup: Apply the indicator to any chart and adjust inputs based on your timeframe and market.
Key Levels: Watch for price reactions at short, long, extra-long, or daily levels for potential reversals or breakouts.
SMC Signals: Look for entry signals (triangles) near OBs or FVGs, confirmed by liquidity sweeps or BOS.
Traps: Avoid false breakouts by monitoring trap boxes, especially near key levels with low volume.
Notes:
This indicator is a visual aid and does not guarantee trading success. Combine it with other analysis tools and risk management strategies.
Performance may vary across markets and timeframes; test settings thoroughly before use.
For optimal results, experiment with lookback periods and sensitivity settings to match your trading style.
The default settings are optimal for 1 minute and 10 second time frames for small cap low float stocks.
Continuation OB are Blue.
Bullish Reversal OB color is Green
Bearish Reversal OB color is Red
FVG color is purple
Bear Trap OB is red with a green border and often appears with a Bearish Reversal OB signaling caution to a short position.
Bull trap OB is green with a Red border signaling caution to a long position.
All active OB area are highlighted and solid in color while other non active OB area are dimmed.
My personal favorite setups are when we have an active bullish reversal with an active FVG along with an active Continuation OB.
Another personal favorite is the Bearish reversal OB signaling an end to a recent uptrend.
The Trap OB detection are also a unique and Original helpful source of information.
The OB have a white boarder by default that are colored black giving a simulated blinking effect when price is acting in that zone.
The Trap OB border are colored with respect to direction of intended trap, all of which can be customized to personal style.
All vaild OB zones are shown compact in size ,a unique and original view until its no longer valid.

Fair Value Gap Finder [Find Better Trades]Fair Value Gap Finder (FVG) – Spot Institutional Imbalances
📈 Identify Key Market Imbalances
The Fair Value Gap Finder automatically detects price inefficiencies where aggressive buying or selling has created an imbalance in liquidity. These gaps, often left by institutional traders, can serve as key areas for price to revisit before continuing its trend.
🔍 How It Works:
Highlights bullish Fair Value Gaps (FVGs) in green, signaling potential support zones.
Highlights bearish Fair Value Gaps (FVGs) in red, signaling potential resistance zones.
Uses ATR-based filtering to eliminate small, insignificant gaps, focusing only on high-probability setups.
Alerts included! Get notified when a valid Fair Value Gap is detected.
📊 How to Trade Using FVGs:
✅ For Buy Trades: Wait for price to return to a bullish FVG and confirm support before entering long.
✅ For Sell Trades: Wait for price to revisit a bearish FVG and confirm resistance before entering short.
✅ Use with candlestick patterns, trend analysis, or volume for additional confirmation.
⚙️ Customizable Settings:
Adjust the ATR Multiplier to control how large a gap must be before triggering a signal.
Enable alerts to stay informed in real time when new FVGs appear.
💡 Why Use This Indicator?
Fair Value Gaps are widely used by professional traders to spot areas of liquidity, making them valuable for scalping, swing trading, and institutional-style trading.
🚀 Add it to your TradingView chart and start trading with precision!

Inverse FVG with Quadrants [Modified]# Inverse FVG with Quadrants
*Modified version of original indicator by **tradeforopp**
## Overview
This advanced Fair Value Gap (FVG) indicator identifies both regular and inverse fair value gaps with precision, displaying them in a visually intuitive quadrant-based system. The enhanced version now features automatic timeframe selection that aligns higher timeframe FVGs with your current chart period for multi-timeframe analysis.
## Key Features
### 🔹 Fair Value Gap Detection
- **Regular FVGs**: Identifies traditional bullish and bearish fair value gaps
- **Inverse FVGs**: Automatically detects and displays inverse fair value gaps when price closes through a regular FVG
- **Quadrant Display**: Shows only the relevant half of each FVG for cleaner visual analysis (upper quadrant for bullish patterns, lower quadrant for bearish)
### 🔹 Smart Timeframe Management
- **Auto Timeframe Selection**: Automatically selects the appropriate higher timeframe based on your current chart:
- 1min → 15min
- 3min → 30min
- 5min → 1h
- 15min → 4h
- 1h → Daily
- 4h → Weekly
- **Manual Override**: Optional manual timeframe selection still available
### 🔹 Visual Customization
- Adjustable colors for both regular and inverse FVGs
- Optional box extension
- Customizable display limits to prevent chart clutter
- Session filtering capabilities
### 🔹 Trading Signals
- FVGs provide potential support/resistance zones and price targets
- Inverse FVGs offer confirmation of trend continuation or reversal
- Alert conditions for new FVG creation, regular FVG, and inverse FVG events
## How to Use
1. Apply the indicator to your chart
2. Enable "Auto Timeframe Selection" for multi-timeframe analysis (recommended)
3. Adjust displacement settings to filter for more significant FVGs
4. Use regular FVGs as potential zones where price may return to fill the gap
5. Watch for inverse FVGs as confirmation signals when price breaks through regular FVGs
This refined indicator combines powerful FVG analysis with automatic timeframe alignment to provide traders with clear, actionable insights across multiple timeframes. Perfect for both intraday traders and swing traders looking for high-probability entry and exit points.
Credits to @tradeforopp for creating the original version of this indicator. This is a modified version with enhanced features while preserving the core functionality.
## Tips
- Blue boxes (FVG+) indicate bullish fair value gaps (potential support)
- Red boxes (FVG-) indicate bearish fair value gaps (potential resistance)
- When price closes through an FVG, watch for the inverse FVG as a confirmation signal
- Use the dashed centerline as a potential target within each FVG

Fair Value Gap Oscillator | Flux Charts💎 GENERAL OVERVIEW
Introducing the new Fair Value Gap Oscillator (FVG Oscillator) indicator! This unique indicator identifies and tracks Fair Value Gaps (FVGs) in price action, presenting them in an oscillator format to reveal market momentum based on FVG strength. It highlights bullish and bearish FVGs while enabling traders to adjust detection sensitivity and apply volume and ATR-based filters for more precise setups. For more information about the process, check the "📌 HOW DOES IT WORK" section.
Features of the new FVG Oscillator:
Fully Customizable FVG Detection
An Oscillator Approach To FVGs
Divergence Markers For Potential Reversals
Alerts For Divergence Labels
Customizable Styling
📌 HOW DOES IT WORK?
Fair Value Gaps are price gaps within bars that indicate inefficiencies, often filled as the market retraces. The FVG Oscillator scans historical bars to identify these gaps, then filters them based on ATR or volume. Each FVG is marked as bullish or bearish according to the trend direction that preceded its formation.
An oscillator is calculated using recent FVGs with this formula :
1. The Oscillator starts as 0.
2. When a new FVG Appears, it contributes (FVG Width / ATR) to the oscillator of the corresponding type.
3. Each confirmed bar, the oscillator is recalculated as OSC = OSC * (1 - Decay Coefficient)
The oscillator aggregates and decays past FVGs, allowing recent FVG activity to dominate the signal. This approach emphasizes current market momentum, with oscillations moving bullish or bearish based on FVG intensity. Divergences are marked where FVG oscillations suggest potential reversals. Bullish Divergence conditions are as follows :
1. The current candlestick low must be the lowest of last 25 bars.
2. Net Oscillator (Shown in gray line by default) must be > 0.
3. The current Bullish FVG Oscillator value should be no more than 0.1 below the highest value from the last 25 bars.
Traders can use divergence signals to get an idea of potential reversals, and use the Net FVG Oscillator as a trend following marker.
🚩 UNIQUENESS
The Fair Value Gap Oscillator stands out by converting FVG activity into an oscillator format, providing a momentum-based visualization of FVGs that reveals market sentiment dynamically. Unlike traditional indicators that statically mark FVG zones, the oscillator decays older FVGs over time, showing only the most recent, relevant activity. This approach allows for real-time insight into market conditions and potential reversals based on oscillating FVG strength, making it both intuitive and powerful for momentum trading.
Another unique feature is the combination of customizable ATR and volume filters, letting traders adapt the indicator to match their strategy and market type. You can also set-up alerts for bullish & bearish divergences.
⚙️ SETTINGS
1. General Configuration
Decay Coefficient -> The decay coefficient for oscillators. Increasing this setting will result in oscillators giving the weight to recent FVGs, while decreasing it will distribute the weight equally to the past and recent FVGs.
2. Fair Value Gaps
Zone Invalidation -> Select between Wick & Close price for FVG Zone Invalidation.
Zone Filtering -> With "Average Range" selected, algorithm will find FVG zones in comparison with average range of last bars in the chart. With the "Volume Threshold" option, you may select a Volume Threshold % to spot FVGs with a larger total volume than average.
FVG Detection -> With the "Same Type" option, all 3 bars that formed the FVG should be the same type. (Bullish / Bearish). If the "All" option is selected, bar types may vary between Bullish / Bearish.
Detection Sensitivity -> You may select between Low, Normal or High FVG detection sensitivity. This will essentially determine the size of the spotted FVGs, with lower sensitivies resulting in spotting bigger FVGs, and higher sensitivies resulting in spotting all sizes of FVGs.
3. Style
Divergence Labels On -> You can switch divergence labels to show up on the chart or the oscillator plot.

Cumulative Volume Delta Strategy | Flux Charts💎 GENERAL OVERVIEW
Introducing the Cumulative Volume Delta Strategy (CVDS) Indicator, an advanced tool designed to enhance trading strategies by identifying potential trend reversals through volume dynamics. This script features integrated order block detection, Fair Value Gaps (FVGs), and a dynamic take-profit (TP) and stop-loss (SL) system. For an in-depth understanding of the strategy, refer to the "HOW DOES IT WORK?" section below.
Features of the new Cumulative Volume Delta Strategy (CVDS) Indicator :
Cumulative Volume Delta-based Strategy
Order Block and Fair Value Gap (FVG) Entry Methods
Dynamic TP/SL System
Customizable Risk Management Settings
Alerts for Buy, Sell, TP, and SL Signals
📌 HOW DOES IT WORK ?
The CVDS indicator operates by tracking the net volume difference between buyers and sellers to identify divergences that could indicate potential trend reversals. A cumulative volume delta (CVD) calculation is employed to measure the intensity of these divergences in relation to price movements. The net volume sum is reset every trading day (can be changed from the settings using the anchor period option), and divergences are detected when the cumulative volume crosses the 0-line over or under.
Once a significant divergence is detected, the indicator identifies breakout points, confirmed by either Fair Value Gaps (FVGs) or Order Blocks (OBs). Depending on your chosen entry mode, the indicator will trigger a buy or sell entry when the confirmation signal aligns with the breakout direction. Alerts for Buy, Sell, Take-Profit, and Stop-Loss are available.
Note that the indicator cannot run on 1-minute and 1-second charts, as it needs to get data from a lower timeframe. 1-minutes & 1-second timeframes are the minimum timeframes in their ranges respectively.
🚩 UNIQUENESS
What sets this indicator apart is the combination of volume divergence analysis with advanced price action tools like Fair Value Gaps (FVGs) and Order Blocks (OBs). The ability to choose between these methods, along with a dynamic TP/SL system that adapts based on volatility, provides flexibility for traders in any market condition. The backtesting dashboard provides metrics about the performance of the indicator. You can use it to tune the settings for best use in the current ticker. The CVD-based strategy ensures that trades are initiated only when meaningful divergences between volume and price occur, filtering out noise and increasing the likelihood of profitable trades.
⚙️ SETTINGS
1. General Configuration
Anchor Period: Time anchor period used in CVD calculation. This is essentially the period that the volume delta sum will be reset. Lower timeframes may result in more entries at the cost of less reliable results.
Entry Mode: Choose between FVGs or OBs to trigger your entries based on the confirmation signals.
Retracement Requirement: Enable to confirm the entry after a retracement toward the FVG or OB.
2. Fair Value Gaps
FVG Sensitivity: Modify the sensitivity of FVG detection, allowing for more or fewer gaps to be considered valid.
3. Order Blocks (OB)
Swing Length: Define the swing length to identify OB formations. Shorter lengths find smaller OBs, while longer lengths detect larger structures.
4. TP / SL
TP / SL Method:
a) Dynamic: The TP / SL zones will be auto-determined by the algorithm based on the Average True Range (ATR) of the current ticker.
b) Fixed : You can adjust the exact TP / SL ratios from the settings below.
Dynamic Risk: The risk you're willing to take if "Dynamic" TP / SL Method is selected. Higher risk usually means a better winrate at the cost of losing more if the strategy fails. This setting is has a crucial effect on the performance of the indicator, as different tickers may have different volatility so the indicator may have increased performance when this setting is correctly adjusted.

ICT Balance Price Range [UAlgo]The "ICT Balance Price Range " indicator identifies and visualizes potential balance price ranges (BPRs) on a price chart. These ranges are indicative of periods where the market exhibits balance between bullish and bearish forces, often preceding significant price movements.
🔶 What is Balanced Price Range (BPR) ?
Balanced Price Range is a concept based on Fair Value Gap. Balanced price range (BPR) is the area on price chart where two opposite fair value gaps overlap.
When price approaches the Balanced Price Range (BPR), we assume that the price will react quickly and strongly here. This is because its the combination of two fair value gaps and being a good point of interest for smart money traders.
🔶 Key Features:
Bars to Consider: Determines the number of bars to evaluate for BPR conditions.
Threshold for BPR: Sets the minimum range required for a valid BPR to be identified.
Remove Old BPR: Option to automatically remove invalidated BPRs from the chart.
Bearish/Bullish Box Color: Customizable colors for visual representation of bearish and bullish BPRs.
🔶 Disclaimer
This indicator is provided for educational and informational purposes only.
It should not be considered as financial advice or a recommendation to buy or sell any financial instrument.
The use of this indicator involves inherent risks, and users should employ their own judgment and conduct their own research before making any trading decisions. Past performance is not indicative of future results.
🔷 Related Scripts
Fair Value Gaps (FVG)

CME Gap Oscillator [CryptoSea]Introducing the CME Gap Oscillator , a pioneering tool designed to illuminate the significance of market gaps through the lens of the Chicago Mercantile Exchange (CME). By leveraging gap sizes in relation to the Average True Range (ATR), this indicator offers a unique perspective on market dynamics, particularly around the critical weekly close periods.
Key Features
Gap Measurement : At its core, the CME Oscillator quantifies the size of weekend gaps in the context of the market's volatility, using the ATR to standardize this measurement.
Dynamic Levels : Incorporating a dynamic extreme level calculation, the tool adapts to current market conditions, providing real-time insights into significant gap sizes and their implications.
Band Analysis : Through the introduction of upper and lower bands, based on standard deviations, traders can visually assess the oscillator's position relative to typical market ranges.
Enhanced Insights : A built-in table tracks the frequency of the oscillator's breaches beyond these bands within the latest CME week, offering a snapshot of recent market extremities.
Settings & Customisation
ATR-Based Measurement : Choose to measure gap sizes directly or in terms of ATR for a volatility-adjusted view.
Band Period Adjustability : Tailor the oscillator's sensitivity by modifying the band calculation period.
Dynamic Level Multipliers : Adjust the multiplier for dynamic levels to suit your analysis needs.
Visual Preferences : Customise the oscillator, bands, and table visuals, including color schemes and line styles.
In the example below, it demonstrates that the CME will want to return to the 0 value, this would be considered a reset or gap fill.
Application & Strategy
Deploy the CME Oscillator to enhance your market analysis
Market Sentiment : Gauge weekend market sentiment shifts through gap analysis, refining your strategy for the week ahead.
Volatility Insights : Use the oscillator's ATR-based measurements to understand the volatility context of gaps, aiding in risk management.
Trend Identification : Identify potential trend continuations or reversals based on the frequency and magnitude of gaps exceeding dynamic levels.
The CME Oscillator stands out as a strategic tool for traders focusing on gap analysis and volatility assessment. By offering a detailed breakdown of market gaps in relation to volatility, it empowers users with actionable insights, enabling more informed trading decisions across a range of markets and timeframes.

Volume Footprint Voids [BigBeluga]Volume Footprint Voids is a unique tool that uses lower timeframe calculation to plot different styles of single candle POC.
This indicator is very powerful for scalping and finding very precise entry and exits, spotting potential trapped traders, and more.
Unlike many other volume profiles, this aims to plot single candle profiles as well as their own footprints.
🔶 FEATURES
The script includes the following settings:
Windows: Plotting style and calculations
Coloring modes
Display modes
lower-timeframe calculations
🔶 CALCULATION
In the image above we can see how the script calculates each level position that will serve as a calculation process to see how much volume/closes there are within the levels.
In the image above, we can have a more clear example of how we count each candle close.
We use the prior screenshot as an example, after setting each level we will use the lower-timeframe input to measure the amount of closes within the ranges.
Depending on the lot size, the box will be larger or smaller, usually the POC will always have the highest box size.
NOTE: Size is the starting point, always from the low of the candle.
To find more voids, select a closer LTF to the current one you're using.
To find fewer voids, select a timeframe away from your current one.
Due to Pine Script limitations, we are only able to plot a certain amount of footprints, and we can't plot the whole history chart.
POC will be the largest block displayed, indicating the time point of control
Gray areas are closes above the average
Black are Void or imbalance that price will fill in the future, like FVG
The image above shows an incorrect size input that will lead to bad calculations, while on the other side, a correct size input that will lead to a clear vision and better calculation.
🔶 WINDOWS
The "▲▼" Mode will display delta buyers and delta sellers coloring with voids as black.
It also offers a gradient mode for a beautier visualization
The "Total Volume" mode will display the net volume within the lot size (closes within the levels).
This is useful to spot possible highest net volume within the same highest lot size.
The "POC + Gaps" will show both POC and Gaps as the highest block while all the rest will be considered as the smaller block.
This is useful to see where the highest lot were and if there are higher or lower imbalances within the candle
The last option "Gaps" will simply display the gaps as the highest block, while the POC as the lowest block.
This is useful to have a better view of the gaps areas
🔶 EXAMPLE
This is one of the most basic examples of how this script can be used. POC at the bottom creating a strong support area as price holds and creates higher voids gap that price fills while rising.
🔶 SETTINGS
Users have full control over the script, from colors to choosing the lower-timeframe inputs to disabling the lot size.

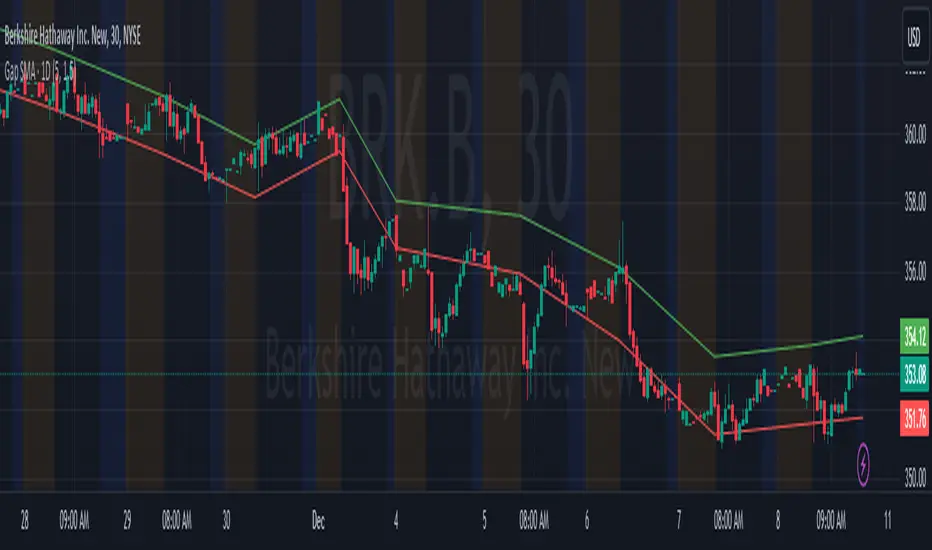
Gap SMAGap SMA Indicator - Analyzing Price Gaps with Moving Averages
Description:
The Gap SMA (Simple Moving Average) indicator is a powerful tool designed to analyze price gaps, a phenomenon occurring when the market opens significantly higher or lower than the previous session's close. These gaps often signify abrupt shifts in market sentiment, driven by fundamental news, earnings reports, or overnight geopolitical events.
This indicator calculates and visualizes the average gap-up and gap-down based on historical data, aiding traders in identifying potential support or resistance levels driven by gap behavior.
What is a Gap?
In financial markets, a gap occurs when there is a notable difference (upward or downward) between the previous session's close and the current session's open. Gaps can be categorized as gap-ups (when the current open is higher than the previous close) or gap-downs (when the current open is lower than the previous close).
Key Features:
User-Defined Parameters: Adjust the number of gaps considered and a multiplier factor for precise customization.
Average Gap Visualization: Plotting lines representing the moving average of gap-ups and gap-downs.
Alert System: Alerts notify traders when the close price crosses above/below the average gap lines, offering potential entry or exit signals.
This tool is particularly useful for swing traders and investors interested in understanding historical gap patterns and integrating this information into their decision-making process. It can assist in determining potential stop-loss levels, defining entry or exit points, and gauging market sentiment based on gap behavior.
Feel free to experiment with various settings and timeframes to suit your trading strategy and risk tolerance. Your feedback and suggestions for further enhancements are highly appreciated!
Fair Value Gap [MyTradingCoder]Introducing the "Fair Value Gap" indicator, a powerful tool designed to identify and visualize areas of potential market gaps where leftover orders may reside. This indicator utilizes price action analysis, specifically focusing on fair value gaps that occur between the current candle and the candle two bars prior.
The Fair Value Gap indicator draws customizable zones on the chart, representing bullish or bearish areas with distinct green or red colors. These zones highlight market gaps where price action has left a void, indicating the possibility of significant order activity in that region.
Key Features:
Liquidity Zone: Utilize the Fair Value Gap zones as areas of liquidity, offering potential entry points for trades.
Support/Resistance Indicator: Configure the indicator to extend beyond the initial breakout or gap fill, allowing it to act as a support/resistance zone indicator.
The Fair Value Gap indicator has several adjustable settings to customize its behavior according to your trading preferences. These settings include:
Invalidation Outcome: Choose how the fair value gap zone is treated when it becomes invalidated. Options include:
-Stop Updating: Maintain the gap zone in its current state without further updates.
-Delete: Completely remove the fair value gap from the screen.
Invalidation Method: Determine the logic that invalidates the fair value gap. Options include:
-Gap Fill: Visually shrink the zone as price action closes the gap until it is completely filled, at which point it gets deleted entirely.
-Number Of Breakouts: Invalidate the gap after a certain number of breaks or flips over the zone's border. Configure the allowed number of breakouts with the "Breakouts Until Invalidation" input.
-Age Of Gap: Invalidate the gap after a specified number of bars have passed since its creation. Set the threshold with the "Bars Until Invalidation" input.
Color Customization: Customize the appearance of the fair value gap zones with various color inputs, including bullish and bearish border colors, middle line color (shared for both bullish and bearish gaps), bullish and bearish background colors.
Line Width: Adjust the width of the border lines and the center line within the fair value gap zone for better visual clarity.
Please note that the Fair Value Gap indicator is a valuable tool but should be used alongside other technical analysis methods to make well-informed trading decisions. It does not guarantee profitable trades but aims to provide insights into potential areas of interest.
Discover opportunities within market gaps and leverage the power of leftover orders with the Fair Value Gap indicator—an indispensable asset in your trading toolkit.
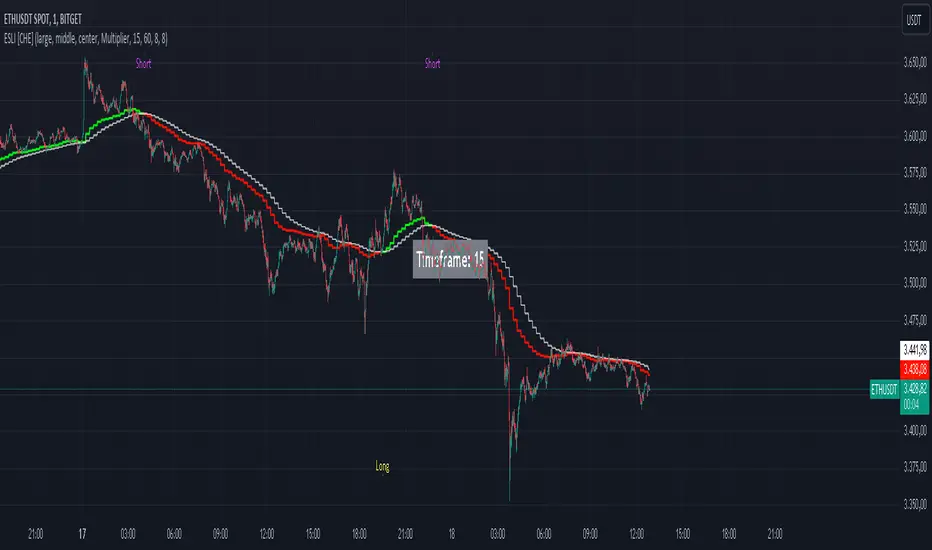
Ema Short Long Indicator[CHE]█ CONCEPTS
This Pine Script is an EMA Short Long indicator that displays the crossing EMA lines on the chart. The indicator uses three exponential moving averages (EMAs) to generate the buy and sell signals. The EMA lines are plotted as green (uptrend) and red (downtrend) lines. When the green line is above the white signal line, the indicator generates a buy signal, when the green line is below the white signal line, the indicator generates a sell signal. Arrows are also displayed marking the buy and sell signals. There is also an option to allow indicator repainting or not. Finally, users can also set alerts to be alerted to potential trading opportunities.
Note: please do not disable "time frame gaps". Allows to calculate the indicator on a Timeframe (TF) different from that of the chart Time window. The TF should ideally be higher than the charts to provide a broader perspective than
the TF of the chart. Using TFs lower than the chart's will deliver fragmentary results, since only the last value of intrabar is displayed (multiple values cannot be displayed for a single chart bar). The Gaps setting determines the behavior when the TF is higher than the TF of the chart. If 'gaps' is checked, higher TF values only come in and are interconnected on the diagram when the higher TF completed. This has the advantage of avoidance Real-time epainting. If Gaps is not enabled, Gaps are filled with the last higher TF value calculated, which will not produce a repaint Values on historical bars but repaint values realtime.
█ HOW TO USE IT
Load the indicator on an active chart (see the Help Center if you don't know how).
Time period
By default, the script uses an auto-stepping mechanism to adjust the time period of its moving window to the chart's timeframe. The following table shows chart timeframes and the corresponding time period used by the script. When the chart's timeframe is less than or equal to the timeframe in the first column, the second column's time period is used to calculate the Ema Short Long Indicator :
Chart Time
timeframe period
1min 🠆 1H
5min 🠆 4H
1H 🠆 1D
4H 🠆 3D
12H 🠆 1W
1D 🠆 1M
1W 🠆 3M
█ DESCRIPTION
The script begins by setting up the chart indicator with a short title, "ESLI", and enabling it as an overlay. It then initializes several variables for time conversions, to be used later in the script.
The timeStep_translate() function converts the timeframe of the chart into a string representing a larger time interval, based on the number of seconds in the timeframe. The resulting string is used to label the horizontal axis of the chart.
Next, the script defines several input variables that can be modified by the user. These include the colors of the EMA lines and the signals, whether or not the indicator is allowed to repaint (i.e. update past values based on future data), and the number of periods used to calculate the EMA and signal lines.
The f_security() function calls the request.security() function to fetch data from the specified security and timeframe, and is used to calculate the EMA and signal lines using the ta.ema() function. The clo variable is assigned the closing price data, adjusted for repainting and timeframe.
The EMA line is calculated using a weighted average of the EMA over the specified period and two times that period, as well as three times that period, divided by six. The signal line is calculated as the EMA of the EMA line over the specified period.
The col_css variable sets the color of the EMA line based on whether it is currently above or below the signal line. The script then plots the EMA and signal lines, and uses the plotshape() function to indicate long and short signals based on the crossovers and crossunders of the EMA and signal lines.
Finally, the script sets up alert conditions using the alertcondition() function to notify the user when a long or short signal is generated, including information about the symbol and closing price.
█ SPECIAL THANKS
Special thanks to LOXX, I wanted to take a moment to express my gratitude for his valuable input in the EMA calculation. His insights and expertise have greatly helped me in improving my Pine Script coding skills. Thanks to his suggestion, I was able to better understand the EMA formula and implement it effectively in my script.
Your generosity in sharing your knowledge and experience is truly appreciated. It is through collaboration and exchanging ideas that we can all grow and become better in our craft.
This script provides exact signals that, with suitable additional indicators, provide very good results.
Best regards
Chervolino
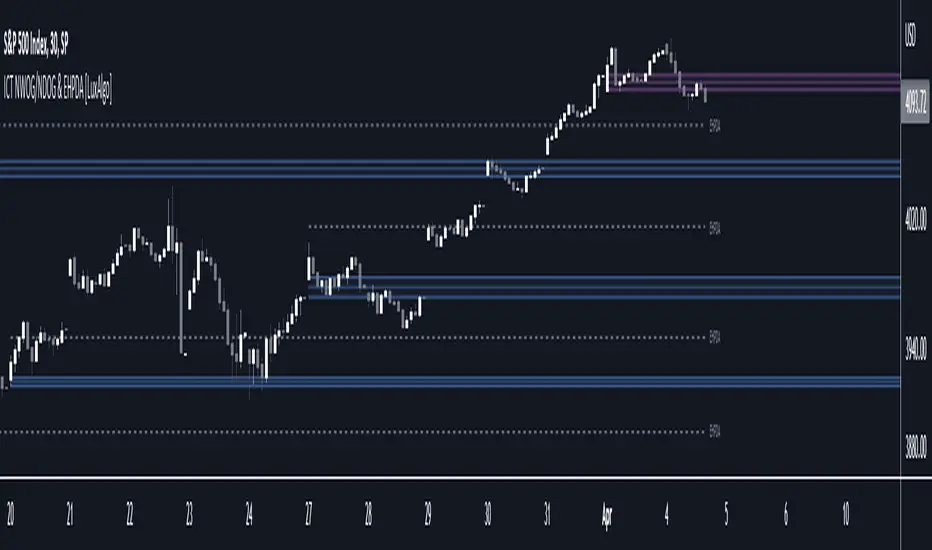
ICT NWOG/NDOG & EHPDA [LuxAlgo]This indicator displays New Week/Day Opening Gaps alongside Event Horizon PD Arrays which were conceptualized by a trader, ICT.
🔶 SETTINGS
Show: Determines if new week opening gaps (NWOG) or new day opening gaps (NDOG) are shown.
Amount: Controls the amount of most recent NWOGs/NDOGs to display on the chart.
Show EHPDA: Displays Event Horizons PD arrays.
🔶 USAGE
New Week/Day Opening Gaps are generally used as potential support or resistance areas.
Trader ICT describes that under consolidating market conditions, price tends to revert towards the opening gap area. This is consistent with other analysis suggesting that price has a tendency to come back toward gaps, ultimately looking to fill them.
ICT also introduces a novel concept, the "Event Horizon PD Array" (EHPDA) which are intermediary levels constructed from the average between the neighboring NWOGs or NDOGs.
EHPDA's are described by ICT as levels that "will not allow price to escape to the NWOG that will create a surge towards the NWOG it got too "close" to but has not yet reached."
Fan Projections [theEccentricTrader]█ OVERVIEW
This indicator automatically projects trendlines in the shape of a fan, from a single point of origin. In the example above I have applied the indicator twice to the 1D SPXUSD. The seven upper lines (green) are projected at an angle of -5 from the 1-month swing high anchor point. And the five lower lines (blue) are projected at an angle of 10 from the 1-week swing low anchor point.
█ CONCEPTS
Green and Red Candles
• A green candle is one that closes with a high price equal to or above the price it opened.
• A red candle is one that closes with a low price that is lower than the price it opened.
Swing Highs and Swing Lows
• A swing high is a green candle or series of consecutive green candles followed by a single red candle to complete the swing and form the peak.
• A swing low is a red candle or series of consecutive red candles followed by a single green candle to complete the swing and form the trough.
Peak and Trough Prices (Basic)
• The peak price of a complete swing high is the high price of either the red candle that completes the swing high or the high price of the preceding green candle, depending on which is higher.
• The trough price of a complete swing low is the low price of either the green candle that completes the swing low or the low price of the preceding red candle, depending on which is lower.
Historic Peaks and Troughs
The current, or most recent, peak and trough occurrences are referred to as occurrence zero. Previous peak and trough occurrences are referred to as historic and ordered numerically from right to left, with the most recent historic peak and trough occurrences being occurrence one.
Support and Resistance
• Support refers to a price level where the demand for an asset is strong enough to prevent the price from falling further.
• Resistance refers to a price level where the supply of an asset is strong enough to prevent the price from rising further.
Support and resistance levels are important because they can help traders identify where the price of an asset might pause or reverse its direction, offering potential entry and exit points. For example, a trader might look to buy an asset when it approaches a support level , with the expectation that the price will bounce back up. Alternatively, a trader might look to sell an asset when it approaches a resistance level , with the expectation that the price will drop back down.
It's important to note that support and resistance levels are not always relevant, and the price of an asset can also break through these levels and continue moving in the same direction.
Trendlines
Trendlines are straight lines that are drawn between two or more points on a price chart. These lines are used as dynamic support and resistance levels for making strategic decisions and predictions about future price movements. For example traders will look for price movements along, and reactions to, trendlines in the form of rejections or breakouts/downs.
█ FEATURES
Inputs
• Anchor Point Type
• Swing High/Low Occurrence
• HTF Resolution
• Highest High/Lowest Low Lookback
• Angle Degree
• Number Lines
• Line Color
Anchor Point Types
• Swing High
• Swing Low
• Swing High (HTF)
• Swing Low (HTF)
• Highest High
• Lowest Low
• Intraday Highest High (intraday charts only)
• Intraday Lowest Low (intraday charts only)
Swing High/Swing Low Occurrence
This input is used to determine which historic peak or trough to reference for swing high or swing low anchor point types.
HTF Resolution
This input is used to determine which higher timeframe to reference for swing high (HTF) or swing low (HTF) anchor point types.
Highest High/Lowest Low Lookback
This input is used to determine the lookback length for highest high or lowest low anchor point types.
Intraday Highest High/Lowest Low Lookback
When using intraday highest high or lowest low anchor point types, the lookback length is calculated automatically based on number of bars since the daily candle opened.
Angle Degree
This input is used to determine the angle of the trendlines. The output is expressed in terms of point or pips, depending on the symbol type, which is then passed through the built in math.todegrees() function. Positive numbers will project the lines upwards while negative numbers will project the lines downwards. Depending on the market and timeframe, the impact input values will have on the visible gaps between the lines will vary greatly. For example, an input of 10 will have a far greater impact on the gaps between the lines when viewed from the 1-minute timeframe than it would on the 1-day timeframe. The input is a float and as such the value passed through can go into as many decimal places as the user requires.
It is also worth mentioning that as more lines are added the gaps between the lines, that are closest to the anchor point, will get tighter as they make their way up the y-axis. Although the gaps between the lines will stay constant at the x2 plot, i.e. a distance of 10 points between them, they will gradually get tighter and tighter at the point of origin as the slope of the lines get steeper.
Number Lines
This input is used to determine the number of lines to be drawn on the chart, maximum is 500.
█ LIMITATIONS
All green and red candle calculations are based on differences between open and close prices, as such I have made no attempt to account for green candles that gap lower and close below the close price of the preceding candle, or red candles that gap higher and close above the close price of the preceding candle. This may cause some unexpected behaviour on some markets and timeframes. I can only recommend using 24-hour markets, if and where possible, as there are far fewer gaps and, generally, more data to work with.
If the lines do not draw or you see a study error saying that the script references too many candles in history, this is most likely because the higher timeframe anchor point is not present on the current timeframe. This problem usually occurs when referencing a higher timeframe, such as the 1-month, from a much lower timeframe, such as the 1-minute. How far you can lookback for higher timeframe anchor points on the current timeframe will also be limited by your Trading View subscription plan. Premium users get 20,000 candles worth of data, pro+ and pro users get 10,000, and basic users get 5,000.
█ RAMBLINGS
It is my current thesis that the indicator will work best when used in conjunction with my Wavemeter indicator, which can be used to set the angle. For example, the average wave height or amplitude could be used as the value for the angle input. Or some factor or multiple of such an average. I think this makes sense as it allows for objectivity when applying the indicator across different markets and timeframes with different energies and vibrations.
“If you want to find the secrets of the universe, think in terms of energy, frequency and vibration.”
― Nikola Tesla

Price Correction to fix data manipulation and mispricingPrice Correction corrects for index and security mispricing to the extent possible in TradingView on both daily and intraday charts. Price correction addresses mispricing issues for specific securities with known issues, or the user can build daily candles from intraday data instead of relying on exchange reported daily OHLC prices, which can include both legitimate special auction and off-exchange trades or illegitimate mispricing. The user can also detect daily OHLC prices that don’t reflect the intraday price action within a specified percent deviation. Price Correction functions as normal candles or bars for any time frame when correction is not needed.
On the 4th of October 2022, the AMEX exchange, owned by the New York Stock Exchange, decided to misprice the daily OHLC data for the SPY, the world’s largest ETF fund. The exchange eliminated the overnight gap that should have occurred in the daily chart that represents regular trading hours by showing a wick connecting near the close of the previous day. Neither the SPX, the SP500 cash index that the SPY ETF tracks, nor other SPX ETFs such as VOO or IVV show such a wick because significant price action at that level never occurred. The intraday SPY chart never shows the price drop below 372.31 that day, but there is a wick that extends to 366.57. On the 6th of October, they continued this practice of using a wick that connects with the close of the previous day to eliminate gaps in daily price action. The objective of this indicator is to fix such inconsistent mispricing practices in the SPY, NYA, and other indices or securities.
Price Correction corrects for the daily mispricing in the SPY to agree with the price action that actually occurred in the SPX index it tracks, as well as the other SPX ETFs, by using intraday data. The chart below compares the Price Correction of the SPY (top) to the SPX (middle) and the original mispriced SPY (bottom) with incorrect wicks. Price correction (top) removes those incorrect wicks (bottom) to match the SPX (middle).
The daily mispricing of the SPY follows after the successful deployment of the NYSE Composite Index mispricing, NYA, an index that represents all common stocks within the New York Stock Exchange, the largest exchange in the world. The importance of the NYA should not be understated. It is the price counterpart to NYSE’s market internals or statistics. Beginning in 2021, the New York Stock Exchange eliminated gaps in daily OHLC data for the NYA by using the close of the previous day as the open for the following day, in violation of their own NYSE Index Series Methodology. The Methodology states for the opening price that “The first index level is calculated and published around 09:30 ET, when the U.S. equity markets open for their regular trading session. The calculation of that level utilizes the most updated prices available at that moment.” You can verify for yourself that this is simply not the case. The first update of the NYA price for each day matches the close of the previous day, not the “most updated prices available at that moment”, causing data providers to often represent the first intraday bar with a huge sudden price change when an overnight price change occurred instead. For example, on 13 Jun 2022, TradingView shows a one-minute bar drop 2.3%. With a market capitalization of roughly 23 trillion dollars, the NYSE composite capitalization did not suddenly drop a half-trillion dollars in just one minute as the intraday chart data would have you believe. All major US indices, index ETFs, and even foreign indices like the Toronto TAX, the Australian ASXAL, the Bombay SENSEX, and German DAX had down gaps that day, except for the mispriced NYSE index. Price Correction corrects for this mispricing in daily OHLC data, as shown in the main chart at the top of this page comparing the original NYA (top) to the Price Corrected NYA (bottom).
Price Correction also corrects for the intraday mispricing in the NYA. The chart below shows how the Price Correction (top) replaces the incorrect first one-minute candles with gaps (bottom) from 22 Sep 2022 to 29 Sep 2022. TradingView is inconsistent in how intraday data is reported for overnight gaps by sometimes connecting the first intraday bar of the day to the close of the previous day, and other times not. This inconsistency may be due to manually changing the intraday data based on user support tickets. For example, after reporting the lack of a major gap in the NYA daily OHLC prices that existed intraday for 13 Jun 2022, TradingView opted to remove the true gap in intraday prices by creating a 2.3% half-a-trillion-dollar one-minute bar that connected the close of the previous day to show a sudden drop in price that didn’t occur, instead of adding the gap in the daily OHLC data that actually took place from overnight price action.
Price Correction allows users to detect daily OHLC data that does not reflect the intraday price action within a certain percent difference by changing the color of those candles or bars that deviate. The chart below clearly shows the start of the NYSE disinformation campaign for NYA that started in 2021 by painting blue those candles with daily OHLC values that deviated from the intraday values by 0.1%. Before 2021, the number of deviating candles is relatively sparse, but beginning in 2021, the chart is littered with deviating candles.
If there are other index or security mispricing or data issues you are aware of that can be incorporated into Price Correction, please let me know. Accurate financial data is indispensable in making accurate financial decisions. Assert your right to accurate financial data by reporting incorrect data and mispricing issues.
How to use the Price Correction
Simply add this “indicator” to your chart and remove the mispriced default candles or bars by right clicking on the chart, selecting Settings, and de-selecting Body, Wick, and Border under the Symbol tab. The Presets settings automatically takes care of mispricing in the NYA and SPY to the extent possible in TradingView. The user can also build their own daily candles based off of intraday data to address other securities that may have mispricing issues.

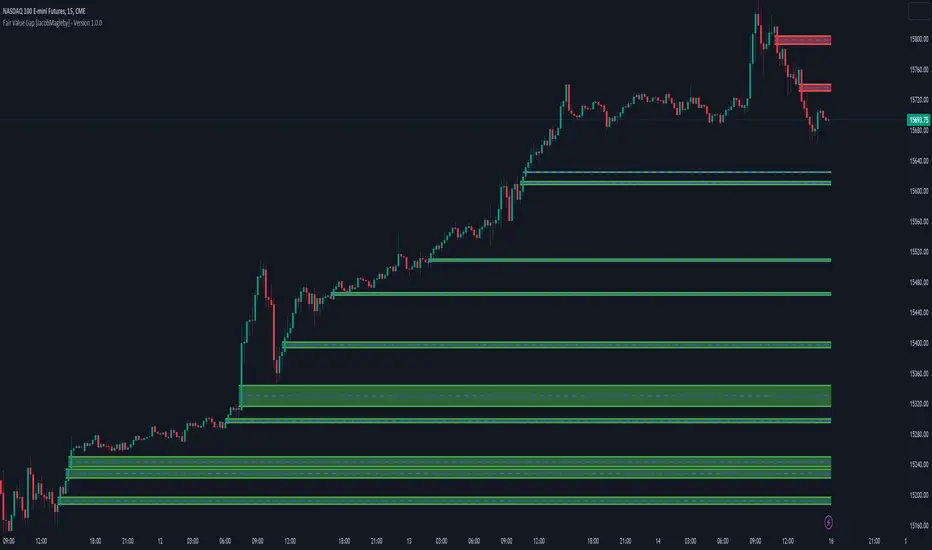
Fair Value Gap [LuxAlgo]Fair value gaps (FVG) highlight imbalances areas between market participants and have become popular amongst technical analysts. The following script aims to display fair value gaps alongside the percentage of filled gaps and the average duration (in bars) before gaps are filled.
Users can be alerted when an FVG is filled using the alerts built into this script.
🔶 USAGE
In practice, FVG's highlight areas of support (bullish FVG) and resistances (bearish FVG). Once a gap is filled, suggesting the end of the imbalance, we can expect the price to reverse.
This approach is more contrarian in nature, users wishing to use a more trend-following approach can use the identification of FVG as direct signals, going long with the identification of a bullish FVG, and short with a bearish FVG.
🔹 Mitigation
By default, the script highlights the areas of only unmitigated FVG's. Users can however highlight the mitigation level of mitigated FVG's, that is the lower extremity of bullish FVG's and the upper extremity of bearish FVG's.
The user can track the evolution of a mitigated FVG's using the "Dynamic" setting.
🔹 Threshold
The gap height can be used to determine the degree of imbalance between buying and selling market participants. Users can filter fair value gaps based on the gap height using the "Threshold %" setting. Using the "Auto" will make use of an automatic threshold, only keeping more volatile FVG's.
🔶 DETAILS
We use the following rules for detecting FVG's in this script:
Bullish FVG
low > high(t-2)
close(t-1) > high(t-2)
(low - high(t-2)) / high(t-2) > threshold
Upper Bullish FVG = low
Lower Bullish FVG = high(t-2)
Bearish FVG
high < low(t-2)
close(t-1) < low(t-2)
(low(t-2) - high) / high < -threshold
Upper Bearish FVG = low(t-2)
Lower Bearish FVG = high
🔶 SETTINGS
Threshold %: Threshold percentage used to filter our FVG's based on their height.
Auto Threshold: Use the cumulative mean of relative FVG heights as threshold.
Unmitigatted Levels: Extent the mitigation level of the number of unmitigated FVG's set by the user.
Mitigation Levels: Show the mitigation levels of mitigated FVG's.
Timeframe : Timeframe of the price data used to detect FVG's.

WoAlgo Premium v3.0
WoAlgo Premium v3.0 - Smart Money Analysis
Overview
** WoAlgo Premium v3.0 ** is an advanced technical analysis indicator designed for educational purposes. This tool combines Smart Money Concepts with multi-factor confluence analysis to help traders identify potential market opportunities across multiple timeframes.
The indicator integrates market structure analysis, order flow concepts, and technical momentum indicators into a comprehensive dashboard system. It is designed to assist traders in understanding institutional trading patterns and market dynamics through visual analysis tools.
### What It Does
This indicator provides:
**1. Smart Money Concepts Analysis**
- Market structure identification (Break of Structure and Change of Character patterns)
- Order block detection with volume confirmation
- Fair value gap recognition
- Liquidity zone mapping (equal highs and lows)
- Premium and discount zone calculations
**2. Multi-Factor Confluence Scoring**
The indicator calculates a proprietary confluence score (0-100) based on five key components:
- Price action analysis (30% weight)
- Volume confirmation (20% weight)
- Momentum indicators (25% weight)
- Trend strength measurement (15% weight)
- Money flow analysis (10% weight)
**3. Multi-Timeframe Analysis**
- Scans 5 different timeframes (5M, 15M, 1H, 4H, Daily)
- Calculates alignment percentage across timeframes
- Displays trend and structure status for each period
**4. Visual Dashboard System**
- Comprehensive main dashboard with 13 metrics
- Real-time screener table with 10 data columns
- Multi-timeframe scanner
- Performance tracking panel
### How It Works
**Market Structure Detection**
The indicator identifies key structural changes in price action:
- **BOS (Break of Structure)**: Indicates trend continuation when price breaks previous swing points
- **CHoCH (Change of Character)**: Signals potential trend reversal when market structure shifts
**Order Block Identification**
Order blocks are detected when:
- Significant volume appears at swing points
- Price shows strong directional movement from these levels
- Enhanced detection with extreme volume confirmation (OB++ markers)
**Fair Value Gap Recognition**
Gaps between candles are identified when:
- Price leaves inefficiencies in the market
- Three consecutive candles create a gap pattern
- Gap size exceeds minimum threshold based on ATR
**Confluence Calculation**
The system evaluates multiple technical factors:
1. **Price Position**: Relative to moving averages (EMA 20, 50, 200)
2. **Volume Analysis**: Standard deviation-based volume spikes
3. **Momentum**: RSI, MACD, Stochastic indicators
4. **Trend Strength**: ADX measurements
5. **Money Flow**: MFI indicator readings
Each factor contributes weighted points to create an overall confluence score that helps assess signal strength.
### Signal Types
**Confirmation Signals (▲ / ▼)**
Generated when:
- EMA crossovers occur (20/50 cross)
- Volume confirmation is present
- RSI is in appropriate zone
- Confluence score exceeds 50%
**Strong Signals (▲+ / ▼+)**
Higher-confidence signals requiring:
- Confluence score above 70%
- Extreme volume confirmation
- Alignment with 200 EMA trend
- MACD confirmation
- Bullish or bearish market structure
**Contrarian Signals (⚡)**
Reversal indicators appearing when:
- RSI reaches extreme levels (<30 or >70)
- Stochastic shows oversold/overbought conditions
- Price touches Bollinger Band extremes
- Potential divergence patterns emerge
**Reversal Zones**
Visual boxes highlighting areas where:
- Market structure conflicts with momentum
- High probability of directional change
- Key support/resistance levels interact
**Smart Trail**
Dynamic stop-loss indicator that:
- Adjusts based on ATR (Average True Range)
- Follows trend direction
- Updates automatically as price moves
- Provides risk management reference points
### Dashboard Components
**Main Dashboard (13 Metrics)**
1. **Confluence Score**: Current bull/bear percentage (0-100)
2. **Market Regime**: Trend classification (Strong Up/Down, Range, Squeeze)
3. **Signal Status**: Active buy/sell signal indication
4. **Structure State**: Current market structure (Bullish/Bearish/Neutral)
5. **Trend Strength**: ADX-based measurement
6. **RSI Level**: Momentum indicator with overbought/oversold zones
7. **MACD Direction**: Trend momentum confirmation
8. **Money Flow Index**: Smart money sentiment
9. **Volume Status**: Current volume relative to average
10. **Volatility Rating**: ATR percentage measurement
11. **ATR Value**: Average true range for position sizing
12. **MTF Alignment**: Multi-timeframe agreement percentage
**Screener Table (10 Columns)**
- Current symbol and timeframe
- Real-time price and percentage change
- Quality rating (star system)
- Active signal type
- Smart trail status
- Market structure state
- MACD direction
- Trend strength percentage
- Bollinger Band squeeze detection
**MTF Scanner (5 Timeframes)**
Displays for each timeframe:
- Trend direction indicator
- Market structure classification
- Visual confirmation with color coding
**Performance Metrics**
- Win rate percentage (simplified calculation)
- Total signals generated
- Current confluence score
- MTF alignment status
- Volatility level
### Settings and Customization
**Preset Styles**
Choose from predefined configurations:
- **Conservative**: Fewer, higher-quality signals
- **Moderate**: Balanced approach (recommended)
- **Aggressive**: More frequent signals
- **Scalper**: Short-term focused
- **Swing**: Longer-term oriented
- **Custom**: Full manual control
**Smart Money Concepts Controls**
- Toggle each feature independently
- Adjust swing length (3-50 periods)
- Enable/disable internal structure
- Control order block display
- Manage breaker block visibility
- Show/hide fair value gaps
- Display liquidity zones
- Premium/discount zone visualization
**Signal Configuration**
- Enable/disable confirmation signals
- Toggle strong signal markers
- Control contrarian signal display
- Show/hide reversal zones
- Smart trail activation
- Sensitivity adjustment (5-50)
**Visual Customization**
- Moving average display options
- MA period adjustments (Fast: 20, Slow: 50, Trend: 200)
- Support/resistance line toggle
- Dynamic S/R lookback period
- Candle coloring based on trend
- Color scheme customization
- Dashboard size options (Small/Normal/Large)
- Position placement (4 corners)
### How to Use
**Step 1: Initial Setup**
1. Add indicator to chart
2. Select appropriate preset or use Custom
3. Adjust timeframe to match trading style
4. Configure dashboard visibility preferences
**Step 2: Analysis Workflow**
1. Check MTF Scanner for timeframe alignment
2. Review Main Dashboard confluence score
3. Observe Market Regime classification
4. Identify active signals on chart
5. Confirm with Smart Money Concepts (order blocks, FVG, structure)
**Step 3: Trade Consideration**
Strong signals (▲+ / ▼+) require:
- Confluence score >70%
- MTF alignment >60%
- Confirmation from multiple dashboard metrics
- Support from Smart Money Concepts
- Appropriate volume levels
**Step 4: Risk Management**
- Use Smart Trail as dynamic stop-loss reference
- Consider ATR for position sizing
- Monitor volatility rating
- Respect support/resistance levels
- Combine with personal risk parameters
### Best Practices
**For Scalping (1M-5M timeframes)**
- Use Scalper preset
- Reduce swing length to 5-7
- Focus on strong signals only
- Monitor MTF alignment closely
- Quick entries near order blocks
**For Intraday Trading (15M-1H timeframes)**
- Use Moderate preset (recommended)
- Default swing length (10)
- Combine confirmation and strong signals
- Check MTF scanner before entry
- Use fair value gaps for entries
**For Swing Trading (4H-D timeframes)**
- Use Swing preset
- Increase swing length to 15-20
- Focus on strong signals
- Require high MTF alignment
- Patient approach with major structure levels
### Technical Specifications
**Indicators Used**
- Exponential Moving Averages (20, 50, 200)
- Hull Moving Average
- Relative Strength Index (14)
- MACD (12, 26, 9)
- Money Flow Index (14)
- Stochastic Oscillator (14, 3)
- ADX / DMI (14)
- Bollinger Bands (20, 2)
- ATR (14)
- Volume Analysis (SMA 20 with standard deviation)
**Calculation Methods**
- Swing detection using pivot high/low functions
- Volume confirmation via statistical analysis
- Multi-factor scoring with weighted components
- Dynamic support/resistance using highest/lowest functions
- Real-time MTF data via security() function
### Limitations and Considerations
**Important Notes**
1. This indicator is designed for educational and analytical purposes only
2. Historical performance does not guarantee future results
3. Signals should be confirmed with additional analysis
4. Market conditions vary and affect indicator performance
5. Not all signals will be profitable
6. Risk management is essential for all trading
**Known Limitations**
- Confluence scoring is algorithmic and not predictive
- MTF analysis requires sufficient historical data
- Effectiveness varies across different market conditions
- Sideways markets may produce conflicting signals
- High volatility can affect signal reliability
- Backtesting results shown are simplified calculations
**Not Suitable For**
- Automated trading without human oversight
- Sole basis for trading decisions
- Guaranteed profit expectations
- Inexperienced traders without proper education
- Trading without risk management plans
### Market Applicability
**Effective On**
- Trending markets (any direction)
- Clear structure formation periods
- Liquid instruments with consistent volume
- Multiple asset classes (forex, stocks, crypto, commodities)
- Various timeframes with appropriate settings
**Less Effective During**
- Extended ranging/choppy conditions
- Extremely low volume periods
- Major news events causing gaps
- Early market open with high spread
- Illiquid instruments with erratic price action
### Risk Disclaimer
**⚠️ IMPORTANT NOTICE**
This indicator is provided for **educational and informational purposes only**. It does not constitute financial advice, investment recommendations, or trading signals.
**Key Risk Factors:**
- Trading financial instruments involves substantial risk of loss
- Past performance does not indicate future results
- No indicator can predict market movements with certainty
- Users should conduct independent research and analysis
- Professional financial advice should be sought when appropriate
- Risk management and position sizing are critical to successful trading
- Users are solely responsible for their trading decisions
**Responsible Usage:**
- Combine with comprehensive market analysis
- Use appropriate stop-loss orders
- Never risk more than you can afford to lose
- Maintain realistic expectations
- Continue education on technical analysis principles
- Test thoroughly on demo accounts before live trading
- Understand all indicator features before using
### Educational Resources
**Understanding Smart Money Concepts**
Smart Money Concepts analyze how institutional traders and large market participants operate. Key principles include:
- Institutional order flow patterns
- Market structure changes
- Liquidity manipulation
- Supply and demand imbalances
- Order block formations
**Multi-Timeframe Analysis Theory**
Analyzing multiple timeframes helps:
- Identify overall market direction
- Improve entry timing
- Confirm trend strength
- Recognize consolidation periods
- Reduce conflicting signals
**Confluence Trading Approach**
Using multiple confirming factors:
- Increases signal reliability
- Reduces false signals
- Provides conviction for trades
- Helps with position sizing
- Improves risk-reward ratios
### Version History
**v3.0 (Current)**
- Multi-factor confluence scoring system
- Complete Smart Money Concepts implementation
- Real-time multi-timeframe analysis
- Four professional dashboard panels
- Enhanced order block detection
- Breaker block identification
- Premium/discount zone calculations
- Smart trail stop-loss system
- Customizable preset configurations
- Performance tracking metrics
**Development Philosophy**
This indicator was developed with focus on:
- Educational value for traders
- Transparent methodology
- Comprehensive feature set
- User-friendly interface
- Flexible customization options
### Technical Support
**For Questions About:**
- Indicator functionality
- Parameter optimization
- Signal interpretation
- Dashboard metrics
- Best practice recommendations
Please use TradingView's comment section below. The developer monitors comments and provides assistance to users learning to use the indicator effectively.
### Acknowledgments
This indicator implements concepts from:
- Smart Money Concepts trading methodology
- Multi-timeframe analysis techniques
- Technical indicator theory
- Market structure analysis principles
- Institutional order flow concepts
All implementations are original code and calculations based on established technical analysis principles.
---
## ADDITIONAL INFORMATION SECTION
**Category**: Indicators
**Type**: Market Structure / Multi-Timeframe Analysis
**Complexity**: Intermediate to Advanced
**Open Source**: Code visible for transparency and education
**Pine Script Version**: v6
**Chart Overlay**: Yes
**Maximum Objects**: 500 boxes, 500 lines, 500 labels

GapFinder & TrapFinderGapFinder Pro is a comprehensive gap detection and trap zone analysis tool designed for traders who understand that unfilled gaps act as price magnets. This indicator automatically identifies, tracks, and monitors price gaps while alerting you to potential bull and bear traps.
Gaps represent areas where price moved so quickly that no transactions occurred—leaving behind "fair value gaps" that price often returns to fill. This indicator makes tracking these opportunities effortless.

ICT Visible Center-Label CISD & FVGsThis indicator provides a clean, institutional-grade view of market shifts and liquidity gaps, specifically optimized for ICT (Inner Circle Trader) concepts.
Core Components
CISD (+/-): Identifies a "Change in State of Delivery." A (+) indicates a bullish shift, while a (-) indicates a bearish shift. These appear as fixed black lines with labels that delete automatically once price breaches the level.
Multi-Timeframe FVGs: Automatically plots Fair Value Gaps from the 5m, 15m, 1H, and 4H timeframes simultaneously.
Center-Locked Labels: Timeframe labels (e.g., "1H") are centered within the gaps, making them easy to identify without scrolling back through price history.
Auto-Cleaning Logic: To keep your chart clutter-free, gaps and CISD levels are instantly removed from the screen the moment they are mitigated (filled) by price.
