Gann FanHello Traders,
I got some messages about Gann Fan script and now here Gann Fan script is in your use.
it finds highest and lowest levels in last ~300candles and draws Gann Fan. if Highest level is prior than lowest level than Gann Fan from highest level has solid lines, Gann Fan from Lowest level has dashed lines. and vise versa.
The source code is hidden but it's free to use script.
Enjoy!
"gann" için komut dosyalarını ara

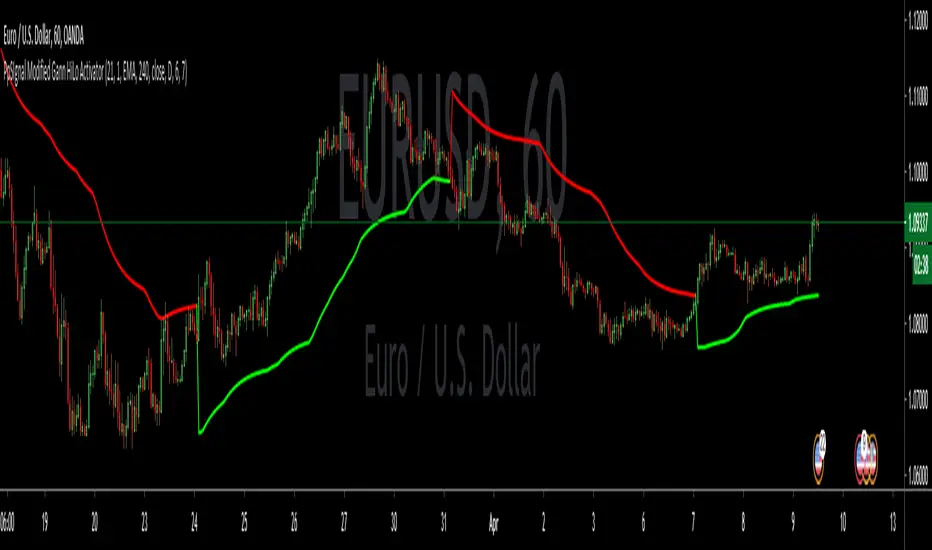
PpSIgnal Modified Gann HiLo ActivatorGann Hi Lo Activator Indicator fue desarrollado inicialmente por Robert Krausz.
El gann Hilo Original es simplemente un promedio móvil de los tres períodos anteriores, bajo o alto.
Yo lo he cambiado por precio de apertura y precio de cierre para evitar repintes .
Este indicador de seguimiento de tendencia, se utiliza para determinar la tendencia del mercado y también para identificar las señales de negociación.
Pero cuando el mercado está lateralizado, le resulta difícil generar señales comerciales precisas. Puede interpretar el indicador leyéndolo de la siguiente manera. En un mercado de tendencia alcista, el indicador pe [pintara de verde en tendecia bajista de rojo.
también le hemos agregado un media movil Tilson para hacer scaplin dentro de una tendencia definida.
Gann Hi Lo Activator Indicator was originally developed by Robert Krausz.
The Original Gann is simply a moving average of the previous three periods, low or high.
I have changed it for the opening price and the closing price to avoid repainting.
This trend monitoring indicator is used to determine the market trend and also to identify trading signals.
But when the market is lateralized, it is difficult for you to generate accurate trading signals. You can interpret the indicator by reading it as follows. In an uptrend market, the indicator pe [will paint green in a downtrend red.
We have also added a Tilson moving average to scaplin within a defined trend.
Gann Square Numbers S/R Levels This script can draw support and demand levels using Gann numbers of natural level.
Functions:
1: Default levels draw from natural numbrers 1 to 100.
2. can change minimum and maximum numbers of natural number. e.g min 50 and max 60. it will draw levels from 50 to 60.
3. You can filter levels of natural number by even and odd.
4. you can draw decimal levels of natural numbers also. e.g if natural number is 50
1.you can draw gann number for 50.01, 50.02, 50.03 , 50.04....
2. you can filter decimal points by odd, even, multiple of 3,5,10,20,25,50 also.

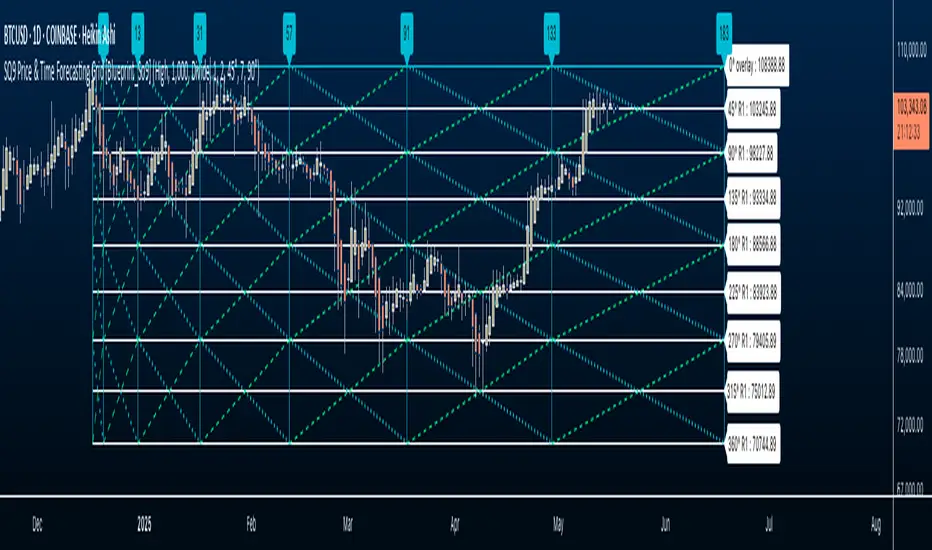
Square of Nine Price & Time Forecasting Grid📐 Square of Nine Price and Time Forecasting Grid
Adapted and Interpreted by Javonnii | Inspired by Patrick Mikula
The So9 Price and Time Forecasting Grid is a self-contained forecasting grid that allows traders to visually forecast levels in both price and time, using only Square of Nine calculations.
This indicator dynamically generates an expandable grid of angles, levels, and timeline based on the placement of a single anchor point, typically from a significant high or low. It requires no manual drawing or external tools.
🔍 How It Works:
The So9 Price and Time Forecasting Grid uses Square of Nine calculation and rotational logic to project price levels, time intervals, and internal angular structure from a single anchor point.
Once applied to the chart, the grid self-generates:
• Price levels using 360° degree Square of Nine intervals
• Timeline projections using Square of Nine progression intervals
• Diagonal and cardinal cross angles that dynamically propagate from the anchor
• Granular diagonal angle control, letting you refine internal grid resolution for tighter price structural analysis in relation to the forecasting grid.
⚙️ Setup Instructions
1. Select a Significant Pivot:
After loading the indicator, you’ll be prompted to select a significant high or low on your chart. This serves as the anchor point for the entire grid.
2. Price Grid Auto-Population:
Once anchored, Square of Nine price levels will automatically populate on the chart. These levels reflect Dynamic Square of Nine intervals from the anchor using rotational math.
3. Scale to Fit Your Instrument:
Use the provided UI settings to scale the grid to fit your instrument’s price structure. This ensures the levels align with actual historical price.
4. Engage Timelines:
Activate the timeline progression feature to generate forward-projected time intervals using Square of Nine-based timing logic. The entire grid can be extended up to 500 bars ahead on any timeframe.
5. Add Diagonal Angles:
Select which Square of Nine angle resolution you’d like to overlay from either the cardinal cross or diagonal cross based on Square of Nine geometry. This will populate diagonal levels within the grid, creating a full structural grid.
6. Customize Visuals:
You can toggle or hide price levels, timelines, or diagonal angles independently.
The entire grid can also be color-coded and customized to match your charting preferences.
All elements are plotted automatically. There is no manual drawing or calculation required. You can toggle the components on or off based on your workflow:
• Hide price levels if you just want time lines.
• Focus on angles without price levels.
• Use timeline progression independently.
📘 Attribution and Permission
This tool is inspired by concepts from "The Definitive Guide to Forecasting Using W.D. Gann’s Square of Nine" by Patrick Mikula.
The indicator reflects my personal adaptation and implementation of these forecasting principles within TradingView.
I have asked for and received permission from Patrick Mikula to share and publish tools derived from his work.
This applies to this script and to any other indicators I’ve developed that incorporate or build upon his material.
Documentation of this permission is available upon request.
Credit and respect to Patrick Mikula for his contributions to Gann-based research and for granting me the opportunity to share these tools with others.
Double Numbered Triangle Chart Progression | RegressionThe Double-Numbered Triangle Progression | Regression Indicator enables forecasting of support and resistance levels by progressing or regressing on the Triangle Chart from a user-selected pivot price. The indicator also plots adjustable pivots on both the chart and the Triangle Price and Time Chart.
How to use to forecast support and resistance levels:
1. Select a Pivot Point: Set the correct price to the pivot by selecting High or Low in the indicator.
2. Set Price Increment: Choose a price increment to adjust the starting price on the Triangle Chart (e.g., 1 or -0.01).
3. Rotate to adjust the number of levels on the Triangle Chart.
4. Plot Levels: Choose the Left Edge, Center, or Right Edge of the Triangle Chart to plot support and resistance levels. These levels automatically expand or decrease depending on the number of levels in step 3. The selected angle's price values are applied to the chart with labels on both sides. The left labels represent the time variable, and the right labels indicate the price. The time variable is used in conjunction with my other indicator "Price and Longitude Angles." The same goes for the Double Numbered Square of Nine indicator.
5. Review Levels: Examine the plotted support and resistance levels with recent market pivots.
6. Identify Correlations: Find the Triangle edge or center that aligns with the most market pivots.
7. The indicator plots user-adjustable pivots on both candles/bars and shows their placement on the Triangle Chart in both Progression and Regression. This visualization helps users identify which angles the highs and lows favor from the selected pivot. Pivot levels' colors can be customized. The close price is plotted on the Triangle Chart in real time with a white background.
Each market has its tendencies, favoring specific angles from the Triangle Chart. The basic idea is to choose between the Left edge, Center, or Right edge of the Triangle to forecast support and resistance levels.
Settings:
Overview:
Example of Forecasting Support and resistance level using this indicator:
In the image above, I am regressing from the significant high at a rate of $-0.008 per cell as shown on the main info label. Based on the plotted pivots, I have chosen the right edge of the triangle as it aligns with these recent pivots. I have drawn a lime green vertical line to indicate that as we add layers to the triangle chart, we introduce support and resistance levels based on the identified angle that aligns with these early pivots from the high.
In the image below, I've moved forward in time to illustrate how the initial angle chosen based on the early pivots forecasted support and resistance levels on $DOGE. Do not expect the price to turn sharply at the levels the indicator generates. As P. Mikula mentions in his work, and I apply the same with the Triangle Chart, " The Square of Nine successfully defines market price swings but does not cause the market to form pivots. "
This indicator is inspired by the methodologies detailed by Patrick Mikula in his book, The Definitive Guide to Forecasting using W.D Gann's Square of Nine. I recommend checking it out. He also mentions another use case as a Triangle Price and Time chart in his book, Gann Scientific Method Unveiled, Volume 2, where you can use my open-source indicator "Price and Longitude Angle" alongside both the Doubled Numbered Square of Nine and this Triangle Chart indicator.
FYI, I am not affiliated with Patrick Mikula in any way.
Planned improvements include adding two more angles: Left Center column and Right Center column as additional options to select.
FYI: Please ensure you select the high when regressing from a high. Also, make sure to add enough layers on the Triangle to see all the pivots. Once you've identified an angle, you can hide the table to gain back space on the chart. Use rounding precision for lower prices.

Doubled Numbered Square of Nine Progression | RegressionThe Doubled Number Square of Nine Progression | Regression Indicator enables forecasting of support and resistance levels using the SQ9 progression or regression from a user-selected pivot price. The indicator also plots adjustable pivots on both the chart and the Square of Nine.
How to use to forecast support and resistance levels:
1. Select a Pivot Point: Choose a top or bottom pivot to use as the starting point. Select High or Low in the indicator to set the correct price to the pivot.
2. Set Price Increment or Decrement: Select a price increment to advance the starting price on the Square of Nine (for example 1 or -0.01).
3. Rotate to add or decrease the number of rungs on the Square on Nine: Rotate the Square of Nine and adjust the dimensions. The horizontal levels correlate to the rotation of the Square of Nine.
4. Plot Levels: Select a Square of Nine angle to plot the support and resistance levels based on the selected increments. These levels auto expand and decrease depending on the number of rotations in step 3. The price values from each of the selected diagonal or cardinal cross are applied to the chart with labels on both left and right. Left labels represent the cell the time variable and the right label is price.
5. Review Levels: Conduct a simple review of the plotted support and resistance levels in relation to recent market pivots.
6. Identify Correlations: Identify the Square of Nine cardinal cross or diagonal cross angle that correlates with the most market pivots.
7. The indicator plots user-adjustable pivots on both candles/bars and displays their placement on the Square of Nine in both Progression and Regression. The close price is plotted on the Square of Nine in real-time with a white background. This helps users identify which angles the highs and lows favor from the selected pivot. The pivot levels' colors can be adjusted.
Each market has its tendencies, favoring specific angles from the cardinal or diagonal cross. The basic idea is to choose between the diagonal cross and cardinal cross angles to forecast support and resistance levels.
Settings:
Overview:
Example on Forecasting Support and resistance level using this indicator:
In the image above, I'm progressing from the significant low at a rate of $200 per cell. Based on the plotted pivots, I've selected the 315-degree angle on the diagonal cross as it aligns with a few recent pivots. Now, I've drawn a vertical line to show that as we add rungs to the Square of Nine, we introduce support and resistance levels based on the identified angle that aligns with these early pivots from the low.
In the image below, I've moved forward in time to show how the initial angle selected based on the early pivot forecasted support and resistance levels around the high in BTC. Do not expect the price to turn sharply at the levels the indicator generates, but use it to help identify SQ9 levels that may form market turns. As P. Mikula mentions in his work, "The Square of Nine successfully defines market price swings but it does not make the market form pivots."
This indicator includes enhancements made to the Gann Square of Nine indicator originally created by @ThiagoSchmitz.
This indicator is inspired by the methodologies detailed by Patrick Mikula in his book " The Definitive Guide to Forecasting using W.D Gann's Square of Nine ." I recommend checking it out. He also mentions another use case as a Price and Time chart in his " Gann Scientific Method Unveiled, Volume 2 ." FYI, I am not affiliated with Patrick Mikula in any way.
Known Issues:
Close price plotted on the Square of Nine in Regression "from a high pivot" takes a current candle to close in order to be plotted. Progression works as expected.

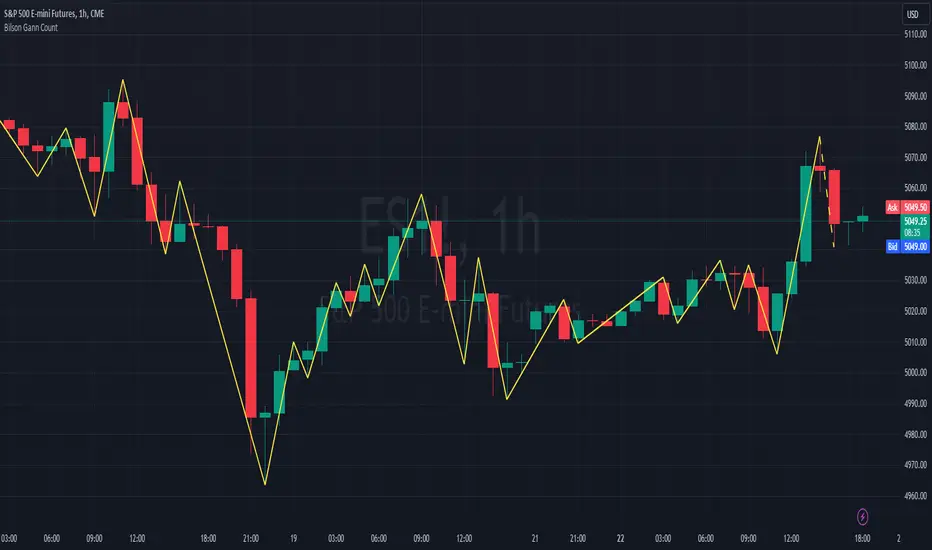
Bilson Gann CountGann counting is a method for identifying swing points,trends, and overall market structure. It simplifies price action by drawing short trend lines that summarize moves.
There's essentially 4 types of bar/candle.
Up bar - Higher high and higher low than previous bar
Down bar - Lower high and lower low than previous bar
Inside bar - Lower high and higher low than previous bar
Outside bar - Higher high and lower low than previous bar
We use these determinations to decide how the trendline moves through the candles.
Up bars we join to the high, down bars we join to the low, inside bars are ignored.
There are other indicators that already exist which do this, the difference here is how we handle outside bars.
Other gann counting methods skip outside bars, this method determines how to handle the outside bar after the outside bar is broken.
examples
UP -> OUTSIDE -> UP = Outside bar treated as swing low
UP -> OUTSIDE -> DOWN = Outside bar treated as swing high
DOWN -> OUTSIDE -> UP = Outside bar treated as swing low
DOWN -> OUTSIDE -> DOWN = Outside bar treated as swing high
Gann toolbox - Custom boxGann toolbox - Custom box
█ OVERVIEW
This script is designed to draw Gann boxes based on pivotal levels. It is made make it easy by being interactive where you do not have to input data manually but rather select your two points right after adding the script by clicking on the levels on the chart itself.
In addition, this script has some great features, such as the ability to select the number of divisions wanted up to three with a click from the menu and to adjust the end date based on the selected pivotal level. Not to mention that you can automatically add a follow-up box right after
The divisions included are the one division ( at 50% ), the two divisions ( at .333% and 666% ), and finally the three divisions ( at 25%, 50%, and 75% ).
You can also display the golden ration in Time and Price on your box when it's on the one division setting.
When choosing a different end point you're presented with 4 options for using your 2nd point as :
- 25% of the box
- 50% of the box
- 33 days total size box ( for lower time frame trading )
- 45 days total size box.
You can enable/disable multiple lines using the styling options.
█ Future Plans and upgrades to this script may include :
1. Box current volume.
2. Stat information box.
and more! feel free to let me know what you'd like to see!
█ How to use :
1. Put the script on your chart
2. You are going to be asked to select your first pivotal level, then your second pivotal level. Simply select them by clicking on the level on the chart.
give the script a few seconds and you should be set.

Gann's square of 9 overextended indicatorThis indicator is inspired by the book “The Definitive Guide to Forecasting Using W.D. Gann’s Square of Nine”. It’s designed to identify overextended price levels in the market.
The indicator uses the concept of Gann’s Square of 9, which is a method for forecasting price movements by observing geometric relationships between price and time. It calculates the square root of the price, then subtracts the square root of a simple moving average of the price. The difference is then converted to degrees to create the indicator values.
The indicator plots four horizontal lines, representing two upper and two lower thresholds. When the indicator crosses these lines, it suggests that the price may be overextended and a reversal could be imminent.
Please note that the Price Multiplier parameter needs to be adjusted for each timeframe and security to ensure accurate results. This is because different securities and timeframes can have different price scales, and the multiplier helps to normalize the price data for the calculation.
The indicator also includes a Moving Average Size parameter, which determines the length of the simple moving average used in the calculation.
This indicator can be a useful tool for traders looking to identify potential reversal points in the market. However, like all indicators, it should be used in conjunction with other forms of analysis and it’s not recommended to rely solely on this indicator for trading decisions.


Gann CalculatorThis indicator plots gann levels.
Go to settings and enter the latest gann level.
Enjoy..

RT - GANNGann relied heavily on geometrical and numerical relationships
and created several tools to help with his work. Among these
tools are the Square of Nine, Square of 144, and the Hexagon.
The Square of Nine, or Square as we will refer to here, can be
constructed in at least two ways. The static Square has the
number 1 at the center and the dynamic Square has the historic
low of the time series in the center.
EVERY 1 HOUR GANN CHANGE THE LAVELS ,ITS BASED ON CLOSE PRICE

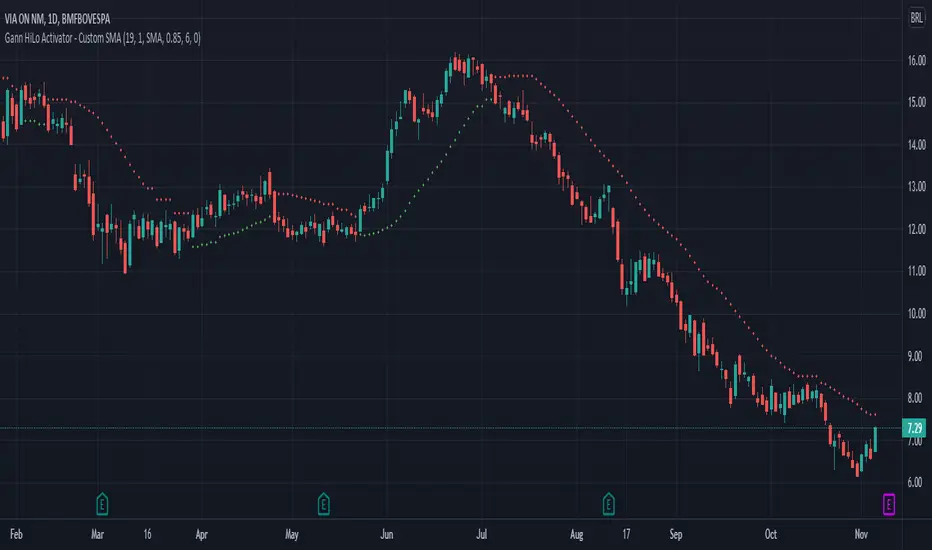
Gann HiLo ActivatorThe HiLo Activator study is a trend-following indicator introduced as part of the Gann Swing trading strategy. In addition to indicating the current trend direction, this can be used as both entry signal and trailing stop.
There are many scripts already published for this indicator, but I've found they didn't match the original one.
So here it is the Gann HiLo Activator as originally developed by Robert Krausz, in a 1998 article in the Stocks & Commodities magazine.
I've also added the option to select the type of Moving Average you would like to use.
Hope you enjoy!
Gann Square 9 Price Line Helper (Experimental)This indicator was intended as educational purpose only for Gann Square 9, specifically to show Cross and Cross Cardinal.
This indicator was build upon The Tunnel Thru The Air Or Looking Back From 1940, written by WD Gann .
Values shown is theoretical for basic understanding and may not represent actual market trend.
This pine script for educational purpose as basic understanding only, not recommend for actual trade and use at your on risk.
Indicator features :
1. Font size for table from tiny to huge.
2. Table can change position or hide.
2. For desktop display only, not for mobile.
3. All values can be selected individually or group to display individual or group lines and labels.
FAQ
1. Credits
WD Gann , The Tunnel Thru The Air Or Looking Back From 1940
2. Page involved
195 - 198
3. Code Usage
Free to use for personal usage.

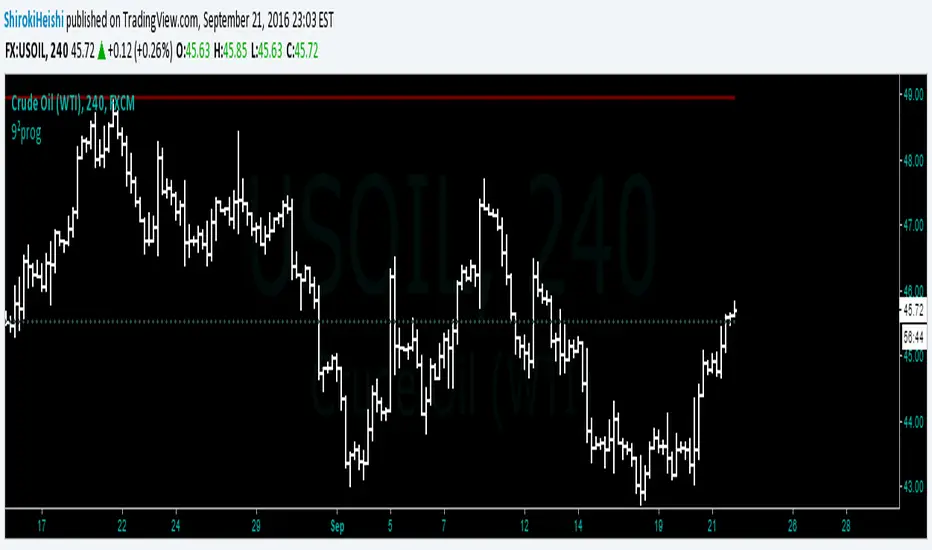
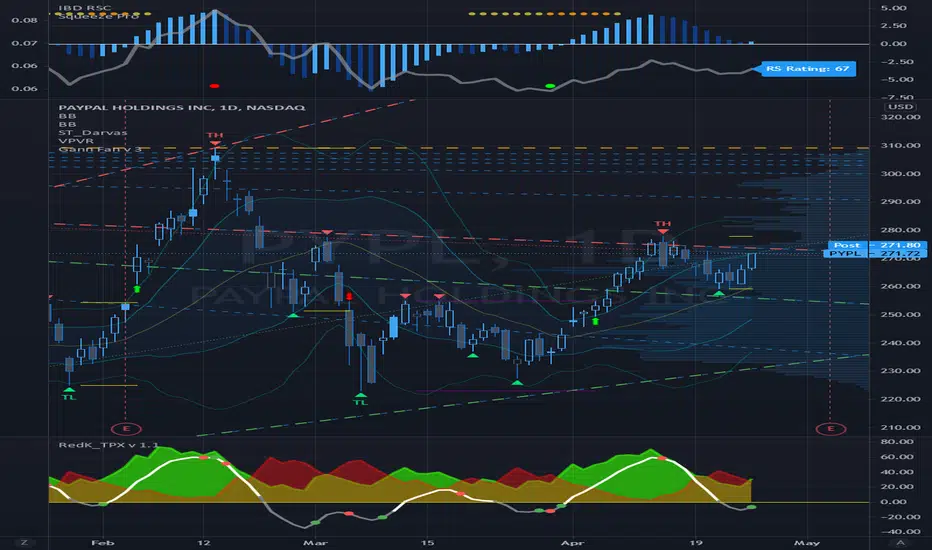
Gann Fan Analysis v 3.0The openness of this community is amazing and I have gained a lot from being a member. Hopefully you think this is useful so I can give something back.
This indicator constructs a reference framework of Support and Resistance levels based on Gann Fan ratios. Two fans are created: Support or Bullish fan, and a Resistance or Bearish fan. The origin of the analysis is the lowest pivot in the analysis window set by the length input. The upper bound of the analysis is the highest pivot in the analysis window. This is the only user input that affects the fan calculation. The remaining user input controls the visualization of the fans. The fan calculations are updated as the high and low within the analysis window change. The resistance fan range is based on an assumed 70% retracement.
Indicator also highlights the active Support and Resistance lines of each fan. An alert is also included, based on the price crossing one of these active levels.
Currently I can't figure out how to get the analysis to extend beyond 278 or so bars (not sure what the limitation is) so it isn't really useful for intraday timeframes, but it is reliable on daily and above. I use it on a Weekly view with the analysis length set to 52, and on a daily timeframe with the length set to 260.
I included fractal visualization using Ricardo Santos' Fractals v9 script as a means of confirming the Gann Fan pivots. The two methods seems to correlate well, in my opinion.
The coding is terrible, I'm sure, so please overlook that as this my first complex effort. I'm a total amateur!
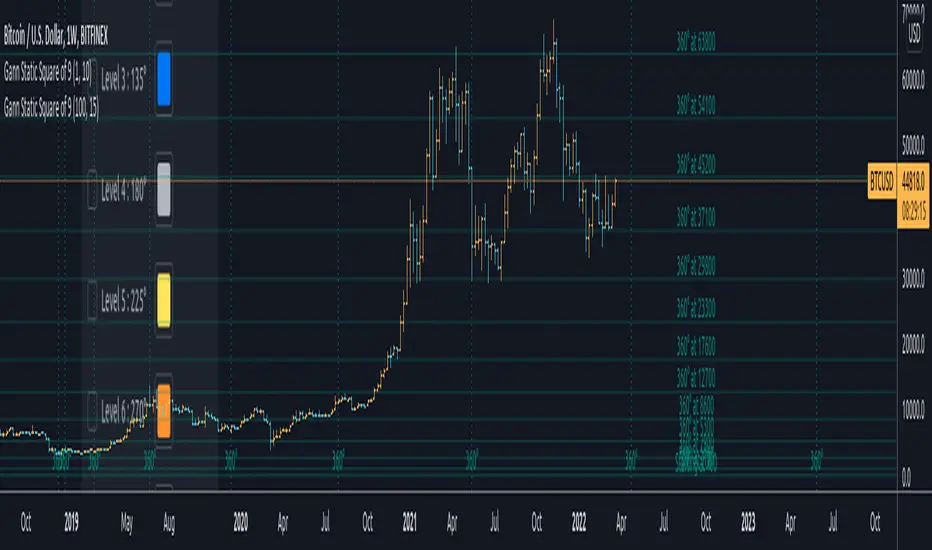
Gann Static Square of 9Gann Static Square of 9
// ========================================================================//
This script uses the same number series in the square of nine chart. It plots them according to the degree of your choosing. It includes ( 360, 315, 270, 225, 180, 135, 90, and 45 )
This static square of 9 is different than the dynamic one. The values always start at one rather than a low or a high of your choosing. All that you have to do is adjust the Price Unit and select your desired number of revolutions.
You will also be able to adjust the color of each line to differentiate between them.
This script also complements the Gann ToolBox that I have on my tradingview page giving you good measurement of the market and some of its volatility dates and locations in price.
// ========================================================================//
To get access to this add-on or for the full package including the toolbox you can see my information below.
Gann Cycle IndicatorVersion "Beta 1.0.0"
The "Gann Cycle Indicator" helps you analyze market cycles, from the smaller ones to the bigger ones. It requires you to know how Gann used market cycles to trade efficently. It helps predict where to expect a minum or a maximum and where to expect the start of a new cycle. It works with any market and can be set up as you prefer. It takes some inputs to work properly:
1) Starting X: this is the offset on the X axis where all the cycles start from. Once you applied this indicator on your graph, you must adjust the starting position to match the start of the cycle you found on the graph.
2) Cycles (1 to 4). These are the period, expressed in candles number, of each cycles. "Cycle 1" (i.e 3,25 days) should be the smaller of the 4 while "Cycle 4" the bigger one (i.e 15 days).
In this example, we trade BTCUSD on the 15 days cycle, so 15 days on the graph is composed of 360 candles. Our bigger cycle (Cycle 4) take 360 as period. For simplicity, "Cycle 3 to 1" take each time half of the period so: Cycle 3 -> 180, Cycle 2-> 90, Cycle 1 (smaller) -> 45.
3) Trend. 0 to a rectangle trend, -1 for bearish trend and 1 for a bullish trend .
4) Trend strength. From 0 to 2, step 0.1
This parameter expresses the strength of the trend. In a bullish market (Trend set to 1) you can set Trend strength from 0 to 2 to allow the indicator to follow the current market trend
Note:
This indicator must be put in a separate Y axis so it can overaly the graph.
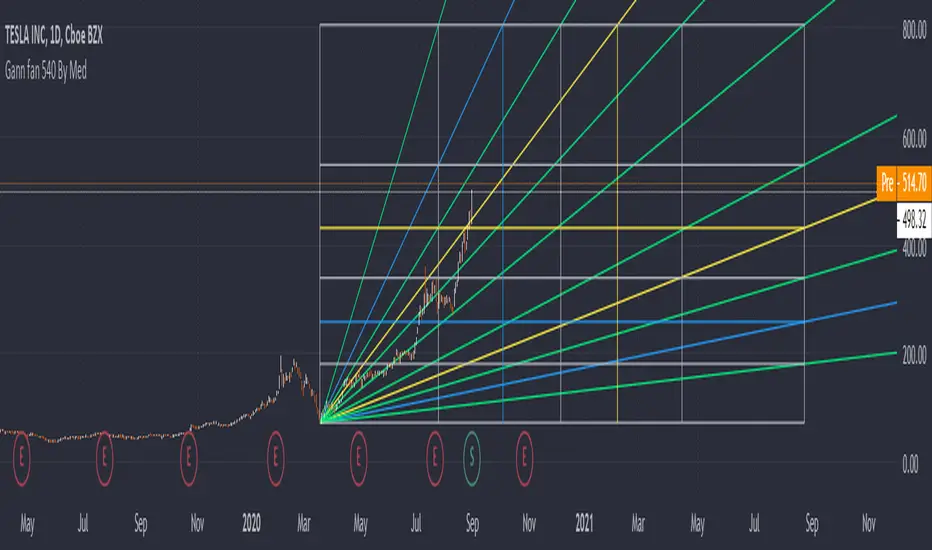
Gann Fan 540 By MedHello All,
This indicator is about Gann Fan, it consists of angled lines that are drawn above and below a central 45-degree line to help determine trend direction and strength, based on the idea that the market is geometric and cyclical in nature.
In this indicator we use Gann methods of calculations along with some Fibonacci series.
* The indicator projects different lines into the future to help predict future price changes
* Total control of line coloring and styles!
This is a paid indicator, Only available to the 540 R&D team, and 540 Group
(Use the links below to contact me for more information about how you can obtain access to this indicator
Good luck!
Gann Box 540 By MedHello All,
Using a Gann angles to forecast support and resistance is one of the most effective ways used by traders, in this indicator we cover the Gann Box, using Gann methods in calculating price and time levels, it can be customized with your chosen angle and time periods, it is also multi-timeframe and can be fixed on one time-frame and used across all others.
* The indicator projects different lines into the future to help predict future price changes
* Total control of line coloring and line styles!
This is a paid indicator, Only available to the 540 R&D team, and 540 Group
(Use the links below to contact me for more informations about how you can obtain access to this indicator
Good luck!

Gann BreakoutEverything here is for educational purpose. Kindly trade at your own risk.
• This indicator is based on Gann level .
• It is used only for intraday trading in Banknifty .
• Prefer Time frame would be 5mins/10mins/15mins. according to your risk ratio.
• Trade after 9:40am let market gets settle.
• Look for the breakout of the Green(for buy entry) and Red(for sell entry) line for entry.
• Price action also required as targets are more than 100 points. Set your targets and trade on breakout.
You will notice that candles are retracing on the targets line because those targets are gann imp levels.
So if target 1 breaks you can trail your SL till next target.
Trade safe !!
thank you for using the indicator.
Any more ideas to make this indicator more powerful please let me know.
Suggestion are always welcome !!!

Gann SwingPlot nearest Gann number of any instruments.
Next gann number is updated in chart when the price nearing it

Gann Fan AutomaticAutomatic Gann fan indicator. Works on all charts and time frames.
The idea was to create this indicator so as not to rearrange the Gann fan.
It is good to navigate the lines as resistance and support.
The settings consist of two parameters.
1 this is for the calculation from the local high.
2 for the calculation from the local Low.
Gann ProgressionsThis is my attempt at progressions along the Gann wheel. Theoretically this script advances a numeral 45 degrees along the square of nine. The degree chosen (negative for bearish projections) can of course be customized and further subdivided as per your needs, but there is a slight flaw in the calculations that I am asking the community to take a look at, hopefully you all can give me a hand here. While the majority of the figures are correct, there seems to be some very slight discrepancies in the prices projected. If you are a Gann user, then you know how accurate they can be and as such, the discrepancies are not tolerable. Take a peek and let me know what you see that I am missing. Hope this script becomes helpful for all users.