Gann FanHello All,
For long time I have been getting many requests about Gann Fan indicator. now we have linefill() function in Pine Language and I think it's right time to make Gann Fan Indicator. Many Thanks to Pine Team for adding many new features to the Pine Language!
How this indicator works:
- It calculates midline (1/1)
- By using midline it calculates other lines (1/2, 1/3, 1/4...etc)
- It calculates highest/lowest Pivot Points in last 280 bars.( by default it's 280 bars, you can change it and pivot period )
- It checks the location of highest/lowest Pivot Points
- After the calculation of the Gann Fan lines, it draws lines, puts Labels and paints the zones between the lines according to the colors set by the user
Long time ago I created a special algorithm for calculating the line with 45 degree and I used it for "1/1" line. Anybody who needs it can use this algorithm freely ;)
Options:
You can change following items;
- The colors
- Transparency. Possible values for transparency are from 0 (not transparent) to 100 (invisible)
- Line styles
- Loopback Period (by default it's 280)
- Pivot Period (by default it's 5)
- Enable/disable Labels
- Label location (by default it's 50
Tradingview Gann Fan page : The Gann Fan is a technical analysis tool created by WD Gann. The tool is comprised of 9 diagonal lines (extending indefinitely) designed to show different support and resistance levels on a chart. These angles -drawn from main tops and bottoms- divide time and price into proportionate parts and are often used to predict areas of support and resistance, key tops and bottoms and future price moves. Please note that the chart needs to be scaled properly to ensure the market has a square relationship....
Enjoy!
"gann" için komut dosyalarını ara

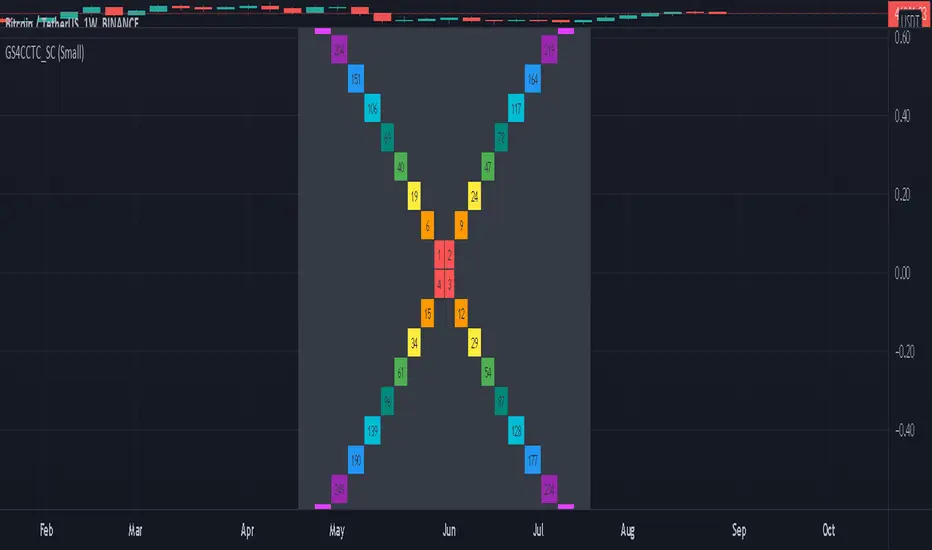
Love.Gunfire - Giant All For One 巨人VIPGiant is All For One , the Last special version for all markets, optimized by Love.Gunfire from Gann. Each one contains natural numbers. If you want to know the recent support. resistance and trends, read on.
Only disciples who have learned "Giant Weapons" can select VIPs to use and the version will be continuously updated.
There the usage settings:
Enable/Disable signals on chart
Enable/Disable XTV based on trend
Enable/Disable label code to smart trade
How does it work?
Basic usage
After the small/medium giant appears BUY, and above T line, may be you can consider the operation of buying
After the small/medium giant appears SELL, and below T line, may be you can consider the operation of selling
What are the signals?
Advanced usage
The small/medium giant cooperates with the giant weapon operation to confirm the upward trend and consider buying
The small/medium giant cooperates with the giant weapon operation to confirm the downward trend and consider selling
For giants to operate, no matter how to make any transaction, they must have the mind of "continuing to stop making profits is the emperor's way, and strictly guarding against erosion is a virtue."
Want to get this indicator today!
For access, please DM us or visit the link/Telegram below in our Signature.
Contact: Love.Gunfire
US30 CURRENCYCOM:US30
GOLD OANDA:XAUUSD
HKEX:700
FX:EURUSD
BINANCE:BTCUSDT
--------------------------------------------------------------------------------------------
巨人是結合天地為一。特別的版本可以應用全球商品,是由彥暉從江恩中使用八多年來優化而來,每一個都含有自然的數字,如果想知道近來的支持、阻力和趨勢,一定不可錯過。
更新設定方法 :
開啟/關閉 訊號
開啟/關閉 XTV趨勢
開啟/關閉 數字
如何使用?
基本使用方法 :
待小/中巨人出現BUY後配合T線以上 ,可考慮買入的操作動作。
待小/中巨人出現SELL後配合T線以下,可考慮沽空的操作動作。
訊號是什麼?
進階使用方法 :
小/中巨人配合巨人兵器操作,確認向上的趨勢可考慮買入。
小/中巨人配合巨人兵器操作,確認向下的趨勢可考慮沽空。
暫時只開放給「巨人兵器」的弟子和特選VIP使用,版本會持續更新。
巨人操作,無論做任何交易,必須要有「不斷止賺是皇道,嚴守止蝕是美德。」的心思。
立刻行動,良機勿失 !
想獲取權限,請給本族訊息或訪問Telegram,本族簽名中的以下鏈接。
請聯絡 : Love.Gunfire
US30 CURRENCYCOM:US30
GOLD OANDA:XAUUSD
HKEX:700
FX:EURUSD
BINANCE:BTCUSDT

Gann Square 4 Cross Cardinal Table ConceptThis indicator was intended as educational purpose only for Gann Square 4, specifically to show Cross Cardinal.
This indicator was build upon The Tunnel Thru The Air Or Looking Back From 1940, written by WD Gann.
Gann Square 4 is similar to Gann Square 9 (Refer this build) but limited to Cross Cardinal only.
Indikator ini bertujuan sebagai pendidikan sahaja untuk Gann Square 4, khusus untuk menunjukkan Cross Cardinal.
Indikator ini dibina berdasarkan buku The Tunnel Thru The Air Or Looking Back From 1940, ditulis oleh WD Gann.
Gann Square 4 hampir sama dengan Gann Square 9 (Rujuk binaan ini) tetapi terhad kepada Cross Cardinal sahaja.
Indicator features :
1. Font size from tiny to huge.
2. For desktop display only, not for mobile.
3. All values can be selected individually.
Kemampuan indikator :
1. Saiz font dari paling kecil ke paling besar.
2. Untuk paparan desktop sahaja, bukan untuk mobile.
3. Semua nilai boleh dipilih secara individu.
FAQ
1. Credits / Kredit
WD Gann , The Tunnel Thru The Air Or Looking Back From 1940
Ganzilla
2. Page involved / Muka Surat terlibat
195 - 198
3. Code Usage / Penggunaan Kod
Free to use for personal usage.
Bebas untuk kegunaan peribadi.
Left : All values off / Kiri : Semua nilai off
Right : All values on / Kanan : Semua nilai on
Left : Random Usage / Kiri : Kegunaan Random
Right : Ideal Usage / Kanan : Kegunaan Ideal
Gann + Laplace Smoothed Hybrid Volume Spread Analysis Indicator
This Indicator stands apart by integrating the principles of the upgraded Discrete Fourier Transform (DFT), the Laplace Stieltjes Transform and volume spread analysis, enhanced with a layer of Fourier smoothing to distill market noise and highlight trend directions with unprecedented clarity.
The length of EMA and Strategy Entries are modified with the Gann swings.
This smoothing process allows traders to discern the true underlying patterns in volume and price action, stripped of the distractions of short-term fluctuations and noise.
The core functionality of the GannLSHVSA revolves around the innovative combination of volume change analysis, spread determination (calculated from the open and close price difference), and the strategic use of the EMA (default 10) to fine-tune the analysis of spread by incorporating volume changes.
Trend direction is validated through a moving average (MA) of the histogram, which acts analogously to the Volume MA found in traditional volume indicators. This MA serves as a pivotal reference point, enabling traders to confidently engage with the market when the histogram's movement concurs with the trend direction, particularly when it crosses the Trend MA line, signalling optimal entry points.
It returns 0 when MA of the histogram and EMA of the Price Spread are not align.
WHAT IS GannLSHVSA INDICATOR:
The GannLSHVSA plots a positive trend when a positive Volume smoothed Spread and EMA of Volume smoothed price is above 0, and a negative when negative Volume smoothed Spread and EMA of Volume smoothed price is below 0. When this conditions are not met it plots 0.
ORIGINALITY & USEFULNESS:
The GannLSHVSA Strategy is unique because it applies upgraded DFT, the Laplace Stieltjes Transform for data smoothing, effectively filtering out the minor fluctuations and leaving traders with a clear picture of the market's true movements. The DFT's ability to break down market signals into constituent frequencies offers a granular view of market dynamics, highlighting the amplitude and phase of each frequency component. This, combined with the strategic application of Ehler's Universal Oscillator principles via a histogram, furnishes traders with a nuanced understanding of market volatility and noise levels, thereby facilitating more informed trading decisions. The Gann swing strategy is developed by meomeo105, this Gann high and low algorithm forms the basis of the EMA modification.
DETAILED DESCRIPTION:
My detailed description of the indicator and use cases which I find very valuable.
What is the meaning of price spread?
In finance, a spread refers to the difference between two prices, rates, or yields. One of the most common types is the bid-ask spread, which refers to the gap between the bid (from buyers) and the ask (from sellers) prices of a security or asset.
We are going to use Open-Close spread.
What is Volume spread analysis?
Volume spread analysis (VSA) is a method of technical analysis that compares the volume per candle, range spread, and closing price to determine price direction.
What does this mean?
We need to have a positive Volume Price Spread and a positive Moving average of Volume price spread for a positive trend. OR via versa a negative Volume Price Spread and a negative Moving average of Volume price spread for a negative trend.
What if we have a positive Volume Price Spread and a negative Moving average of Volume Price Spread?
It results in a neutral, not trending price action.
Thus the Indicator/Strategy returns 0 and Closes all long and short positions.
I suggest using "Close all" input False when fine-tuning Inputs for 1 TimeFrame. When you export data to Excel/Numbers/GSheets I suggest using "Close all" input as True, except for the lowest TimeFrame. I suggest using 100% equity as your default quantity for fine-tune purposes. I have to mention that 100% equity may lead to unrealistic backtesting results. Be avare. When backtesting for trading purposes use Contracts or USDT.
6 days ago
Release Notes

Gann Square 9 Cross Cardinal Table ConceptThis indicator was intended as educational purpose only for Gann Square 9, specifically to show Cross and Cross Cardinal.
This indicator was build upon The Tunnel Thru The Air Or Looking Back From 1940, written by WD Gann.
Indikator ini bertujuan sebagai pendidikan sahaja untuk Gann Square 9, khusus untuk menunjukkan Cross dan Cross Cardinal.
Indikator ini dibina berdasarkan buku The Tunnel Thru The Air Or Looking Back From 1940, ditulis oleh WD Gann.
Indicator features :
1. Font size from tiny to huge.
2. For desktop display only, not for mobile.
3. All values can be selected individually.
Kemampuan indikator :
1. Saiz font dari paling kecil ke paling besar.
2. Untuk paparan desktop sahaja, bukan untuk mobile.
3. Semua nilai boleh dipilih secara individu.
FAQ
1. Credits / Kredit
WD Gann, The Tunnel Thru The Air Or Looking Back From 1940
Ganzilla
2. Page involved / Muka Surat terlibat
195 - 198
3. Code Usage / Penggunaan Kod
Free to use for personal usage.
Bebas untuk kegunaan peribadi.
Left : All values off / Kiri : Semua nilai off
Right : All values on / Kanan : Semua nilai on
Left : All Cross / Kiri : Semua Cross
Right : All Cross Cardinal/ Kanan : Semua Cross Cardinal
Left : Random Usage / Kiri : Kegunaan Random
Right : Ideal Usage / Kanan : Kegunaan Ideal

GannLSVZO Indicator [Algo Alert]The Volume Zone oscillator breaks up volume activity into positive and negative categories. It is positive when the current closing price is greater than the prior closing price and negative when it's lower than the prior closing price. The resulting curve plots through relative percentage levels that yield a series of buy and sell signals, depending on level and indicator direction.
The Gann Laplace Smoothed Volume Zone Oscillator GannLSVZO is a refined version of the Volume Zone Oscillator, enhanced by the implementation of the upgraded Discrete Fourier Transform, the Laplace Stieltjes Transform. Its primary function is to streamline price data and diminish market noise, thus offering a clearer and more precise reflection of price trends.
By combining the Laplace with Gann Swing Entries and Exits (orange X) and with Ehler's white noise histogram, users gain a comprehensive perspective on volume-related market conditions.
HOW TO USE THE INDICATOR:
The default period is 2 but can be adjusted after backtesting. (I suggest 5 VZO length and NoiceR max length 8 as-well)
The VZO points to a positive trend when it is rising above the 0% level, and a negative trend when it is falling below the 0% level. 0% level can be adjusted in setting by adjusting VzoDifference. Oscillations rising below 0% level or falling above 0% level result in a natural trend.
ORIGINALITY & USFULLNESS:
Personal combination of Gann swings and Laplace Stieltjes Transform of a price which results in less noise Volume Zone Oscillator.
The Laplace Stieltjes Transform is a mathematical technique that transforms discrete data from the time domain into its corresponding representation in the frequency domain. This process involves breaking down a signal into its individual frequency components, thereby exposing the amplitude and phase characteristics inherent in each frequency element.
This indicator utilizes the concept of Ehler's Universal Oscillator and displays a histogram, offering critical insights into the prevailing levels of market noise. The Ehler's Universal Oscillator is grounded in a statistical model that captures the erratic and unpredictable nature of market movements. Through the application of this principle, the histogram aids traders in pinpointing times when market volatility is either rising or subsiding.
The Gann swings and the Gan swing strategy is developed by meomeo105, this Gann high and low algorithm forms the basis of the EMA modification.
DETAILED DESCRIPTION:
My detailed description of the indicator and use cases which I find very valuable.
What is oscillator?
Oscillators are chart indicators that can assist a trader in determining overbought or oversold conditions in ranging (non-trending) markets.
What is volume zone oscillator?
Price Zone Oscillator measures if the most recent closing price is above or below the preceding closing price.
Volume Zone Oscillator is Volume multiplied by the 1 or -1 depending on the difference of the preceding 2 close prices and smoothed with Exponential moving Average.
What does this mean?
If the VZO is above 0 and VZO is rising. We have a bullish trend. Most likely.
If the VZO is below 0 and VZO is falling. We have a bearish trend. Most likely.
Rising means that VZO on close is higher than the previous day.
Falling means that VZO on close is lower than the previous day.
What if VZO is falling above 0 line?
It means we have a high probability of a bearish trend.
Thus the indicator returns 0 and Strategy closes all it's positions when falling above 0 (or rising bellow 0) and we combine higher and lower timeframes to gauge the trend.
What is approximation and smoothing?
They are mathematical concepts for making a discrete set of numbers a
continuous curved line.
Laplace Stieltjes Transform approximation of a close price are taken from aprox library.
Key Features:
You can tailor the Indicator/Strategy to your preferences with adjustable parameters such as VZO length, noise reduction settings, and smoothing length.
Volume Zone Oscillator (VZO) shows market sentiment with the VZO, enhanced with Exponential Moving Average (EMA) smoothing for clearer trend identification.
Noise Reduction leverages Euler's White noise capabilities for effective noise reduction in the VZO, providing a cleaner and more accurate representation of market dynamics.
Choose between the traditional Fast Laplace Stieltjes Transform (FLT) and the innovative Double Discrete Fourier Transform (DTF32) soothed price series to suit your analytical needs.
Use dynamic calculation of Laplace coefficient or the static one. You may modify those inputs and Strategy entries with Gann swings.
I suggest using "Close all" input False when fine-tuning Inputs for 1 TimeFrame. When you export data to Excel/Numbers/GSheets I suggest using "Close all" input as True, except for the lowest TimeFrame. I suggest using 100% equity as your default quantity for fine-tune purposes. I have to mention that 100% equity may lead to unrealistic backtesting results. Be avare. When backtesting for trading purposes use Contracts or USDT.

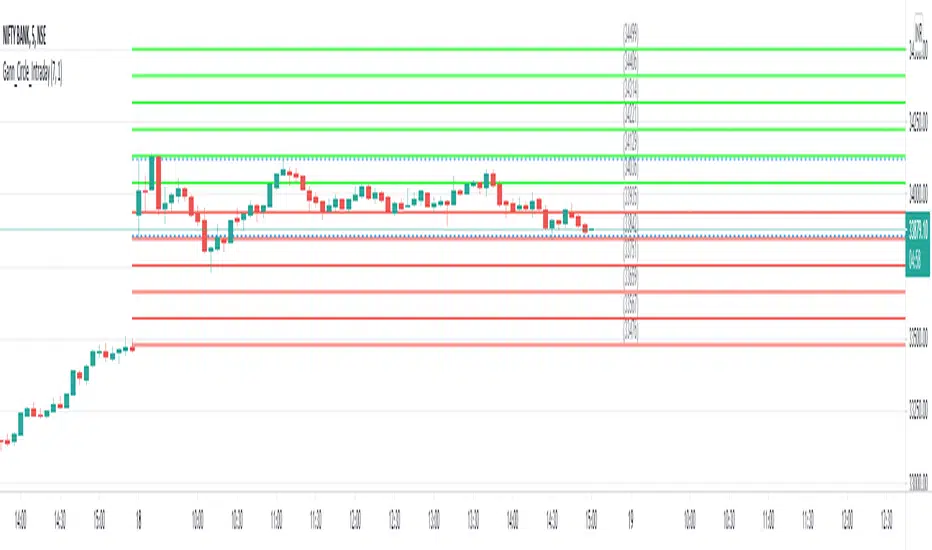
Gann Square of 9 Daily LevelsThis indicator is based on the square of 9 methods designed by Mr. WD Gann. This indicator is written at the request of dear Sudip in the comments. This indicator is based on the open price of the day. Four levels of dynamic support and resistance are drawn based on the method of Gann. It is also possible to display 50% of the distances between these levels. The coefficient number can also vary based on the symbol. For example, for the NIFTY we can use the number 0.1, and for BTCUSDT we can use 0.01. This number must be able to match the levels obtained with the price movement with its symbol. Break or pullback of each level is the same as the resistance support levels, except that it is drawn for each day.

Geometric Price-Time Triangle Calculator═══════════════════════════════════════════════════
GEOMETRIC PRICE-TIME TRIANGLE CALCULATOR
═══════════════════════════════════════════════════
Calculates Point C of a geometric triangle using different rotation angles from any selected price swing. Based on Bradley F. Cowan's Price-Time Vector (PTV) methods from "Four-Dimensional Stock Market Structures and Cycles."
📐 WHAT IT DOES
────────────────────────────────────────────────────
Select two points (A and B) on any swing, choose an angle, and the indicator calculates where Point C would be mathematically. It's just vector rotation applied to price charts.
This shows you where Point C lands in both price AND time based on pure geometry - not a prediction, just a calculation.
🎯 FEATURES
────────────────────────────────────────────────────
✓ 10 Different Angles
• Gann ratios: 18.435° (1x3), 26.565° (1x2), 45° (1x1), 63.435° (2x1), 71.565° (3x1)
• Other angles: 30°, 60°, 90°, 120°, 150°
✓ Visual Triangle
• Adjustable colors and opacity for points A, B, C
• Line styles: Solid, Dashed, Dotted
• Extend lines: None, Left, Right, Both
✓ Crosshair at Point C
• Shows where Point C is located
• Vertical line = bar position
• Horizontal line = price level
✓ Data Table
• Shows all calculations
• Price-to-Bar ratio
• Point C location (price and bars from A/B)
• Toggle on/off
🔧 HOW TO USE
────────────────────────────────────────────────────
1. Pick your swing start date (Point A)
2. Pick your swing end date (Point B) - make sure these dates capture the actual high/low of your swing
3. Choose an angle from the dropdown
4. Look at Point C - that's where the geometry puts it
Different angles = different Point C locations. Whether price actually goes there is up to the market.
📊 THE ANGLES
────────────────────────────────────────────────────
- 18.435° (1x3) - Shallow rotation
- 26.565° (1x2) - Moderate rotation
- 45° (1x1) - Gann's balanced ratio
- 60° - Equilateral triangle (default)
- 63.435° (2x1) - Steeper rotation
- 71.565° (3x1) - Very steep rotation
- 90° - Right angle
- 120°-150° - Obtuse angles
💡 PRACTICAL USE
────────────────────────────────────────────────────
→ See where geometric patterns would complete
→ Test if your market respects certain angles
→ Find where multiple angles converge
→ Compare projected Point C to actual price action
→ Use 90° to see symmetrical price/time relationships
→ Backtest historical swings to see what worked
⚙️ HOW IT WORKS
────────────────────────────────────────────────────
1. Takes your AB swing
2. Calculates the BA vector (reverse direction)
3. Normalizes price and time using Price-to-Bar ratio
4. Rotates the vector by your selected angle
5. Converts back to chart coordinates
Basic trigonometry. That's all it is.
📚 BACKGROUND
────────────────────────────────────────────────────
Based on Bradley F. Cowan's Price-Time Vector (PTV) concept from "Four-Dimensional Stock Market Structures and Cycles" and W.D. Gann's geometric angle analysis. Cowan observed that markets sometimes complete geometric patterns. This tool calculates where those patterns would complete mathematically. Whether price actually respects these geometric relationships is something you need to test yourself.
⚠️ IMPORTANT
────────────────────────────────────────────────────
- This is geometric calculation, not prediction
- Point C shows where the math puts it, not where price will go
- Some angles might work for your market, some won't
- Test it yourself on historical data
- Price-to-Bar Ratio stays constant regardless of angle
- Don't trade based on this alone
- Works on all timeframes and assets
🎨 CUSTOMIZATION
────────────────────────────────────────────────────
- Show/hide triangle
- Individual colors for A, B, C points
- Adjust opacity (0-100)
- Line styles for each triangle side
- Extend lines left/right/both/none
- Show/hide data table
- Crosshair color and width
- Customizable table colors
═══════════════════════════════════════════════════

Gann & Fibonacci Analysis for MSTRYes! Below is a step-by-step guide to performing Gann Analysis on MSTR in TradingView for the last year.
Step 1: Set Up the Chart
Open TradingView and search for MSTR (MicroStrategy).
Select the 1-day (D) timeframe to analyze the past year.
Set your chart to logarithmic scale (⚙ Settings → Scale → Log).
Enable grid lines for alignment (⚙ Settings → Appearance → Grid Lines).
Step 2: Identify Key Highs and Lows (Last Year)
Find the 52-week high and 52-week low for MSTR.
As of now:
52-Week High: ~$999 (March 2024).
52-Week Low: ~$280 (October 2023).
Step 3: Plot Gann Angles
Using TradingView's Gann Fan Tool:
Select "Gann Fan" (Press / and type “Gann Fan” to find it).
Start at the 52-week low (~$280, October 2023) and drag upwards.
Adjust the angles to match key levels:
1x1 (45°) → Main trendline
2x1 (26.5°) → Strong uptrend
4x1 (15°) → Weak trendline
1x2 (63.75°) → Strong resistance
Repeat the process from the 52-week high (~$999, March 2024) downward to see bearish angles.
Step 4: Apply Fibonacci & Gann Retracement Levels
Using Fibonacci Retracement:
Select "Fibonacci Retracement" tool.
Draw from 52-week high ($999) to 52-week low ($280).
Enable key Fibonacci levels:
23.6% ($816)
38.2% ($678)
50% ($640)
61.8% ($550)
78.6% ($430)
Watch for price reactions near these levels.
Using Gann Retracement Levels:
Select "Gann Box" in TradingView.
Draw from 52-week high ($999) to low ($280).
Enable key Gann retracement levels:
12.5% ($912)
25% ($850)
37.5% ($768)
50% ($640)
62.5% ($550)
75% ($480)
87.5% ($350)
Identify confluences with Gann angles and Fibonacci levels.
Step 5: Identify Significant Dates & Time Cycles
Use "Date Range" Tool in TradingView.
Mark major turning points:
High → Low: ~180 days (Half-year cycle).
Low → High: ~90 days (Quarter cycle).
Use Square-Outs (Time = Price method):
Example: If MSTR hit $500, check 500 days from key events.
Mark key anniversaries of past highs/lows for possible reversals.
Step 6: Analyze and Trade Execution
✅ If MSTR is at a Gann angle + Fibonacci level + key date → Expect a reaction.
✅ Use RSI, MACD, and Volume for extra confirmation.
✅ Set Stop-Loss at nearest Gann support/resistance.

Gann Breakout LevelsThe Complete Guide to Gann Breakout Levels Indicator
Introduction
Welcome to the comprehensive guide for the Gann Breakout Levels indicator. This powerful technical analysis tool combines traditional Gann mathematics with modern breakout detection, providing traders with a sophisticated approach to identifying market opportunities. Whether you're trading stocks, forex, cryptocurrencies, or commodities, this indicator offers valuable insights into price action and market structure.
Understanding the Core Functionality
The Gann Breakout Level indicator operates on two fundamental principles: Gann's mathematical framework and dynamic breakout detection. Here's a detailed breakdown of how it works:
Price Threshold System
The indicator utilizes 46 carefully calibrated threshold levels, ranging from 0.110 to 2.04. These thresholds serve as reference points for potential price movements and market structure analysis. Each level is designed to capture significant price action while filtering out market noise.
Signal Generation
- Upward Breakouts: When price action exceeds a threshold level, the indicator generates a green upward triangle above the candle.
- Downward Breaks: Following a breakout, if price retraces below the specified percentage (default 2.78%), a red downward triangle appears below the candle.
Configuration and Setup
Essential Settings
1. Show Gann Square Lines
- Purpose: Displays key price levels based on Gann mathematics
- Recommended: Enabled for most trading styles
2. Enable Line Extension
- Purpose: Projects price levels into the future
- Application: Useful for identifying potential support/resistance zones
3. Breakout Percentage Level
- Default: 2.78%
- Adjustable Range: 0.1% to custom value
- Impact: Determines sensitivity of breakdown signals
Trading Applications
Market Analysis Framework
The indicator provides three critical reference levels:
1. Upper Bound (Red Line)
- Primary resistance level
- Breakout confirmation zone
- Potential profit-taking area
2. Lower Bound (Red Line)
- Key support level
- Stop-loss reference point
- Breakdown confirmation zone
3. Mid Point (Blue Line)
- Equilibrium price level
- Partial profit-taking reference
- Trend direction confirmation
Trading Strategies
#### Swing Trading Approach
1. Entry Criteria
- Wait for green triangle signal
- Confirm with volume increase
- Verify overall trend alignment
- Check for supporting price action
2. Risk Management
- Place stops below nearest Gann level
- Use scaling techniques for position building
- Implement trailing stops based on Gann levels
#### Position Trading Method
1. Signal Identification
- Look for red triangle after established uptrend
- Confirm with price action patterns
- Verify volume characteristics
2. Position Management
- Set precise entry points at Gann levels
- Define clear stop-loss parameters
- Establish multiple profit targets
Timeframe Optimization
### Swing Trading
- Timeframes: 4-hour to daily charts
- Breakout Percentage: 2.78% to 3.5%
- Focus: Trend following and major support/resistance breaks
### Position Trading
- Timeframes: Daily and weekly charts
- Breakout Percentage: 3.5% to 4%
- Focus: Long-term trend identification and major market shifts
### Market Condition Adaptation
The indicator's threshold matrix automatically adjusts to:
- Trending markets
- Ranging conditions
- High volatility periods
- Low volatility environments
Best Practices
### Risk Management Guidelines
1. Position Sizing
- Limit risk to 1-2% per trade
- Scale positions based on conviction
- Adjust size based on volatility
2. Stop Loss Implementation
- Always use protective stops
- Base stops on Gann levels
- Consider volatility when setting stops
### Signal Validation
1. Primary Confirmation Factors
- Volume analysis
- Price action patterns
- Market structure
- Trend alignment
2. Secondary Confirmation Elements
- Multiple timeframe analysis
- Support/resistance levels
- Market sentiment
- Technical indicators
## Market Selection
- Most effective in liquid markets
- Optimal for major currency pairs
- Reliable for large-cap stocks
- Applicable to major cryptocurrency pairs
Recommended Trading Approach
### Swing Trading Setup
1. Use 4-hour and daily charts for primary analysis
2. Focus on major market moves
3. Hold positions for several days to weeks
4. Use wider stops to accommodate market volatility
### Position Trading Setup
1. Utilize daily and weekly charts
2. Focus on major trend changes
3. Hold positions for weeks to months
4. Base exits on trend reversal signals
## Performance Optimization
1. Regular Review
- Monitor win rate
- Track average profit per trade
- Analyze maximum drawdown
- Review position sizing effectiveness
2. Strategy Refinement
- Adjust parameters based on market conditions
- Fine-tune entry and exit rules
- Optimize position management
- Update risk parameters as needed
Conclusion
The Gann Breakout Levels indicator represents a sophisticated approach to market analysis, combining historical wisdom with modern technical analysis. It's particularly effective for swing and position trading, where its mathematical principles can best capture significant market moves. Success with this tool requires understanding its principles, proper configuration, and integration with a comprehensive trading strategy.
Remember that while this indicator provides valuable insights, it should be part of a broader trading strategy that includes proper risk management, market analysis, and disciplined execution. Consistent success comes from proper application of the tool's signals within a well-defined trading plan.
This indicator serves as a powerful addition to any trader's toolkit, providing objective entry and exit signals based on time-tested principles. With proper understanding and application, it can significantly enhance your trading decision-making process for longer-term trading approaches.

Gann BoxHello, friends. I want to introduce you to the Gann box indicator. Let me explain what it is and how to use it.
1. Dimensions:
- 1:1: A ratio of time to price, showing equilibrium between them.
- 1:2: A level where price moves twice as fast as time.
- 2:1: A level where time moves twice as fast as price.
- Additional ratios may include 1:4, 4:1, and others.
2. Key Elements:
- Levels: Lines that indicate key support and resistance levels.
- Time Frames: Used to forecast future price movements.
- Trend Analysis: Helps determine current trends and possible reversals.
3. Application:
- Traders use the Gann box to identify entry and exit points.
- Suitable for both short-term and long-term trading.
The Gann box has the following dimensions:
1. 52 Bars: Gann often used this dimension on the weekly timeframe, as there are 52 weeks in a year, making the box represent exactly one year.
2. 144 Bars: This was frequently used by Gann on the annual timeframe, as the square root of 144 is 12. There are 12 months in a year, 12 zodiac signs, and Jupiter's orbital period around the Sun is 12 years. All these factors strongly support the use of this dimension on this timeframe. However, this dimension performs well across all other timeframes, so feel free to use it anytime.
3. 360 and 90 Bars: These are universal sizes of the Gann box and can be applied at any time and on any timeframe.
In the indicator, you can adjust the size of the box using the "⚙️ Box Size" setting.
To start using this indicator, follow these steps:
1. Set the "Start" Marker: Place it at the beginning of the impulse, whether it’s an upward or downward movement.
2. Set the "End" Marker: Place it at the end of the impulse.
Once you have done this, the indicator will calculate the price step and the box will be constructed based on the size you selected earlier.
Let me show you how I identified the first impulse on BTC so you can understand me better:
This impulse was the first on the daily timeframe that determined the entire calculation of the box for the future.
After determining the impulse, the box was constructed. I used a box size of 144 bars as an example, but you might say that there are actually many more bars, why is that?
It's simple; the box can have derivatives of length and height. In the indicator, you can choose how many times you want to increase the height or length separately. Moreover, following Gann's methods and rules for constructing the box, there are no mistakes; this is the correct construction. In the indicator, the setting responsible for increasing the height is ⚙️ Height Increase, while the setting for increasing the length is ⚙️ Length Increase. However, everything is done according to the rules, and the increase in length and height occurs in fixed numbers: 1, 2, 4, 8, 16, 32.
This is done to make your analysis more flexible, while still adhering to all construction rules.
The indicator also provides the option to increase or decrease the price step. It is not always the case that the default calculated price step suits us. Therefore, I created the ability to decrease and increase it by as many times as the rules for constructing Gann's box allow. You can increase or decrease the price step by 1, 10, 100, and 1000 times, which also makes the box settings more flexible and suitable for any market and asset.
How to use this function correctly? First, we need to understand what we want to do with the price step. If we want to increase it, we switch the "⚙️ Multiply | Divide" mode to "Multiply." Now we need to change the value in the "⚙️ Multiplier | Price Step Divisor" mode to the desired amount. After these actions, the price step will be increased. Decreasing the price step occurs in a similar manner.
The Gann box can be oriented both upwards and downwards. The parameter "⚙️ Long | Short | Auto" determines the direction of the box construction. By default, the setting is "Auto." The indicator has logic that understands in which direction to build the box. However, if you encounter difficulties and the indicator selects the incorrect direction, you can force it to build the box in your desired direction by changing the setting from "Auto" to "Long" or "Short."
Let me show you an example of constructing the box downwards:
The indicator also includes a table that displays all the most important information about the box parameters in the upper right corner. This is designed to help avoid confusion during the use and analysis of the Gann box.
I have tried to make the box parameters as flexible as possible for you, and I have also done the same for the style settings. You can enable and disable corners, additional levels, the base of the box, and value labels separately. All these elements of the box can be customized by color to suit your visual preferences. The same can be done with the table that displays the data.
A little about additional levels, by the way. Additional levels are constructed based on the intersection points of the corners. Both price and time levels built on these intersections are also very important and work excellently. You can customize them or disable them completely through the indicator settings.
I wish you good luck using the indicator!

Gann Square 9GANN SQUARE 9 TradingView Indicator
Overview
The GANN SQUARE 9 TradingView Indicator is a powerful analytical tool designed for traders who utilize the principles of W.D. Gann's Square of 9. This indicator provides calculated levels for intraday, daily, and weekly timeframes, offering up to 7 levels of support and resistance. By incorporating this indicator into your trading strategy, you can identify potential price turning points, forecast market movements, and enhance your decision-making process.
Key Features
1. Multi-Timeframe Analysis :
-> Intraday Levels : Calculate and display up to 7 support and resistance levels based on intraday price action, providing traders with granular insights for short-term trades.
-> Daily Levels : Determine critical daily support and resistance levels to guide your trading decisions over a single trading session.
-> Weekly Levels : Identify broader market trends and significant price zones for the week, helping you to plan and execute longer-term trades.
2. Up to 7 Support and Resistance Levels :
-> The indicator calculates and displays up to 7 levels above (resistance) and below (support) the current price, offering a comprehensive view of potential market reactions.
3. Customization :
-> Flexible settings allow you to customize the calculation parameters to fit your specific trading style and market conditions.
-> Options to adjust the look and feel of the indicator, including colors and line styles, for better visual clarity.
4. User-Friendly Interface :
-> Easy to interpret and integrate into your existing TradingView charts.
-> Clear labeling and visual representation of support and resistance levels to enhance your trading experience.
Benefits
-> Precision : Leverage the mathematical precision of Gann's Square of 9 to pinpoint exact price levels where the market is likely to react.
-> Versatility : Suitable for various trading styles, including scalping, day trading, and swing trading.
-> Enhanced Decision Making : Gain a deeper understanding of market dynamics and make more informed trading decisions by incorporating these calculated levels into your analysis.
How It Works
The GANN SQUARE 9 TradingView Indicator uses the principles of the Square of 9 to calculate price levels. It applies Gann's time and price harmonics to identify key support and resistance zones, which are crucial for determining potential reversal points and market trends.
Practical Application
-> Intraday Traders : Use the intraday levels to enter and exit trades with precision, maximizing profits by capitalizing on short-term price movements.
-> Day Traders : Rely on the daily levels to set stop-loss orders and profit targets, ensuring you stay on the right side of the market.
-> Swing Traders : Utilize weekly levels to understand the broader market context and plan your trades with a longer-term perspective.
Incorporate the GANN SQUARE 9 TradingView Indicator into your trading toolkit to unlock the potential of Gann's methodologies and elevate your trading performance.

Gann Square 4 Table Concept Alternate UIThis indicator was intended as educational purpose only for Gann Square 4, specifically to show Cross Cardinal.
This indicator was build upon The Tunnel Thru The Air Or Looking Back From 1940, written by WD Gann .
This build was improved based on Gann Square 4 Cross Cardinal Table Concept by grouping similar values after selected to save time.
User Interface also was improved.
Indikator ini bertujuan sebagai pendidikan sahaja untuk Gann Square 4, khusus untuk menunjukkan Cross Cardinal.
Indikator ini dibina berdasarkan buku The Tunnel Thru The Air Or Looking Back From 1940, ditulis oleh WD Gann .
Binaan ini telah ditambah baik berdasarkan Gann Square 4 Cross Cardinal Table Concept dengan mengumpulkan nilai yang sama setelah dipilih untuk menjimatkan masa.
User Interface juga telah ditambah baik.
Indicator features :
1. Font size from tiny to huge.
2. For desktop display only, not for mobile.
3. All values can be selected by group.
Kemampuan indikator :
1. Saiz font dari paling kecil ke paling besar.
2. Untuk paparan desktop sahaja, bukan untuk mobile.
3. Semua nilai boleh dipilih secara berkumpulan.
FAQ
1. Credits / Kredit
WD Gann , The Tunnel Thru The Air Or Looking Back From 1940
Ganzilla
2. Page involved / Muka Surat terlibat
195 - 198
3. Code Usage / Penggunaan Kod
Free to use for personal usage.
Bebas untuk kegunaan peribadi.
4. Previous build / Binaan sebelum ini
Gann Square 4 Cross Cardinal Table Concept
5. Related build / Binaan berkaitan
Gann Square 9 Cross Cardinal Table Concept
Left : Even array number / Kiri : Array nombor genap
Right : Odd array number / Kanan : Array nombor ganjil

Gann Circle Intraday LevelsThis indicator is an intraday version of Gann Circle Swing Levels indicator. It further divides the Gann Circle into the Eighths in order to generate intraday Levels.
Introduction
This indicator is based on W. D. Gann's Square of 9 Chart and can be interpreted as the Gann Circle / Gann Wheel / 360 Degree Circle Chart or Square of the Circle Chart for intraday usage.
Spiral arrangement of numbers on the Square of 9 chart creates a very unique square root relationship amongst the numbers on the chart. If you take any number on the Square of 9 chart, take the square root of the number, then add 2 to the root and re-square it, resulting in one full 360 degree cycle (i.e. a 360 degree Circle) out from the center of the chart.
For example,
the square root of 121 = 11,
11 + 2 = 13,
and the square of 13 = 169
The number 169 is one full 360 degree cycle out (with reference to 121) from the center of the Square of 9 chart. If we further divide the circle in eight equal parts of 45 degree each, following intermediate resistance levels (ascending) would be generated:
127 (45 degree)
133 (90 degree)
139 (135 degree)
145 (180 degree)
151 (225 degree)
157 (270 degree)
163 (315 degree)
Similarly, if you take any number on the Square of 9 chart, take the square root of the number, then subtract 2 from the root and re-square it, resulting in one full 360 degree inward rotation towards the center of the chart.
For example,
the square root of 565 = 23.77,
23.77 - 2 = 21.77,
and the square of 21.77 = 473.93 (approximately equal to 474, which is directly below 565 on the Square of 9 chart)
The number 474 is one full 360 degree inward rotation (with reference to 565) towards the center of the chart. If we further divide the circle in eight equal parts of 45 degree each, following intermediate support levels (descending) would be generated:
553 (45 degree)
541 (90 degree)
529 (135 degree)
518 (180 degree)
507 (225 degree)
496 (270 degree)
485 (315 degree)
How to Use this Indicator ?
This indicator is designed to generate Gann Circle Intraday Levels based on HIGH and LOW of the opening bar for the day. You may use the bar interval (1 minute, 3 minutes, 5 minutes, 15 minutes etc.) which is suitable for the underlying instrument. Support and resistance lines for the day would be generated only after confirmation of the opening bar of the day.
Input :
Number of Gann Levels (Number of Gann Levels to be projected)
Color codes for the Support and Resistance Levels
Output :
Gann Support or Resistance Levels:
HIGH and LOW of the Opening bar for the day (dashed BLUE lines)
Support levels calculated with reference to the HIGH of the opening bar
Resistance levels calculated with reference to the LOW of the opening bar
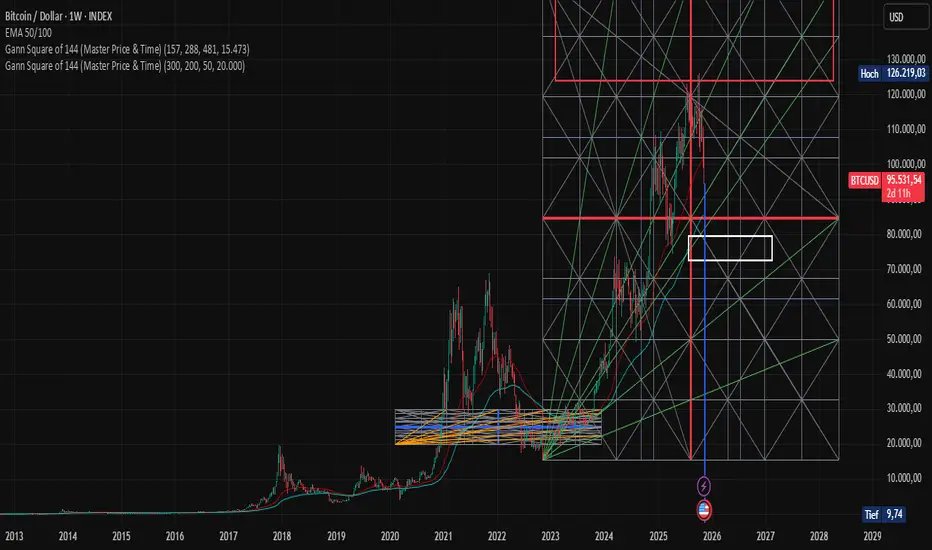
Gann Square of 144 (Master Price & Time)🔹 What this tool does
Draws a 144-unit square in price & time (0 → 144)
Plots all key horizontal & vertical levels:
0, 18, 36, 48, 54, 72, 90, 96, 108, 126, 144
Highlights the main 1/2 level (72) as thick midline
Marks 1/3 and 2/3 (48 & 96) as special harmonic levels
Draws internal diagonals (0–144, 144–0 and sub-squares)
Plots an 8-ray Gann fan from the 0-point (0 → 36 / 72 / 108 / 144 etc.)
Keeps price–time ratio consistent inside the box:
the 1×1 angle has a fixed slope = price_per_bar
The idea: once the square is calibrated to a major swing, you can study how price respects these angles and harmonic zones over time.
🔧 Inputs & how to set it up correctly
Choose your timeframe
Works best on Daily and Weekly charts.
Use one timeframe consistently when calibrating the square.
Start offset (bars back)
Start offset (bars back) shifts the whole square left/right.
Increase the value to move the square further into the past, decrease it to move it closer to the current bars.
Box width (bars)
Box width (bars) = how many bars the square spans horizontally.
Bigger value = projects the structure further into the future.
Example: 288 bars ≈ 2×144 units in time, 720 bars for longer-term projection, etc.
Bottom price
Bottom price is your 0-level in price.
Usually set this to a major swing low (cycle low, bear market low, important pivot).
The bottom-left corner of the square conceptually sits at:
(start_offset_bar, bottom_price)
Price per bar (slope 1×1) (if your version has this input)
This defines the slope of the 1×1 angle (main Gann angle).
Recommended way to set it:
Pick a major impulsive move from Swing Low → Swing High.
Measure:
Price range = High − Low
Number of bars between them.
Compute:
price_per_bar = price_range / number_of_bars
Use that as your 1×1 value in the input.
Now the main diagonal from 0 to 144 represents the true Gann 1×1 for that swing.
Important: The 1×1 angle is mathematically correct (price-per-bar), even if it does not always look like a perfect 45° line visually in TradingView due to chart scaling.
📖 How to read the Square of 144
Horizontal levels
0 = anchor price (bottom)
18, 36, 48, 54, 72, 90, 96, 108, 126, 144 = key price harmonics
72 (1/2) often acts as major support/resistance
48 & 96 (1/3 and 2/3) are strong “vibration” levels
Vertical levels
Same units but in time (bars).
When important pivots in price occur near these verticals, you get time–price confluence.
Midlines (1/2)
The thick horizontal and vertical lines at 72 mark the center of the square.
Crossings around these often signal important cycle turns.
1/3 & 2/3 zones (48–54 and 90–96)
These narrow bands are powerful reversal / decision zones.
Price often reacts strongly there or accelerates if they break.
Gann fan from 0-point
These rays represent major trends:
1×1 equivalent (main diagonal)
Faster & slower angles (e.g. 2×1, 1×2, etc depending on configuration)
If price breaks one fan angle cleanly, it often “falls” or “climbs” toward the next one.
🎯 Practical use cases
Project future support/resistance zones based on a major low.
See where price is in the square: early in the cycle (0–36), mid (around 72), or late (108–144).
Watch how price respects:
midlines (72),
1/3 and 2/3 bands (48–54, 90–96),
and the fan angles from 0.
Combine with your own price action / Fibonacci / trend tools – this is not a signal generator, but a time–price map.
⚠️ Notes & limitations
This tool is for educational & analytical purposes only.
It does not generate buy/sell signals.
Visual 45° angles in TradingView can change when you zoom or rescale the chart.
→ The script keeps the internal price-per-bar logic stable, even if the drawing looks steeper/flatter when zooming.
Always confirm zones with price action, volume, and higher timeframe context
Gann Square of 144 (Master Price & Time)🔹 What this tool does
Draws a 144-unit square in price & time (0 → 144)
Plots all key horizontal & vertical levels:
0, 18, 36, 48, 54, 72, 90, 96, 108, 126, 144
Highlights the main 1/2 level (72) as thick midline
Marks 1/3 and 2/3 (48 & 96) as special harmonic levels
Draws internal diagonals (0–144, 144–0 and sub-squares)
Plots an 8-ray Gann fan from the 0-point (0 → 36 / 72 / 108 / 144 etc.)
Keeps price–time ratio consistent inside the box:
the 1×1 angle has a fixed slope = price_per_bar
The idea: once the square is calibrated to a major swing, you can study how price respects these angles and harmonic zones over time.
🔧 Inputs & how to set it up correctly
Choose your timeframe
Works best on Daily and Weekly charts.
Use one timeframe consistently when calibrating the square.
Start offset (bars back)
Start offset (bars back) shifts the whole square left/right.
Increase the value to move the square further into the past, decrease it to move it closer to the current bars.
Box width (bars)
Box width (bars) = how many bars the square spans horizontally.
Bigger value = projects the structure further into the future.
Example: 288 bars ≈ 2×144 units in time, 720 bars for longer-term projection, etc.
Bottom price
Bottom price is your 0-level in price.
Usually set this to a major swing low (cycle low, bear market low, important pivot).
The bottom-left corner of the square conceptually sits at:
(start_offset_bar, bottom_price)
Price per bar (slope 1×1) (if your version has this input)
This defines the slope of the 1×1 angle (main Gann angle).
Recommended way to set it:
Pick a major impulsive move from Swing Low → Swing High.
Measure:
Price range = High − Low
Number of bars between them.
Compute:
price_per_bar = price_range / number_of_bars
Use that as your 1×1 value in the input.
Now the main diagonal from 0 to 144 represents the true Gann 1×1 for that swing.
Important: The 1×1 angle is mathematically correct (price-per-bar), even if it does not always look like a perfect 45° line visually in TradingView due to chart scaling.
📖 How to read the Square of 144
Horizontal levels
0 = anchor price (bottom)
18, 36, 48, 54, 72, 90, 96, 108, 126, 144 = key price harmonics
72 (1/2) often acts as major support/resistance
48 & 96 (1/3 and 2/3) are strong “vibration” levels
Vertical levels
Same units but in time (bars).
When important pivots in price occur near these verticals, you get time–price confluence.
Midlines (1/2)
The thick horizontal and vertical lines at 72 mark the center of the square.
Crossings around these often signal important cycle turns.
1/3 & 2/3 zones (48–54 and 90–96)
These narrow bands are powerful reversal / decision zones.
Price often reacts strongly there or accelerates if they break.
Gann fan from 0-point
These rays represent major trends:
1×1 equivalent (main diagonal)
Faster & slower angles (e.g. 2×1, 1×2, etc depending on configuration)
If price breaks one fan angle cleanly, it often “falls” or “climbs” toward the next one.
🎯 Practical use cases
Project future support/resistance zones based on a major low.
See where price is in the square: early in the cycle (0–36), mid (around 72), or late (108–144).
Watch how price respects:
midlines (72),
1/3 and 2/3 bands (48–54, 90–96),
and the fan angles from 0.
Combine with your own price action / Fibonacci / trend tools – this is not a signal generator, but a time–price map.
⚠️ Notes & limitations
This tool is for educational & analytical purposes only.
It does not generate buy/sell signals.
Visual 45° angles in TradingView can change when you zoom or rescale the chart.
→ The script keeps the internal price-per-bar logic stable, even if the drawing looks steeper/flatter when zooming.
Always confirm zones with price action, volume, and higher timeframe context.

Gann Astronomical Turning PointsThis is a comprehensive Pine Script that implements W.D. Gann's astronomical theories to identify potential market turning points. Here's a detailed breakdown of the script:
Overview
The script identifies and displays astronomical events (sun angles, moon phases, and Mercury retrogrades) that Gann theorists believe correlate with market turning points. It also analyzes historical price performance following these events to provide statistical significance.
Key Components
1. Input Parameters
Date Range: Users can set the analysis period (start and end dates)
Display Options: Toggle visibility of different astronomical events and tables
Analysis Settings: Configure the lookback period for price change analysis (1-20 days)
2. Astronomical Calculations
The script includes several functions to calculate celestial positions:
getDaysSinceEpoch(t): Calculates days since January 1, 2000 (reference point)
getSunLongitude(t): Computes the Sun's position in the ecliptic (0-360°)
getMoonPhase(t): Determines the Moon's phase angle relative to the Sun
getMercuryLongitude(t): Calculates Mercury's position in the ecliptic
3. Gann Critical Angles (Sun Events)
The script identifies when the Sun reaches four critical angles that Gann considered significant:
0° Aries (Spring Equinox)
90° Cancer (Summer Solstice)
180° Libra (Fall Equinox)
270° Capricorn (Winter Solstice)
These are detected by tracking when the Sun's longitude crosses these specific angles.
4. Moon Phases
Four key moon phases are identified:
New Moon: Moon passes between Earth and Sun
First Quarter: Moon is 90° east of Sun
Full Moon: Moon is opposite the Sun
Last Quarter: Moon is 270° east of Sun
5. Mercury Retrograde Periods
The script detects when Mercury appears to move backward in its orbit:
Identifies start and end dates of retrograde motion
Displays these periods as highlighted zones on the chart
6. Price Change Analysis
For each astronomical event, the script:
Calculates the percentage price change over a user-defined lookback period
Categorizes changes as positive or negative
Stores this data for statistical analysis
7. Statistical Significance
The script calculates several metrics for each event type:
Average Price Change: Mean percentage change following events
Up/Down Ratio: Number of positive vs. negative changes
Accuracy Percentage: How often the dominant direction occurred
8. Visual Elements
The script includes multiple display components:
Event Labels
Sun Angles: Orange sun symbols displayed above price bars
Moon Phases: Moon phase emojis displayed below price bars
Mercury Retrograde: Red boxes highlighting the retrograde periods
Information Tables
Events Table: Shows upcoming and recent astronomical events
Significance Analysis Table: Displays statistical performance of each event type
Forecast Section: Identifies the next upcoming event and predicted direction
9. Forecasting Functionality
The script predicts market direction for the next astronomical event based on:
Historical average price change for that event type
Statistical accuracy of previous similar events
Color-coded forecast (green for bullish, red for bearish)
This script offers an interesting implementation of Gann's astronomical theories, but should be used as part of a broader analysis rather than as a standalone trading system.
Disclaimer: This indicator is for educational purposes only. Past performance does not guarantee future results. Always conduct your own research and risk assessment before trading.

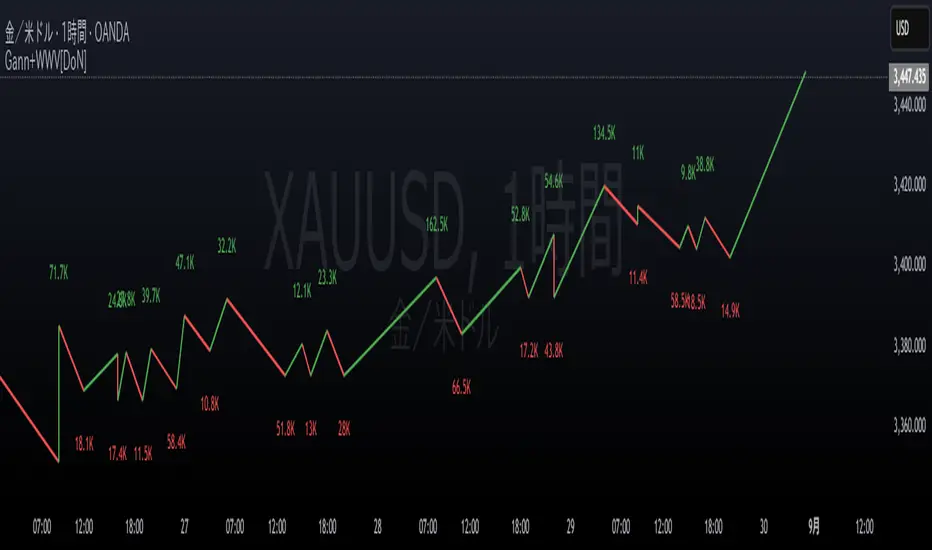
Gann Swings with Weis Wave VolumeThis indicator combines two powerful market analysis techniques into a single, comprehensive tool: swing analysis based on the theories of W.D. Gann and volume analysis popularized by David Weis (Weis Wave). By visualizing the market's wave structure and the volume that drives each move, this indicator helps traders gauge the strength of a trend and identify potential reversals.
Key Features
Gann Swing Lines:
The indicator automatically identifies and plots market swings by connecting significant highs and lows. This provides a clean, intuitive view of the market's structure and the prevailing trend direction.
Upward swings are colored green, and downward swings are colored red (by default), making it easy to see the market's flow at a glance. A real-time line is also drawn to track the current, developing swing.
Weis Wave Volume Display:
At the conclusion of each swing, the indicator calculates the total cumulative volume for that entire price wave and displays it at the swing's peak or trough. This is the core of the Weis Wave concept, linking volume directly to price swings rather than individual candles.
This feature allows traders to analyze the "effort vs. result." For example, a long upward price swing that occurs on low cumulative volume may suggest a lack of conviction and a higher probability of reversal. Conversely, a breakout past a previous swing high accompanied by significant volume confirms the strength of the move.
The cumulative volume for the current, unfinished wave is also displayed in real-time with an underscore (_) suffix.
Volume-Based Candle Coloring:
This optional feature colors the price bars based on their volume relative to a moving average (EMA) of volume.
Candles with significantly higher-than-average volume are painted in darker, more intense shades of green (for up-candles) or red (for down-candles).
This helps to instantly spot high-interest areas, such as climactic buying or selling, which often occur at key support and resistance levels or turning points.
Settings (Inputs) Explained
Gann Swing Settings:
Show Gann Swing Lines: Toggles the visibility of the swing lines.
Line Width: Adjusts the thickness of the swing lines.
Up Swing/Down Swing: Allows for full customization of the colors for up and down swing lines.
Volume Numbers Settings:
Show Volume Numbers: Toggles the visibility of the cumulative Weis Wave volume labels.
Up Volume/Down Volume: Customizes the text color for the volume numbers on up and down swings.
Size: Changes the font size of the volume labels ("Tiny" to "Huge").
Volume Unit: Formats the volume display. Choose "None" for the raw number, "K" for thousands, "M" for millions, or "B" for billions to keep the chart clean.
Additional Visual Settings:
Show Volume Candles: Enables or disables the volume-based bar coloring.
Volume EMA Period: Sets the lookback period for the Exponential Moving Average used to calculate average volume for the bar coloring feature.
How to Use
This indicator can be a valuable addition to various trading strategies.
Trend Confirmation: A healthy trend will typically show increasing cumulative volume on swings in the direction of the trend. For instance, in a strong uptrend, each new upswing should ideally be accompanied by volume that is equal to or greater than the previous upswing.
Divergence and Reversal Signals: A classic signal of a weakening trend is divergence. If the price makes a new higher high, but the cumulative volume on that upswing is significantly lower than the previous one, it indicates that the buying pressure is fading and a reversal may be imminent.
Identifying Key Levels: The points where swings reverse, especially when accompanied by high cumulative volume, often become critical support or resistance levels for future price action. The volume-colored candles can further highlight specific bars where institutional activity is likely occurring.
このインジケーターは、W.D.ギャンの理論に基づいたスイング分析と、デビッド・ワイスが普及させた出来高分析(ワイスウェーブ)を組み合わせたテクニカル分析ツールです。相場の波動(スイング)とそのスイングを形成するためにどれだけの出来高が投入されたかを視覚的に捉えることで、トレンドの強弱や転換の可能性を評価するのに役立ちます。
主な機能
ギャンスイングの描画:
相場の高値と安値を基に、上昇スイングと下降スイングを自動で識別し、ラインで結んで表示します。
これにより、市場の基本的な構造やトレンドの方向性を直感的に把握できます。
上昇スイングは緑色、下降スイングは赤色(デフォルト設定)で表示され、現在進行中のスイングはリアルタイムで描画され続けます。
ワイスウェーブ出来高の表示:
一つのスイング(波)が完了するごとに、そのスイングの始点から終点までの累計出来高を計算し、スイングの頂点(高値・安値)に表示します。
大きな価格変動(スイング)が出来高を伴っているか、あるいは出来高が乏しい中で価格だけが動いているかを判断する材料となります。
例1: 上昇スイングの価格幅が大きいにも関わらず出来高数値が小さい場合、その上昇の勢いが弱い可能性を示唆します。
例2: 価格の動きは小さいのに出来高数値が非常に大きい場合、強い抵抗や支持、あるいは市場の意見が対立している状況を示唆します。
現在進行中のスイングの累計出来高も、末尾に「_」を付けてリアルタイムで表示します。
出来高ローソク足の色付け:
オプションを有効にすると、各ローソク足の出来高を移動平均線(EMA)と比較し、その出来高の大きさに応じてローソク足を色付けします。
出来高が平均よりも大幅に大きい足は濃い色で表示され、市場の注目が集まっている価格帯(重要な高値・安値など)を特定するのに役立ちます。
設定項目(インプット)の解説
ギャンスイング設定:
ギャンスイングラインを表示: スイングラインの表示/非表示を切り替えます。
線の太さ: ラインの太さを調整します。
上昇スイング/下降スイング: 各スイングラインの色を自由に設定できます。
出来高数値の設定:
出来高数値を表示: スイングごとの累計出来高の表示/非表示を切り替えます。
上昇出来高/下降出来高: 出来高数値のテキスト色を自由に設定できます。
サイズ: 出来高数値の文字サイズを選択できます。
出来高の単位: 出来高の数値をそのまま表示するか、「K」(千)、「M」(百万)、「B」(十億)単位に変換して表示するかを選択できます。
追加の視覚設定:
出来高ローソク足を表示: 出来高に応じたローソク足の色付け機能の有効/無効を切り替えます。
出来高EMA期間: ローソク足の色付けの基準となる出来高移動平均線の期間を設定します。
活用方法
このインジケーターは、単独で使うだけでなく、他のテクニカル指標と組み合わせることで、より精度の高い分析が可能になります。
トレンドの確認: 価格が上昇スイングを続けており、かつ各上昇スイングの出来高が増加傾向にあれば、強い上昇トレンドと判断できます。
トレンド転換の察知: 価格は新高値を更新しているのに、上昇スイングの出来高が前回よりも著しく減少している場合(ダイバージェンス)、上昇の勢いが尽きかけており、トレンド転換が近い可能性を示唆します。
重要な価格帯の特定: 出来高ローソク足機能で色が濃くなっている価格帯は、多くの市場参加者が取引したことを意味し、将来的にサポート(支持)やレジスタンス(抵抗)として機能する可能性があります。
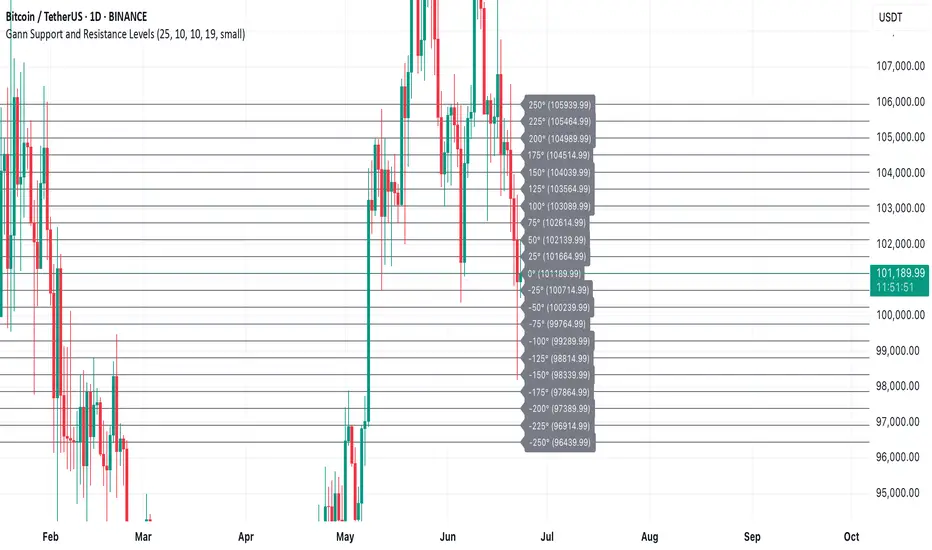
Gann Support and Resistance LevelsThis indicator plots dynamic Gann Degree Levels as potential support and resistance zones around the current market price. You can fully customize the Gann degree step (e.g., 45°, 30°, 90°), the number of levels above and below the price, and the price movement per degree to fine-tune the levels to your strategy.
Key Features:
✅ Dynamic levels update automatically with the live price
✅ Adjustable degree intervals (Gann steps)
✅ User control over how many levels to display above and below
✅ Fully customizable label size, label color, and text color for mobile-friendly visibility
✅ Clean visual design for easy chart analysis
How to Use:
Gann levels can act as potential support and resistance zones.
Watch for price reactions at major degrees like 0°, 90°, 180°, and 270°.
Can be combined with other technical tools like price action, trendlines, or Gann fans for deeper analysis.
📌 This tool is perfect for traders using Gann theory, grid-based strategies, or those looking to enhance their visual trading setups with structured levels.
SW Gann DaysGann pressure days, named after the famous trader W.D. Gann, refer to specific days in a trading month that are believed to have significant market influence. These days are identified based on Gann's theories of astrology, geometry, and market cycles. Here’s a general outline of how they might be understood:
1. **Market Cycles**: Gann believed that markets move in cycles and that certain days can have heightened volatility or trend changes. Traders look for specific dates based on historical price movements.
2. **Timing Indicators**: Pressure days often align with key economic reports, earnings announcements, or geopolitical events that can cause price swings.
3. **Mathematical Patterns**: Gann used angles and geometric patterns to predict price movements, with pressure days potentially aligning with these calculations.
4. **Historical Patterns**: Traders analyze past data to identify dates that historically show strong price reactions, using this to predict future behavior.
5. **Astrological Influences**: Some practitioners incorporate astrological elements, believing that celestial events (like full moons or planetary alignments) can impact market psychology.
Traders might use these concepts to make decisions about entering or exiting positions, but it’s important to note that Gann's methods can be complex and are not universally accepted in trading communities.

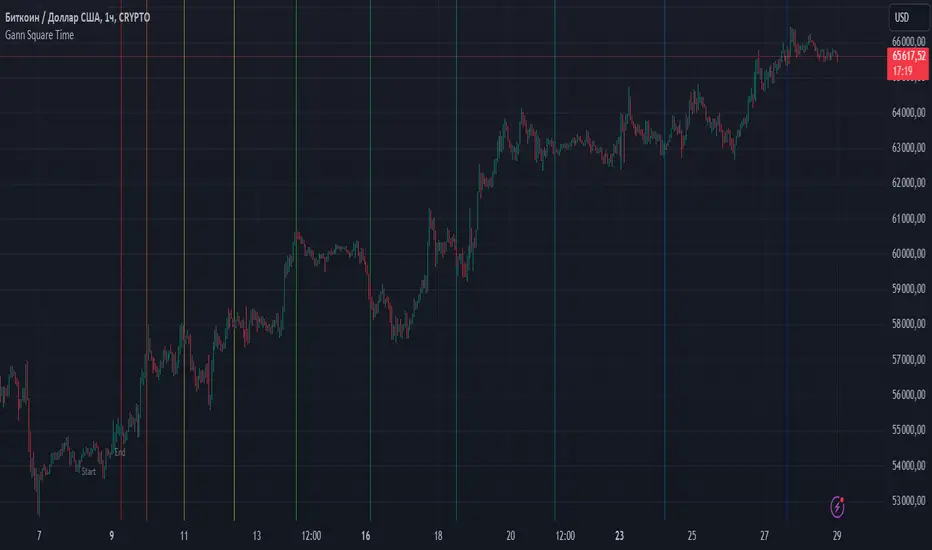
Gann Square TimeHello, friends. I want to introduce you to the Gann Square Time indicator. It is built on methods based on Gann's Square of 9. William Delbert Gann believed that it is essential to consider not only price levels but also time levels, and I will say more, he placed even greater importance on this. Gann said, "Time is more important than price. When time runs out, price will reverse." So, let's use his works and experience.
How is this indicator structured?
It calculates time levels based on the numerical sequences of the Square of 9. How does this work?
First, we need to define the impulse. More precisely, we need to determine its duration. The duration of the impulse cannot be less than 2 bars and cannot exceed 9 bars. If you determine that the impulse lasted 2 bars, the numerical sequence will be based on 180 degrees, and all dates will be constructed based on these values. If the impulse lasts for 3 bars, the numerical sequence for calculating dates will be taken from 135 degrees, and so on until the impulse is defined by nine bars. At this duration, the numerical sequence will be taken from 225 degrees.
If you find that your impulse should be less than 2 bars or greater than 9, you should switch to a more suitable timeframe and determine the impulse on it to avoid errors.
The boundaries of the impulse are defined by two timestamps. The first is labeled "Start," and the second as "End." Once you define the boundaries of the impulse, your levels will be constructed. You can work on any timeframe. If the indicator shows an error, you probably have too many levels projected into the future; in the settings, you should disable the excess levels, and then the indicator will work again. By default, I have turned off the last 5 levels, but if necessary, you can use them.
It is best to use it with other methods of your analysis, and if your analysis shows that the price has reached a strong support or resistance level, and there is also a projected date at that point, it will be a stronger signal for you.
Good luck using the indicator, and remember: Do not decide for the price where it should go,
let it reveal itself and confirm.
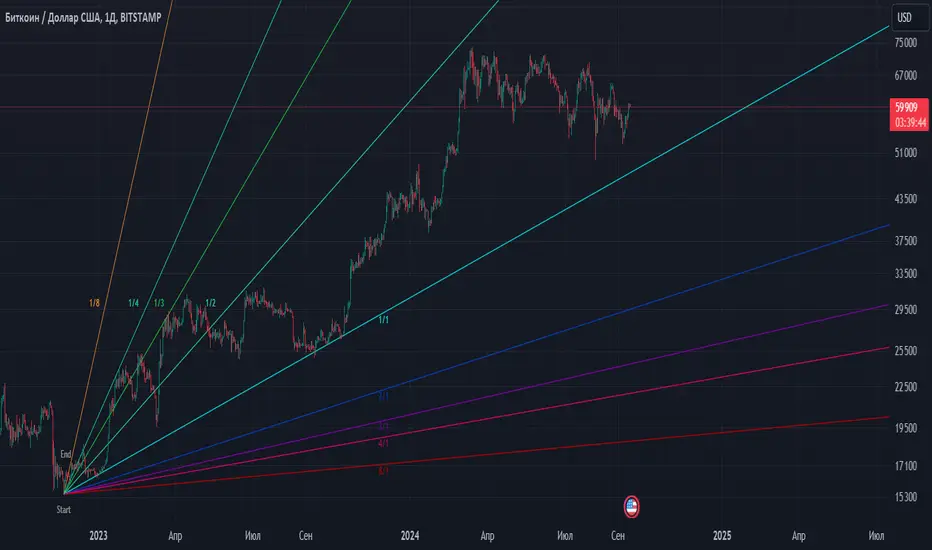
Gann fan [ALMCorp] The Gann fan is an indicator that will allow you to use the Gann Fan correctly. I think it's no secret to many that William Gunn often used geometric shapes, astrology, patterns of numbers and degrees between them in his analysis. This indicator is one of those that will help you use its methods correctly.
How does the indicator work?
First you need to set a time stamp labeled "Start" at the very beginning of the pulse, and the second time stamp labeled "End" must be set at the end of the pulse. Thus, the indicator will calculate the price step according to the formula, which will then be used in calculations for the correct construction of angles.
The very first thing we need to do is to mark the beginning and end of the pulse.
After that, the indicator will calculate the price step using the formula. And if this movement is long, then the corners will be built up. In order for this to happen automatically, it is necessary that the "Start" label be lower than the "End" label. If that's the case, the fan will automatically line up. If the "Start" label is higher than the "End" label, then the fan will automatically be built down.
The "⚙️ Long | Short | Auto" parameter is responsible for ensuring that when building corners, they are always built in the direction you need. The default mode is "Auto", but if you see that the indicator builds levels up, for example, and you need to go down, then you can force it to build levels down using the "Short" parameter, and vice versa.
Sometimes it happens that the price step is too large for the correct construction of our levels, and to adjust the price step according to the Gann rules, there is a setting "Multiplier | Divider price step", which will allow us to reduce or increase the price step by the number of times that the Gann fan rules allow.
But to choose whether you want to decrease the step or increase it, we will need to use the "⚙️ Action" setting. There are two modes: these are "Multiplier" and "Divider" respectively.
On the chart, I marked the intersections of global fans and showed that their intersection points are strong dates for the price, and it receives a reaction at this time.
To sum up, the Gann fan is a very powerful tool, and now that you know how to use it correctly, you can improve your trading. Good luck.
Gann RetracementThe indicator is based on W. D. Gann's method of retracement studies. Gann looked at stock retracement action in terms of Halves (1/2), Thirds (1/3, 2/3), Fifths (1/5, 2/5, 3/5, and 4/5) and more importantly the Eighths (1/8, 2/8, 3/8, 4/8, 5/8, 6/8, and 7/8). Needless to say, {2, 3, 5, 8} are the only Fibonacci numbers between 1 to 10. These ratios can easily be visualized in the form of division of a Circle as follows :
Divide the circle in 12 equal parts of 30 degree each to produce the Thirds :
30 x 4 = 120 is 1/3 of 360
30 x 8 = 240 is 2/3 of 360
The 30 degree retracement captures fundamental geometric shapes like a regular Triangle (120-240-360), a Square (90-180-270-360), and a regular Hexagon (60-120-180-240-300-360) inscribed inside of the circle.
Now, divide the circle in 10 equal parts of 36 degree each to produce the Fifths :
36 x 2 = 72 is 1/5 of 360
36 x 4 = 144 is 2/5 of 360
36 x 6 = 216 is 3/5 of 360
36 x 8 = 288 is 4/5 of 360
where, (72-144-216-288-360) is a regular Pentagon.
Finally, divide the circle in 8 equal parts of 45 degree each to produce the Eighths :
45 x 1 = 45 is 1/8 of 360
45 x 2 = 90 is 2/8 of 360
45 x 3 = 135 is 3/8 of 360
45 x 4 = 180 is 4/8 of 360
45 x 5 = 225 is 5/8 of 360
45 x 6 = 270 is 6/8 of 360
45 x 7 = 315 is 7/8 of 360
where, (45-90-135-180-225-270-315-360) is a regular Octagon.
How to Use this indicator ?
The indicator generates Gann retracement levels between any two significant price points, such as a high and a low.
Input :
Swing High (significant high price point, such as a top)
Swing Low (significant low price point, such as a bottom)
Degree (degree of retracement)
Output :
Gann retracement levels (color coded as follows) :
Swing High and Swing Low (BLUE)
50% retracement (ORANGE)
Retracements between Swing Low and 50% level (RED)
Retracements between 50% level and Swing High (LIME)
