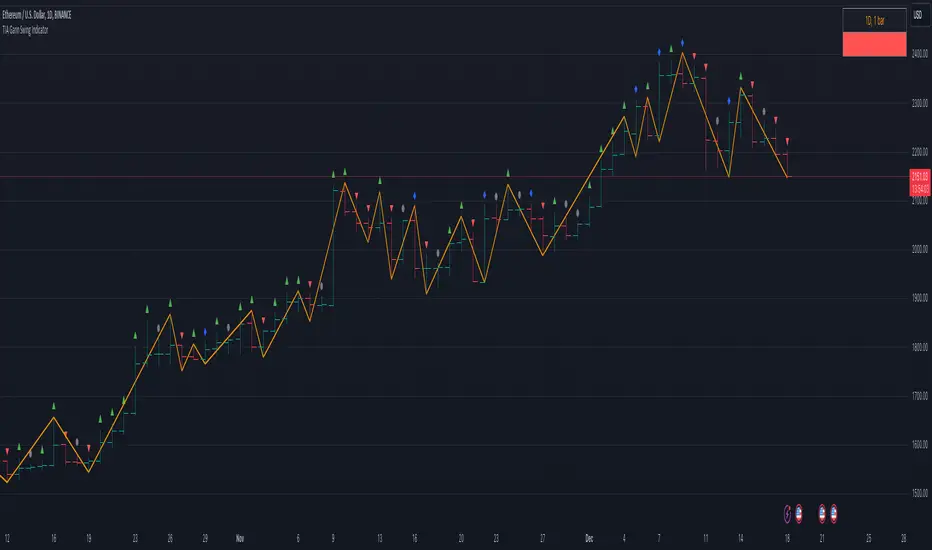
TIA Gann Swing IndicatorTIA Gann Swing Indicator
This indicator is a mechanical tool that tells the user exactly what the market trend is at any time, based on the teachings of Legendary trader, Mr. William D. Gann .
Gann called this tool the “Trendline Indicator,” but it has popularly become known as the “Swing Chart” by present-day traders.
In October 1909, Richard Wyckoff watched Gann for 25 market days (the markets traded on Saturdays back then), where Gann made 286 trades, both long and short. Two hundred sixty-four (264) of these trades were profits.
The Swing Chart was Gann’s primary trading tool helping him achieve these phenomenal trading results.
This indicator, now available to you in TradingView, automatically displays the swing chart and trend on any timeframe.
Selecting “Show Trend,” will light the background of the chart up, showing if the trend is “Up,” “Down,” or “Uncertain.”
The indicator is also fully customizable to display “Break Lines,” which indicate potential trend changes ahead of time.
Additional features include data about each bar and swing to give the user vital information, and the data points currently available include:
Bar Type
This indicator selection allows the user to identify precisely what each bar is, as per WD Gann’s Instructions.
Each of the 4 bar types includes:
Up bars, Down bars, Inside bars, Outside bars
Date
Displaying the date of swing tops and bottoms allows the user to stay on top of significant announcements and events in the economy. Often, market reversals occur right around critical economic events.
Time
This indicator selection allows the user to identify the time of the swing tops and swing bottoms. Designed for intra-day traders, this setting displays the exact time of tops and bottoms on any timeframe to help stay ahead of any important announcement.
Price
Price analysis is critical for every technical analyst, and displaying the price of swing tops and bottoms allows the trader or investor to stay on top of essential pivot points in the market. Identifying potential support and resistance levels keeps traders ahead of the herd.
Range
Identifying each swing’s price range gives the trader or investor critical information. Have you ever wondered if a market is gaining momentum or losing momentum? Knowing if price ranges are expanding or contracting is key, and this setting quickly displays what every swing range is doing.
Bar Count
What is the average number of bars up or down? Markets can only move in one direction for so many bars before a reversal. Simply displaying the number of bars between each swing gives the analyst valuable insights into overbought or oversold trends. Gann's famous “7-10 bar” rule identifies potential reversals, and this simple indicator setting can help any market participant stay ahead of the pack.
The TIA Gann Swing Indicator is an indicator that EVERY trader & investor should have at their fingertips. It is critical for long-term investors and short-term traders to know the trend of their market and vital information about the upswings and downswings. The TIA Gann Swing Indicator is the indicator to help.
See the Author's instructions below to get access to this package.
"gann" için komut dosyalarını ara
Gann Square TechniqueThis is the Gann Square Technique that i saw from the YT channel "WD Gann Price & Time Technical Analysis". The horizontal lines can act like Fibonnacci Retracement
This script display Gann Fann/trend lines that u can use like support and resistance.
There can be a problem if u try to display all the squares and lines, this for the limitation of line for part of TradingView but easily u can display:
-Three Gann Squares only with Gann lines
-Three Gann Squares only with 1/8 lines
-Two Gann Squares with 1/4 lines and Gann lines
-Two Gann Squares with 1/6 lines and Gann lines
-One Gann Squares with 1/8 lines and Gann lines
-etc
Probably if u choose some option the Gann Squares will automatically adjust to the last candle, idk how to prevent that

Gann Trading Strategy📈 Simple & Powerful Gann-Based Trading System
This indicator automatically calculates key Gann support and resistance levels based on W.D. Gann's mathematical principles. Simply input either the highest price (for bearish setups) or lowest price (for bullish setups), and the indicator automatically generates all trading levels.
🎯 Key Features:
Automatic Level Calculation - Just select High/Low price projection basis
Complete Trading Framework - Entry zone, 3 Take Profit levels, and Exit level
Visual Trading Zones - Color-coded zones around each level for better entry/exit timing
Smart Alerts - Get notified when price reaches key levels
Bullish & Bearish Setups - Works for both long and short trading strategies
Customizable Display - Show/hide levels, adjust colors, line styles, and zone widths
🚀 How to Use:
Select "Lowest Price" for bullish setup or "Highest Price" for bearish setup
Input the relevant high or low price from your analysis
The indicator automatically calculates and displays all trading levels
Use the green entry zone for entries, blue levels for take profits, red level for exits
📊 Perfect for:
Swing trading
Position sizing and risk management
Support/resistance analysis
Multi-timeframe analysis
Uses time-tested Gann principles to automatically find key price levels for trading.

Gann LV Price/Time (EN)Gann LV Price/Time
This indicator is based on William Gann’s methods, the Law of Vibration, and classic wave analysis. Unlike traditional Gann tools, it employs adaptive trend analysis, combining angular acceleration, price-to-time ratio, and resonance zones. This allows for more precise identification of key support and resistance levels and enhances the ability to forecast potential trend reversals.
🔹 Key Features
✔ Customizable key points (A, B, C) – the user selects three significant points that form the basis of the analysis.
✔ Price calculation methods – the option to consider candle wicks, candle bodies, or an average price.
✔ Automatic trend structure analysis – the indicator determines whether the market is in an impulse or corrective phase.
✔ Support and resistance level forecasting – based on Gann’s Law of Vibration, making calculations dynamic.
✔ Identification of time-based reversal zones – key time cycles that influence trends are analyzed.
✔ Price resonance zones – special areas where the price reaches maximum sensitivity and may reverse direction.
✔ Market noise filtering – intelligent smoothing and volatility adaptation techniques are applied.
🔹 How Does the Indicator Work?
1️⃣ Defining Key Points A, B, C
These points serve as the foundation of the analysis, helping to determine trend direction and potential reversal zones.
2️⃣ Angular Acceleration Analysis
The indicator assesses whether the angle between points is accelerating or decelerating, allowing traders to identify trend strength and potential turning points.
3️⃣ Detection of Price Resonance Zones
Every market has its own natural vibration frequencies—moments when the price is most susceptible to trend shifts. The indicator analyzes these patterns and identifies key levels where reversals may occur.
4️⃣ Identification of Time-Based Trend Reversal Zones
Time cycles play a crucial role in price movements. By analyzing market rhythm patterns, the indicator forecasts probable trend reversal points, providing additional confirmation for trading decisions.
🔹 What Are Price Resonance Zones?
Resonance zones are areas on the chart where the price encounters an "invisible barrier" based on Gann’s Law of Vibration. These zones form when natural price and time rhythms align, creating an effect similar to acoustic or mechanical resonance.
Within these zones:
Trends slow down or accelerate.
There is a high probability of a reversal.
Key support and resistance levels become stronger.
The indicator automatically identifies these intersections, helping traders find optimal entry and exit points.
🔹 Where to Apply It?
✔ For identifying entry and exit points – helps detect the most probable trend reversal zones.
✔ For market cycle analysis – understanding market rhythms enables more accurate forecasting.
✔ For filtering false breakouts – resonance zones can confirm or invalidate potential breakouts.
📌 Important: This indicator does not guarantee profits; it serves as a supportive tool for comprehensive technical analysis.

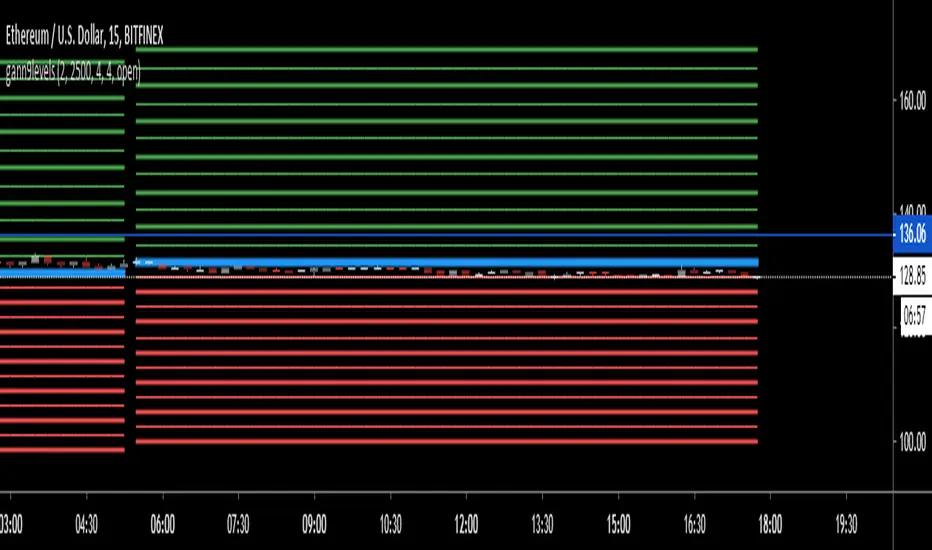
Dynamic Gann Levels [XrayTrades]This indicator dynamically captures the highest and lowest points visible on the chart and calculates Gann Support and Resistance Levels. The inputs are detailed below.
Why create this indicator?
There is no other indicator with the same functionality on TradingView.
These calculations are time-consuming; the speed at which this indicator calculates any number of rotations and degrees and visually displays them on the chart is invaluable to me, and hopefully others who use/perform these calculations.
Works on any time frame:
Year, month, week, day, etc. Smaller timeframes (intraday) for higher prices may require adjusting the y-axis of the chart after the calculation of levels due to the nature of squaring numbers.
Inputs:
Resistance: Up (from pivot low) - This toggles on/off levels calculated from the lowest point visible on the chart’s current view.
Support: Down (from pivot high) - This toggles on/off levels calculated from the highest point visible on the chart’s current view.
360 - Toggles on/off the levels of full rotations (360 degrees) from price
180 - Toggles on/off the levels of half rotations (180 degrees) from price
90 - Toggles on/off the levels of quarter rotations (90 degrees) from price
45 - Toggles on/off the levels of eighth rotations (45 degrees) from price
Full Rotations Visible - The number of rotations to be displayed on the chart
How to use this indicator:
Adjust chart window to change the highs and lows.
Select the degrees, direction, and number of rotations in the indicator settings.
The colored values beside the indicator represent the values (high and low) used in generating the Gann levels. Should the cursor be on the chart, ensure it is to the right of the high and low pivots, as this is dynamic in TradingView depending upon cursor location. Note: This is only for the user to know which value(s) are used; cursor position does not impact actual calculations and levels displayed.
The levels will be drawn to the right of the most recent price, labeled with the degrees and direction as well as the price value at the level.
About the calculations:
These calculations are derived from the Natural Square Calculator of Gann Theory, also known as the Square of Nines.
Details:
Take the square root of the selected value (lowest and or highest point).
Add (for up or subtract for down) 0.25 for every 45 degrees of rotation to the desired calculation.
Square this. Round to two decimal places.
Ex: Low of 100. Calculate Gann resistance level for 360 degrees. (√(100)+2)² = 144.
Ex: High of 100. Calculate Gann support level for 180 degrees. (√(100)-1)² = 81.

Gann Price VibrationsCurrently there is no Script available for drawing Price Vibrations based on Gann theory. I have attempted to fill this gap. This indicator will draw Cycle lines based on Gann Theory. This is vey basic one. It draws lines at start/end of every cycle. One cycle is 360 degrees. Based on feedback, it will be upgraded further with lower Angles 90/180/270 degrees movement.
How to use it ? Once you load the indicator on the chart, edit settings and give current market price of Stock you are watching.
Example: If you are watching Reliance share price on chart, go to indicators/Public/Gann Price Vibrations. Once indicator is loaded, edit input Price as 2200. Then indicator will draw cycle lines.
How to trade ? Generally, it is assumed that stock prices move in cycles. Prices spend more time near these lines. So, if you find UP or Down breakout from cycle lines, take entry. For Long trade, Target is next upper line and stop loss is one line below. Similarly, for short trade, Target is next below line and stop loss is upper line. Just notice, how RIL is moving exactly within these cycles.
If you want to study historical charts, you need to enter Price value closer to that date.
Please Like it/Share it

Gann Swing Oscillator The Gann Swing Oscillator has been adapted from Robert Krausz's book,
"A W.D. Gann Treasure Discovered". The Gann Swing Oscillator helps
define market swings.

Gann Square of 144 (Master Price & Time)This indicator is a fully reconstructed and highly precise version of W.D. Gann’s Square of 144, designed for deep analysis of price-time balance, harmonic movements, and cyclical turning points.
It allows traders to anchor the Square directly to any pivot (date + price), making the tool adaptable for all markets and all timeframes.

Gann Bosameer This indicator identifies dynamic support and resistance levels using Gann angles from highs and lows.
It helps traders visualize the “price ladder” for potential upward or downward moves, with both manual and automatic pivot options and multiple angle selections.
⚠️ For analytical purposes only – not a financial advice or trading recommendation.

Gann Swing PointsIndicator Logic
This is a GANN-style swing indicator that classifies bars based on their high/low structure relative to the previous bar.
I strongly encourage you to replay bars on Tradingview using this indicator to get a sense of how it creates pivot (or swing) points
Bar Classification:
Up-Bar (direction: 'up'): Higher High and Higher Low (HH/HL)
Down-Bar (direction: 'down'): Lower High and Lower Low (LH/LL)
Outside-Bar (generates 2 directions):
Green: 'down' then 'up'
Red: 'up' then 'down'
Inside-Bar: No direction generated (HL/LH)
Swing Line Logic
The swing line continues in the current direction until n opposite directions are detected.
n is the "n-direction" parameter (commonly set to 2, so 2 consecutive opposite direction is needed to turn the swing)
When n opposing directions occur, the swing turns, creating a pivot point
Inside bar is ignored, so e.g up-bar -> inside-bar -> up-bar generates "up", "up" direction
A top pivot is formed when the swing turns down
A bottom pivot is formed when it turns up
Note: This swing logic is inherently lagging — it only confirms tops/bottoms after the fact
This swing structure gives the system a clear and noise-resistant way to identify pivot points (swing-points)

Gann Percentage of High & Low Prices for Options - Keanu_RiTzThis Indicator is based on the text from Chapter 4 "Percentage of High & Low Prices" page number "30" from the book "WD Gann 45 years in Wall Street".
This Indicator is to be used on Intraday Timeframes and only on Options Charts (CALL & PUT) and not on any other chart.
The following is the text from that page :-
One of the greatest discoveries I ever made was how to figure the percentage of high and low prices on the averages and individual stocks.
The percentages of extreme high and low levels indicate future resistance levels.
There is a relation between every low price to some future high price and a percentage of the low price indicates what levels to expect the next high price.
At this price you can sell out long stocks and sell short with a limited risk.
The extreme high price or any minor tops are related to future bottoms er low levels.
The percentage of the high price tells where to expect low prices in the future and gives you resistance levels where you can buy with a limited risk.
The most important resistance level is 50% of any high or low price.
Second in importance is 100% on the lowest selling price on the averages or individual stocks.
You must also use 200%, 300%, 400%, 500%, 600% or more, depending upon the price and the Time Periods from High and Low.
Third in importance is 25% of the Lowest price or the Highest price.
Fourth in importance is 121/2% of the extreme Low or extreme High price.
Fifth in importance is 61/4% of the Highest price, but this is only to be used when the averages or individual stocks are selling at very high levels.
Sixth in importance is 33 1/3 and 66 2/3%. These percentages should be calculated and watched for resistance next after 25% and after 50%.
You should always have percentage tables made up on the Industrial Averages and on the individual stocks you trade in in order to know where these important resistance levels are located.
Description :
It plots the Intraday % levels from the highest high and lowest low of that day.
The calculation of these levels is based on the text from Chapter 4 "Percentage of High & Low Prices" page number "30" from the book "WD Gann 45 years in Wall Street".
I developed this indicator to see if those percentages work on Options prices or not,
and from my observation I found that it works wonderfully in Options as well.
These % levels work like magic and act as great Dynamic Support and Resistance levels.
Don't trust my words blindly and see for yourself.
This indicator is for educational and research purpose only.
It does not provide any BUY/SELL signals.

Gann Square Range - majalad
s3.tradingview.com
Price and Time squaring is one of the main concepts that W.D. Gann introduced and talked about in his books. This script uses those techniques to Square a Range that you specify on the chart.
Using this script you can square the chart based on:
Price
Time
Both Price and Time
You can also choose to square based on the price, price squared or square root of the price with a lot of customization and coloring options. You have the overall control to change any part of the script including lines colors, style, thickness, fill colors and so on.
Please note that although the script tries to set the direction and the price per point automatically for you, sometimes for very fast or very slow instruments you will need to define the price per point for the instrument that you are dealing with.
How to use
Once you add the script, you will need the 2 points associated with the Range you want to square. The script will prompt you to select the first point on the chart then the second point.
The script will calculate the price per point and the trend direction for you automatically.
If needed, you can change the price per point and the direction from the settings.
You can also select to add multiple boxes for the same squared range
Please PM me for access or for any question.


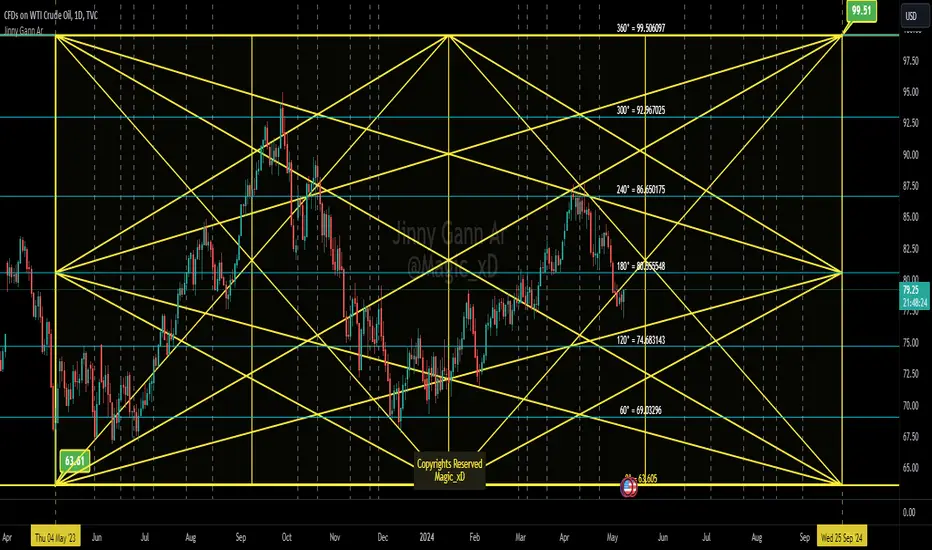
Jinny Gann ArJinny Gann AR is a comprehensive technical analysis indicator designed to empower traders with the tools to analyze market movements using Gann square of 9 theory. Developed by Magic_xD, this indicator integrates various features inspired by the legendary trader W.D. Gann's methods.
The trading techniques by WD Gann are widely seen as innovative and are still studied and used by traders today. He used angles and various geometric constructions. Gann angles divide time and price into proportionate parts and are often used to predict areas of support and resistance, key tops and bottoms and future price moves. The method is based on the notion that markets rotate from angle to angle and when an angle is broken, price moves towards the next one. Several angles together make up a Gann Fan.
- Jinny Gann AR Might accurately Shows you when and what price might be the end of the Cycle,
-Gives The important pivot points
- This Allows you to Detect Next Level of Resistance/Support And when a Possible Reversal might occur ahead so you can Catch a reversal in time.
- Its Multi Language User interface English - Arabic.
Ability to customize Every thing visually.
Some Features Explained on USOIL Chart :
Gann Square of 9 Levels for USOIL:
Charts Shows and Up Cycle Started 4 May 2023 From bottom of 63.61
Indicating Important Levels and Expected End of 1 Cycle at 99.5 on 25 Sep 2024
Gann Star With Levels And Time Lines :
Vertical Dashed Lines are The time lines
Jinny Gann Grid Based on Shape Type not Static 45 Angle:
Jinny Gann Grid + Levels :
Jinny Gann Fan For Up Cycle:
Jinny Gann Fan Reverse Same Cycle:
Ability To Show Both Up/Reversal Fans on The chart:
The Number of Fann Levels you need on the chart can be customized by changing Shape Type... But Price Will Respect it Pretty Well.
Key Features:
Direction Selection: Choose between "Up" or "Down" to specify the market direction you want to analyze.
Automatic Settings Adjustment: Enable this option to allow the indicator to automatically adjust settings for optimal analysis.
Original Gann Levels: Display original Gann theory levels Based on Gann Square of 9 Equations.
Auto Detect Tops/Bottoms: Determine the number of previous candles used to automatically detect Top or Bottom in the market.
Spacing Configuration: Adjust the spacing or offset between Gann levels to fine-tune your analysis.
Manual Starting Point: Manually set the starting point for your analysis.
Geometric Shape Selection: Choose from various geometric shapes including straight lines, triangles, quadrilaterals, and more...
Custom Angle Selection: Define custom angles for geometric shapes .
Time Interval Selection: Select time intervals such as 360 or 720 Etc...
Cycle Analysis: Determine the number of cycles to analyze market movements effectively.
Decimal Precision: Customize the number of decimal places displayed for accurate analysis.
Automatic Spacing (Under Development): Future feature to automatically select spacing for enhanced user experience.
Time Levels Display: Visualize time levels to gain insights into market timing.
Gann Star Display: Show Gann stars to identify critical market points.
Star Modification: Modify the appearance of Gann stars for better visualization.
Gann Grid Display: Display Gann grids to identify key support and resistance levels.
Grid Extension: Extend Gann grid lines for extended analysis.
Gann Fan Display: Show Gann fans to analyze trend lines and potential reversals.
Reverse Fan Display: Visualize Gann fans in reverse to explore alternative analysis perspectives.
Additional Fan Options: Explore more options for Gann fan analysis.
Time Line Adjustment: Move time lines to the right or left for flexible analysis.
Star Line Extension: Extend Gann star lines for deeper insights.
Fan Line Extension: Extend Gann fan lines for comprehensive trend analysis.
Customizable Colors: Customize colors for various indicators to suit your preference.
Width Adjustment: Adjust the width of trend lines for better visualization.
Label Customization: Customize colors and positions of level and price labels for clarity.
Original Gann Swing Chart Rules [AlgoFuego]🔵 Original Gann Swing Chart Rules
An advanced indicator built on W.D. Gann’s original rules, enhanced with innovative mechanical trend-following methods.
🔹 Description
This indicator functions by balancing short-term adaptability with long-term trend analysis.
The indicator incorporates Gann’s principles alongside mechanical trend-following techniques to offer a structured method for analyzing trends and detecting potential market reversals.
Golden Rule: Non-trend bars are excluded from analysis, and each new bar is compared with the previous trend bar, it highlights significant swing points with greater clarity.
🔸 The core concept behind the golden rule on which this indicator is built.
The person watching the tide coming, wanting to pinpoint the exact spot that signals the high tide, places a stick in the sand at the points where the incoming waves reach until the stick reaches a position where the waves no longer rise, and eventually recedes enough to show that the tide has shifted.
This method is effective for monitoring and identifying tides and floods in the stock market.
🔸Rule 1: The trend bar is everything.
→It is a bar that forms a new high, low, or both.
🔸Rule 2: The professional traders track new highs and lows.
🔸Rule 3: The hidden bar is nothing.
→It is a bar that does not form a new high, low, or both.
🔸Rule 4: The sea has a wavy nature, and the market as well.
🔸Rule 5: The slope is the immediate direction of the swing.
Downward slope
→The downslope is the descending slope of a swing, shows a decline, reflecting a bearish price trend.
Upward slope
→The upslope is the ascending slope of a swing, shows an incline, reflecting a bullish price trend.
🔸Rule 6: The start and end of the movement are the swing points.
→The lowest or highest price of the last bar in the direction of the slope represents the swing point after the slopes direction changes.
Valley
→It is the lowest price of the last bar in a downslope before the market turns to a upslope.
End=> Downward slope and Start=> Upward slope
Peak
→It is the highest price of the last bar in a upslope before the market turns to an downslope.
End=> Upward slope and Start=> Downward slope
🔸Rule 7: The Golden Rule: Ignore all no-trend bars and compare the new bar with the previous trend bar.
→Applying the golden rule in upward slope
→Applying the golden rule in downward slope
🔸 Related content: Personal words of W.D Gann from the book Wall Street Stock Selector.
→"This was only one month's reaction the same as March 1925. The market held in a dull narrow range for about 2 months while accumulation was taking place and in June the main trend turned up again."
→The beginning of the main trend and the formation of the Valley.
→The beginning of the main trend and the formation of the Peak.
🔸 Rule 8: The Closing Price of the Bar to Understand Movement Direction.
Sequence is important
→ Downward bar
→ Upward bar
🔸 Outside Bar Rules
→Explanation of rules and calculations.
🔸 How does a trend start?
Upward trend
Trend change from Downward to Upward.
Prices must take out the nearest 'Peak' and the Trend was previously Downward.
A breakout above the previous peak signals a bullish reversal.
→ Model 1 - Dropping Valley Reversal
The market forms a dropping valley, followed by a breakout above the previous peak.
→ Model 2 - Equal Valley Reversal
The market forms an equal valley, followed by a breakout above the previous peak.
→ Model 3 - Rising Valley Reversal
The market forms a rising valley, followed by a breakout above the previous peak.
Downward trend
Trend change from Upward to Downward.
Prices must take out the nearest ‘Valley' and the Trend was previously Upward.
A breakdown below the previous valley signals a bearish reversal.
→ Model 1 - Rising Peak Reversal
The market forms a rising peak, followed by a breakdown below the previous valley.
→ Model 2 - Equal Peak Reversal
The market forms an equal peak, followed by a breakdown below the previous valley.
→ Model 3 - Dropping Peak Reversal
The market forms a dropping peak, followed by a breakdown below the previous valley.
🔸 The fractal nature of markets
Rising wave
→ The rising wave is the entire bull market between turning points
High point : When the Main trend turns from upward to downward, the peak of the primary trend is formed.
Dropping wave
→ The Dropping wave is the entire bear market between turning points.
Low point : When the Main trend turns from downward to upward, the primary trend valley is formed.
Fractal nature application.
Everything in one picture.
🔹 Features
Strict adherence to the rules: Follows the Original Gann Swing Chart Rules to detect swing points.
Fractal analysis: Uses trend bars and fractal analysis to identify swing points.
Robust functionality: Engineered to handle complex market conditions with advanced logic.
Custom alerts: Alerts for peak/valley completion, main and primary trend reversals & continuations.
Golden rule application: Filters out non-trend bars by comparing only with the last trend bar.
Reversal & trend detection: Applies eight outside bar rules to detect trend reversals and continuations.
Dynamic customization: Fully customizable settings.
🔹 Settings overview
Fine-tune the indicator to match your unique trading strategy by adjusting trend settings, customizing alerts, and modifying visualization options.
1. Main trend settings
Hide/Show Main trend options: Instantly hide all main trend options (alerts remain separate).
Main trendline display & alerts: Toggle trendline visibility and set alerts for peaks and valleys.
Trendline customization: Adjust styles, colors, and slopes for upward/downward trends.
Peaks & Valleys markers: Show/hide points and customize their color and size.
Opposite Main trend turning points: Enable alerts and modify style, width, color, and offset.
Breakout/Breakdown points: Set alerts and customize their appearance.
2. Primary trend settings
Hide/Show primary trend options: Instantly hide all primary trend options (alerts remain separate).
Primary trendline display & alerts: Toggle trendline visibility and set alerts for peaks and valleys.
Trendline customization: Adjust styles, colors, and slopes for upward/downward trends.
Peaks & Valleys markers: Show/hide points and customize their color and size.
Opposite primary trend turning points: Enable alerts and modify style, width, color, and offset.
Breakout/Breakdown points: Set alerts and customize their appearance.
3. Additional options
Tooltips display: Control tooltip visibility for labels and languages.
Candle/Bar coloring: Customize candle and bar colors based on algorithm-selected trends.
🔸 Additional features
🔹Custom reading of bars.
The arrow represents the direction of the slope, the dot is the type of trend, and the line is the closing price.
🔹 Advanced Moving Average Activator
The Advanced Moving Average Activator, this setting calculates the average closing prices of trend bars only, which are the only bars considered by Gann.
The advantage of this method is that it helps avoid hidden bars that are not accounted for, making the difference more evident in a ranging market. The values are updated only when new highs or lows occur.
Additionally, you can set alerts when the price closes above or below the moving average.
🔹 Bar Counter
After a trend change, you can see exactly when the shift occurred and customize the type of trend you want to track.
For example, by conducting your own research on the assets you trade, based on historical data, you might discover valuable insights, such as the primary trend possibly lasting longer than 20 bars!
You can use these insights to refine your trading strategy and make more data-driven decisions.
🔹 How to use
Step 1: Configure the settings and choose your trading approach
Adjust the indicator settings to match your trading style and market conditions.
Effectively using the indicator starts with selecting your preferred trading style.
You can trade in alignment with the primary trend, capitalize on market reversals, or take advantage of breakouts.
Trading with the primary trend: Best for traders who prefer longer-term positions with higher stability.
Trading reversals: Ideal for those looking to enter at potential turning points but requires additional confirmation.
Trading breakouts: Suitable for traders targeting strong price movements after key level breakouts.
Adapting to market volatility: Monitor changing volatility and adjust your strategy accordingly for optimal results.
Step 2: Analyze the chart
Apply the indicator to your TradingView chart and interpret swing signals for informed decisions.
Carefully study the chart patterns to detect subtle signals.
Check if similar signals worked well in past market conditions.
Use multi-timeframe analysis for a broader perspective.
Step 3: Trade with the primary trend
Utilize trend direction to align trades with prevailing market movements.
Always trade in the direction of the primary trend.
Confirm the trend direction using multiple indicators or by relying on the primary trend as confirmation!.
Avoid trading against strong market momentum.
Step 4: Identify entry signals
Use indicator signals to identify ideal trade entry points.
Look for confirmation before entering a trade.
Wait for clear signals to avoid false entries.
Practice on a demo account to build confidence in your entry strategy.
Step 5: Apply risk management
Define stop-loss and take-profit levels to protect your capital effectively.
Set stop-loss orders at strategic levels to limit potential losses.
Risk only a small percentage of your capital per trade.
Adjust risk levels based on your overall portfolio performance.
Step 6: Confirm with trend analysis
Validate trends using additional indicators for a higher probability of success.
Use complementary tools to confirm trend direction.
Monitor trend changes to adjust your strategy promptly.
Keep an eye on volume indicators for added confirmation.
Step 7: Execute the trade
Enter trades based on confirmed signals and predefined strategy rules.
Ensure all your criteria are met before executing a trade.
Stay disciplined and stick to your strategy.
Review market conditions right before execution.
Step 8: Monitor the trade
Track trade performance and make adjustments as necessary.
Keep an eye on market conditions throughout the trade.
Be ready to adjust your strategy if unexpected events occur.
Use trailing stops to secure profits while allowing for gains.
Step 9: Implement exit strategy
Close trades strategically based on your pre-established exit plan.
Plan your exit strategy in advance and adhere to it.
Consider partial exits to secure profits along the way.
Avoid emotional decisions when closing trades.
Step 10: Review performance
Analyze past trades to continuously refine and improve your strategy.
Regularly review and document your trades for insights.
Identify patterns in both your successes and mistakes.
Update your strategy based on comprehensive performance reviews.
🔹 Disclosure
While this script is useful and provides insight into market tops, bottoms, and trend trading, it's critical to understand that past performance is not necessarily indicative of future results and there are many more factors that go into being a profitable trader.

Auto Fibonacci and Gann Fan/Retracements ComboIntroduction
This is a combination of Fibonacci and Gann fan/retracements.
The script can automatically draw as many:
Fibonacci Retracements
Fibonacci Fan
Gann Retracements
Gann Fan
as the user requires on the chart. Each level set or fan consists of 7 lines based on the most important ratios of Fibonacci/Gann.
Basics
What are Fibonacci retracements?
Fibonacci retracement levels are horizontal lines that indicate where support and resistance are likely to occur. They stem from Fibonacci’s sequence. Each level is associated with a percentage which is how much of a prior move the price has retraced. The Fibonacci retracement levels are 23.6%, 38.2%, 61.8%, and 78.6%. While not officially a Fibonacci ratio, 50% is also used. The indicator is useful because it can be drawn between any two significant price points, such as a high and a low. The indicator will then create the levels between those two points.
What are Gann retracements?
A developer of technical analysis and trading was W.D. Gann. Gann theory expects a normal retracement of 50 percent. This means that under normal selling pressure, the stock price will decline half the amount of its most recent rise, and vice versa. It also suggests that retracements occur at the halfway point of a move, such as 25 percent (half of 50 percent), 12.5 percent (half of 25 percent), and so on.
What is Fibonacci fan?
Fibonacci fan is a set of sequential trend lines drawn from a trough or peak through a set of points dictated by Fibonacci retracements. The first step to create it is to draw a trend line covering the local lowest and highest prices of a security. To reach retracement levels, the trader divides the difference in price at the low and high end by ratios determined by the Fibonacci series. The lines formed by connecting the starting point for the base trend line and each retracement level create the Fibonacci fan.
What is Gann fan?
A Gann fan consists of a series of lines called Gann angles. These angles are superimposed over a price chart to show potential support and resistance levels. The resulting image is supposed to help technical analysts predict price changes. Gann believed the 45-degree angle to be most important, but the Gann fan also draws angles at degrees like 75, 63.75, 26.25 and 15. The Gann fan originates at a low or high point. The resulting lines show areas of potential future support and resistance. The 45-degree line is known as the 1:1 line because the price will rise or fall at a 45-degree angle when the price moves up/down one unit for each unit of time. All other lines in the Gann fan are drawn above and below the 1:1 line. The other angles are associated with 2:1, 3:1, 4:1, 8:1 and 1:8, 1:4, 1:3, and 1:2 time-to-price moves.
Challenges
The most of the time I dedicated to writing this script has been spent on handling these problems:
1. Finding Local Highest/Lowest Prices
In order to draw Fibonacci and Gann fan/retracements, it's necessary to find local highest and lowest price points (Extrema) on the chart. As this could be so challenging, most traders and coders draw the lines covering the low and high prices over a given period of time or a limited number of bars back instead. I already wrote an indicator using this approach ( Auto Fibonacci Combo ).
In this new script I tried to find the exact highest and lowest prices based on this idea that: if a high point is formed lower than previous high which was after a lowest point, then that previous one was the local highest point, and vice versa if a low point is formed higher than previous low which was after a highest point, then that previous one was the local lowest point. So logically an extremum price on the chart won't be found until the next high/low point is formed.
2. Finding Proper Chart Scale for Gann Fan
Based on the theory, Gann angles are sensitive to the chart price scale and in order to have the right angles, the chart must be made with the proper scale. J.A. Hyerczyk in his book "Pattern, Price & Time - Using Gann Theory in Technical Analysis" suggests that the easiest way to determine the scale of a market is by taking the difference between top-to-top and bottom-to-bottom and dividing it by the time it took the market to move from top to top and bottom to bottom.
Thus on a properly constructed chart, the basic equation for calculating Gann angles is: Price * Time.
3. Drawing Fans and Relocating Fan Labels at Each New Bar in Pine (A Programming-Related Subject)
To do this, I used linear equations and line slopes. Of course it was so complicated and exhausting, but finally I overcame that thanks to my genius cousin.
Settings and Usage
By default, the script shows detected extremum points plus 1 Fibonacci fan, 1 Gann fan, 1 set of Fibonacci retracements and no Gann retracements on the chart. All of these could be changed in the indicator settings beside the color and transparency of each line.
Feel free to use this and send me your thoughts!

Dynamic GANN Square Of 9 BandsDynamic GANN Square Of 9 Bands
Created on 3 Sept 2023
Adjust Increment Value:
Customize increment to match symbol and price characteristics for accuracy.
Green Line:
200 EMA. Identifies trend direction; moves with the prevailing trend.
Red Lines:
Mark prominent reversal levels closer to the red range; ideal for mean reversion strategies.
Crossing red levels may indicate trend continuation to the next red level.
Grey Lines:
Show immediate target reversal levels; watch for potential reversals.
Key Features:
Levels are different from Standard Deviation Lines.
Levels remain fixed and parallel, unaffected by volatility.
Despite its dynamism, it can serve as a leading indicator, revealing potential trend changes.
Primarily designed for trend-following strategies.
Additional Tips:
Use additional confirmations
Manage predefined risk and quantity
Additional Resources:
GANN Square Of 9 Pivots:

WD Gann: Close Price X Bars Ago with Line or Candle PlotThis indicator is inspired by the principles of WD Gann, a legendary trader known for his groundbreaking methods in time and price analysis. It helps traders track the close price of a security from X bars ago, a technique that is often used to identify key price levels in relation to past price movements. This concept is essential for Gann’s market theories, which emphasize the relationship between time and price.
WD Gann’s analysis often revolved around specific numbers that he considered significant, many of which correspond to squared numbers (e.g., 1, 4, 9, 16, 25, 36, 49, 64, 81, 100, 121, 144, 169, 196, 225, 256, 289, 324, 361, 400, 441, 484, 529, 576, 625, 676, 729, 784, 841, 900, 961, 1024, 1089, 1156, 1225, 1296, 1369, 1444, 1521, 1600, 1681, 1764, 1849, 1936). These numbers are believed to represent natural rhythms and cycles in the market. This indicator can help you explore how past price levels align with these significant numbers, potentially revealing key price zones that could act as support, resistance, or reversal points.
Key Features:
- Historical Close Price Calculation: The indicator calculates and displays the close price of a security from X bars ago (where X is customizable). This method aligns with Gann's focus on price relationships over specific time intervals, providing traders with valuable reference points to assess market conditions.
- Customizable Plot Type: You can choose between two plot types for visualizing the historical close price:
- Line Plot: A simple line that represents the close price from X bars ago, ideal for those who prefer a clean and continuous representation.
- Candle Plot: Displays the close price as a candlestick chart, providing a more detailed view with open, high, low, and close prices from X bars ago.
- Candle Color Coding: For the candle plot type, the script color-codes the candles. Green candles appear when the close price from X bars ago is higher than the open price, indicating bullish sentiment; red candles appear when the close is lower, indicating bearish sentiment. This color coding gives a quick visual cue to market sentiment.
- Customizable Number of Bars: You can adjust the number of bars (X) to look back, providing flexibility for analyzing different timeframes. Whether you're conducting short-term or long-term analysis, this input can be fine-tuned to suit your trading strategy.
- Gann Method Application: WD Gann's methods involved analyzing price action over specific time periods to predict future movements. This indicator offers traders a way to assess how the price of a security has behaved in the past in relation to a chosen time interval, a critical concept in Gann's theories.
How to Use:
1. Input Settings:
- Number of Bars (X): Choose the number of bars to look back (e.g., 100, 200, or any custom period).
- Plot Type: Select whether to display the data as a Line or Candles.
2. Interpretation:
- Using the Line plot, observe how the close price from X bars ago compares to the current market price.
- Using the Candles plot, analyze the full price action of the chosen bar from X bars ago, noting how the close price relates to the open, high, and low of that bar.
3. Gann Analysis: Integrate this indicator into your broader Gann-based analysis. By looking at past price levels and their relationship to significant squared numbers, traders can uncover potential key levels of support and resistance or even potential reversal points. The historical close price can act as a benchmark for predicting future market movements.
Suggestions on WD Gann's Emphasis in Trading:
WD Gann’s trading methods were rooted in several key principles that emphasized the relationship between time and price. These principles are vital to understanding how the "Close Price X Bars Ago" indicator fits into his overall analysis:
1. Time Cycles: Gann believed that markets move in cyclical patterns. By studying price levels from specific time intervals, traders can spot these cycles and predict future market behavior. This indicator allows you to see how the close price from X bars ago relates to current market conditions, helping to spot cyclical highs and lows.
2. Price and Time Squaring: A core concept in Gann’s theory is that certain price levels and time periods align, often marking significant reversal points. The squared numbers (e.g., 1, 4, 9, 16, 25, etc.) serve as potential key levels where price and time might "square" to create support or resistance. This indicator helps traders spot these historical price levels and their potential relevance to future price action.
3. Geometric Angles: Gann used angles (like the 45-degree angle) to predict market movements, with the belief that prices move at specific geometric angles over time. This indicator gives traders a reference for past price levels, which could align with key angles, helping traders predict future price movement based on Gann's geometry.
4. Numerology and Key Intervals: Gann paid particular attention to numbers that held significance, including squared numbers and numbers related to the Fibonacci sequence. This indicator allows traders to analyze price levels based on these key numbers, which can help in identifying potential turning points in the market.
5. Support and Resistance Levels: Gann’s methods often involved identifying levels of support and resistance based on past price action. By tracking the close price from X bars ago, traders can identify past support and resistance levels that may become significant again in future market conditions.
Perfect for:
Traders using WD Gann’s methods, such as Gann angles, time cycles, and price theory.
Analysts who focus on historical price levels to predict future price action.
Those who rely on numerology and geometric principles in their trading strategies.
By integrating this indicator into your trading strategy, you gain a powerful tool for analyzing market cycles and price movements in relation to key time intervals. The ability to track and compare the historical close price to significant numbers—like Gann’s squared numbers—can provide valuable insights into potential support, resistance, and reversal points.
Disclaimer:
This indicator is based on the methods and principles of WD Gann and is for educational purposes only. It is not intended as financial advice. Trading involves significant risk, and you should not trade with money that you cannot afford to lose. Past performance is not indicative of future results. The use of this indicator is at your own discretion and risk. Always do your own research and consider consulting a licensed financial advisor before making any investment decisions.

DDS GANN LEVELS v1.0This is the script to provide you Gann Levels between High and Low range from given zeo price levels.
First set the Zero Degree price level in input,then set the high low average.
The 360 degree levels positive and negative side will be plotted from the given price level.
Thanks, hope you like the script, all suggestions will be welcome

Price Angles & Gann Star By Se7s - V2the 2nd version of the (Price Angles & Gann Star By Se7s )
An indicator to draw :-
1-price angles given the cycle start point, cycle type ( bullish / bearish ) , spacing
and shape (Circle,StrightLine,Triangle,Square,Pentagon )
shapes (Hexagon, Heptagon, Octagon, Nonagon, Decagon ) will be added later .
2-time levels .
3-Draw Price Channel .
4-Draw Gann Star .
5-Multi-time frame feature Added .
6-Fan .
you can customize all colors and text positions.
you can offset the time-levels starting point .
--------------------------
What's new in V2
- You can Calculate Angles By Averages or by the formula .
- You can draw more than one cycle (360°)
- You can type the starting date manually ( use it if the indicator is unable to find your starting point )
-You can type your first angle manually (Custom Angle)
- You can draw Gann Star on 360° or 720°
--------------------------
The script is free !!
just add it to your favorite and start using it .
your suggestions and feedback are very appreciated .

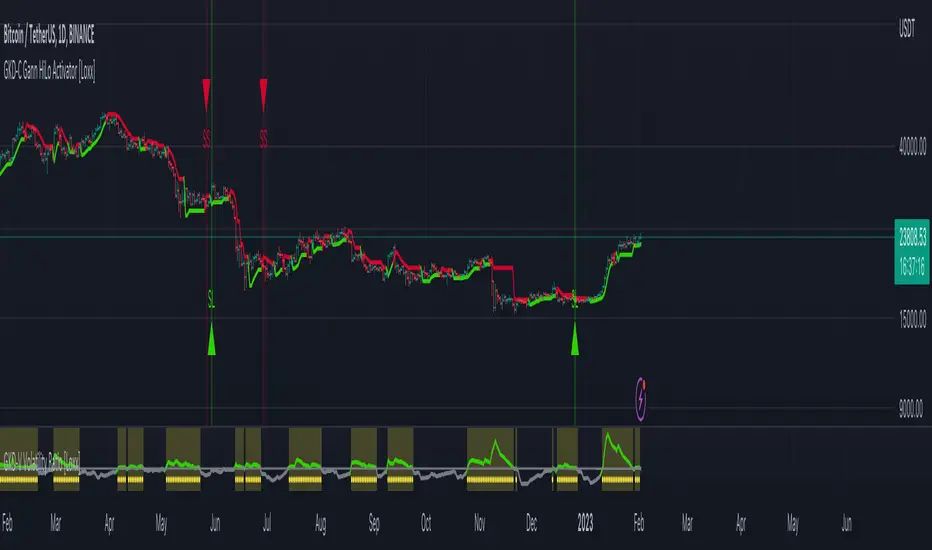
GKD-C Gann HiLo Activator [Loxx]Giga Kaleidoscope Gann HiLo Activator Averages is a Confirmation module included in Loxx's "Giga Kaleidoscope Modularized Trading System".
█ Giga Kaleidoscope Modularized Trading System
What is Loxx's "Giga Kaleidoscope Modularized Trading System"?
The Giga Kaleidoscope Modularized Trading System is a trading system built on the philosophy of the NNFX (No Nonsense Forex) algorithmic trading.
What is an NNFX algorithmic trading strategy?
The NNFX algorithm is built on the principles of trend, momentum, and volatility. There are six core components in the NNFX trading algorithm:
1. Volatility - price volatility; e.g., Average True Range, True Range Double, Close-to-Close, etc.
2. Baseline - a moving average to identify price trend
3. Confirmation 1 - a technical indicator used to identify trends
4. Confirmation 2 - a technical indicator used to identify trends
5. Continuation - a technical indicator used to identify trends
6. Volatility/Volume - a technical indicator used to identify volatility/volume breakouts/breakdown
7. Exit - a technical indicator used to determine when a trend is exhausted
How does Loxx's GKD (Giga Kaleidoscope Modularized Trading System) implement the NNFX algorithm outlined above?
Loxx's GKD v1.0 system has five types of modules (indicators/strategies). These modules are:
1. GKD-BT - Backtesting module (Volatility, Number 1 in the NNFX algorithm)
2. GKD-B - Baseline module (Baseline and Volatility/Volume, Numbers 1 and 2 in the NNFX algorithm)
3. GKD-C - Confirmation 1/2 and Continuation module (Confirmation 1/2 and Continuation, Numbers 3, 4, and 5 in the NNFX algorithm)
4. GKD-V - Volatility/Volume module (Confirmation 1/2, Number 6 in the NNFX algorithm)
5. GKD-E - Exit module (Exit, Number 7 in the NNFX algorithm)
(additional module types will added in future releases)
Each module interacts with every module by passing data between modules. Data is passed between each module as described below:
GKD-B => GKD-V => GKD-C(1) => GKD-C(2) => GKD-C(Continuation) => GKD-E => GKD-BT
That is, the Baseline indicator passes its data to Volatility/Volume. The Volatility/Volume indicator passes its values to the Confirmation 1 indicator. The Confirmation 1 indicator passes its values to the Confirmation 2 indicator. The Confirmation 2 indicator passes its values to the Continuation indicator. The Continuation indicator passes its values to the Exit indicator, and finally, the Exit indicator passes its values to the Backtest strategy.
This chaining of indicators requires that each module conform to Loxx's GKD protocol, therefore allowing for the testing of every possible combination of technical indicators that make up the six components of the NNFX algorithm.
What does the application of the GKD trading system look like?
Example trading system:
Backtest: Strategy with 1-3 take profits, trailing stop loss, multiple types of PnL volatility, and 2 backtesting styles
Baseline: Hull Moving Average
Volatility/Volume: Volatility Ratio as shown on the chart above
Confirmation 1: Gann HiLo Activator Averages as shown on the chart above
Confirmation 2: Williams Percent Range
Continuation: Fisher Transform
Exit: Rex Oscillator
Each GKD indicator is denoted with a module identifier of either: GKD-BT, GKD-B, GKD-C, GKD-V, or GKD-E. This allows traders to understand to which module each indicator belongs and where each indicator fits into the GKD protocol chain.
Giga Kaleidoscope Modularized Trading System Signals (based on the NNFX algorithm)
Standard Entry
1. GKD-C Confirmation 1 Signal
2. GKD-B Baseline agrees
3. Price is within a range of 0.2x Volatility and 1.0x Volatility of the Goldie Locks Mean
4. GKD-C Confirmation 2 agrees
5. GKD-V Volatility/Volume agrees
Baseline Entry
1. GKD-B Baseline signal
2. GKD-C Confirmation 1 agrees
3. Price is within a range of 0.2x Volatility and 1.0x Volatility of the Goldie Locks Mean
4. GKD-C Confirmation 2 agrees
5. GKD-V Volatility/Volume agrees
6. GKD-C Confirmation 1 signal was less than 7 candles prior
Continuation Entry
1. Standard Entry, Baseline Entry, or Pullback; entry triggered previously
2. GKD-B Baseline hasn't crossed since entry signal trigger
3. GKD-C Confirmation Continuation Indicator signals
4. GKD-C Confirmation 1 agrees
5. GKD-B Baseline agrees
6. GKD-C Confirmation 2 agrees
1-Candle Rule Standard Entry
1. GKD-C Confirmation 1 signal
2. GKD-B Baseline agrees
3. Price is within a range of 0.2x Volatility and 1.0x Volatility of the Goldie Locks Mean
Next Candle:
1. Price retraced (Long: close < close or Short: close > close )
2. GKD-B Baseline agrees
3. GKD-C Confirmation 1 agrees
4. GKD-C Confirmation 2 agrees
5. GKD-V Volatility/Volume agrees
1-Candle Rule Baseline Entry
1. GKD-B Baseline signal
2. GKD-C Confirmation 1 agrees
3. Price is within a range of 0.2x Volatility and 1.0x Volatility of the Goldie Locks Mean
4. GKD-C Confirmation 1 signal was less than 7 candles prior
Next Candle:
1. Price retraced (Long: close < close or Short: close > close )
2. GKD-B Baseline agrees
3. GKD-C Confirmation 1 agrees
4. GKD-C Confirmation 2 agrees
5. GKD-V Volatility/Volume Agrees
PullBack Entry
1. GKD-B Baseline signal
2. GKD-C Confirmation 1 agrees
3. Price is beyond 1.0x Volatility of Baseline
Next Candle:
1. Price is within a range of 0.2x Volatility and 1.0x Volatility of the Goldie Locks Mean
3. GKD-C Confirmation 1 agrees
4. GKD-C Confirmation 2 agrees
5. GKD-V Volatility/Volume Agrees
█ Gann HiLo Activator Averages
What is Gann HiLo Activator Averages?
Developed by Robert Krausz, the Gann HiLo Activator is a trend-following technical indicator used to help determine the trends direction and to generate with-trend entry signals. It is best combined with the Gann Swing Indicator and the Gann Trend Indicator (will be reviewed in the following articles) as part of a trading system, commonly known as the “New Gann Swing Chartist Plan”.
The Gann HiLo Activator is a simple moving average of the previous three periods highs or lows. Based on the moving averages logic, it is a trend-following indicator used to reflect the markets direction of movement. Within the trading system we mentioned earlier, the Gann HiLo activator is responsible for generating entry signals, but also helps determine stop-loss levels. Here is how it looks in a trading platform.
This version has 62 Moving Averages to choose from.
Requirements
Inputs
Confirmation 1 and Solo Confirmation: GKD-V Volatility / Volume indicator
Confirmation 2: GKD-C Confirmation indicator
Outputs
Confirmation 2 and Solo Confirmation: GKD-E Exit indicator
Confirmation 1: GKD-C Confirmation indicator
Continuation: GKD-E Exit indicator
Additional features will be added in future releases.