Gann Price VibrationsCurrently there is no Script available for drawing Price Vibrations based on Gann theory. I have attempted to fill this gap. This indicator will draw Cycle lines based on Gann Theory. This is vey basic one. It draws lines at start/end of every cycle. One cycle is 360 degrees. Based on feedback, it will be upgraded further with lower Angles 90/180/270 degrees movement.
How to use it ? Once you load the indicator on the chart, edit settings and give current market price of Stock you are watching.
Example: If you are watching Reliance share price on chart, go to indicators/Public/Gann Price Vibrations. Once indicator is loaded, edit input Price as 2200. Then indicator will draw cycle lines.
How to trade ? Generally, it is assumed that stock prices move in cycles. Prices spend more time near these lines. So, if you find UP or Down breakout from cycle lines, take entry. For Long trade, Target is next upper line and stop loss is one line below. Similarly, for short trade, Target is next below line and stop loss is upper line. Just notice, how RIL is moving exactly within these cycles.
If you want to study historical charts, you need to enter Price value closer to that date.
Please Like it/Share it
"gann" için komut dosyalarını ara

Gann Swing Oscillator The Gann Swing Oscillator has been adapted from Robert Krausz's book,
"A W.D. Gann Treasure Discovered". The Gann Swing Oscillator helps
define market swings.

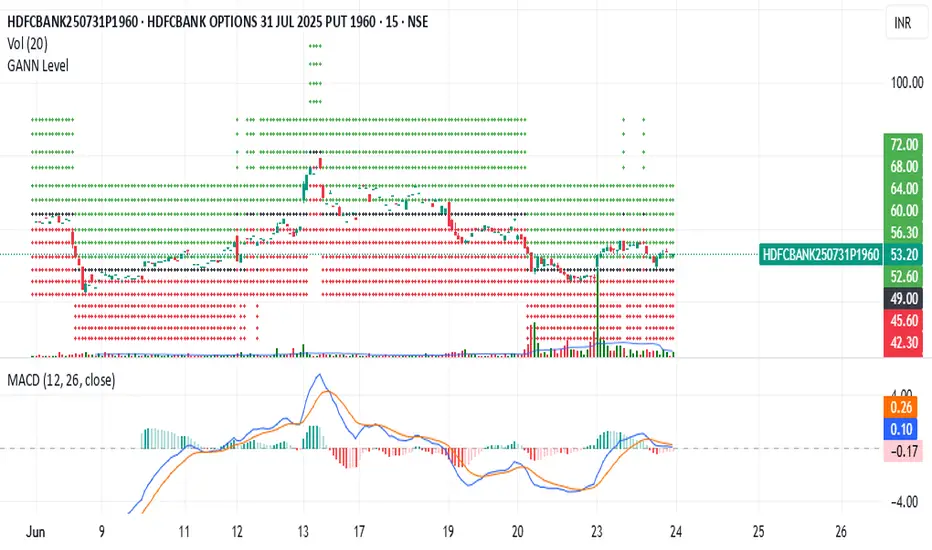
Gann Percentage of High & Low Prices for Options - Keanu_RiTzThis Indicator is based on the text from Chapter 4 "Percentage of High & Low Prices" page number "30" from the book "WD Gann 45 years in Wall Street".
This Indicator is to be used on Intraday Timeframes and only on Options Charts (CALL & PUT) and not on any other chart.
The following is the text from that page :-
One of the greatest discoveries I ever made was how to figure the percentage of high and low prices on the averages and individual stocks.
The percentages of extreme high and low levels indicate future resistance levels.
There is a relation between every low price to some future high price and a percentage of the low price indicates what levels to expect the next high price.
At this price you can sell out long stocks and sell short with a limited risk.
The extreme high price or any minor tops are related to future bottoms er low levels.
The percentage of the high price tells where to expect low prices in the future and gives you resistance levels where you can buy with a limited risk.
The most important resistance level is 50% of any high or low price.
Second in importance is 100% on the lowest selling price on the averages or individual stocks.
You must also use 200%, 300%, 400%, 500%, 600% or more, depending upon the price and the Time Periods from High and Low.
Third in importance is 25% of the Lowest price or the Highest price.
Fourth in importance is 121/2% of the extreme Low or extreme High price.
Fifth in importance is 61/4% of the Highest price, but this is only to be used when the averages or individual stocks are selling at very high levels.
Sixth in importance is 33 1/3 and 66 2/3%. These percentages should be calculated and watched for resistance next after 25% and after 50%.
You should always have percentage tables made up on the Industrial Averages and on the individual stocks you trade in in order to know where these important resistance levels are located.
Description :
It plots the Intraday % levels from the highest high and lowest low of that day.
The calculation of these levels is based on the text from Chapter 4 "Percentage of High & Low Prices" page number "30" from the book "WD Gann 45 years in Wall Street".
I developed this indicator to see if those percentages work on Options prices or not,
and from my observation I found that it works wonderfully in Options as well.
These % levels work like magic and act as great Dynamic Support and Resistance levels.
Don't trust my words blindly and see for yourself.
This indicator is for educational and research purpose only.
It does not provide any BUY/SELL signals.

Gann Swing PointsIndicator Logic
This is a GANN-style swing indicator that classifies bars based on their high/low structure relative to the previous bar.
I strongly encourage you to replay bars on Tradingview using this indicator to get a sense of how it creates pivot (or swing) points
Bar Classification:
Up-Bar (direction: 'up'): Higher High and Higher Low (HH/HL)
Down-Bar (direction: 'down'): Lower High and Lower Low (LH/LL)
Outside-Bar (generates 2 directions):
Green: 'down' then 'up'
Red: 'up' then 'down'
Inside-Bar: No direction generated (HL/LH)
Swing Line Logic
The swing line continues in the current direction until n opposite directions are detected.
n is the "n-direction" parameter (commonly set to 2, so 2 consecutive opposite direction is needed to turn the swing)
When n opposing directions occur, the swing turns, creating a pivot point
Inside bar is ignored, so e.g up-bar -> inside-bar -> up-bar generates "up", "up" direction
A top pivot is formed when the swing turns down
A bottom pivot is formed when it turns up
Note: This swing logic is inherently lagging — it only confirms tops/bottoms after the fact
This swing structure gives the system a clear and noise-resistant way to identify pivot points (swing-points)

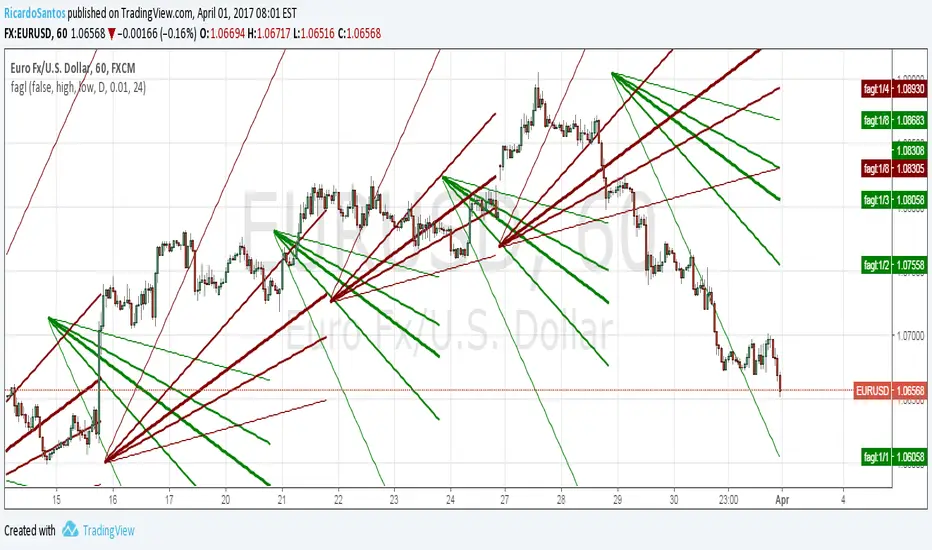
Auto Fibonacci and Gann Fan/Retracements ComboIntroduction
This is a combination of Fibonacci and Gann fan/retracements.
The script can automatically draw as many:
Fibonacci Retracements
Fibonacci Fan
Gann Retracements
Gann Fan
as the user requires on the chart. Each level set or fan consists of 7 lines based on the most important ratios of Fibonacci/Gann.
Basics
What are Fibonacci retracements?
Fibonacci retracement levels are horizontal lines that indicate where support and resistance are likely to occur. They stem from Fibonacci’s sequence. Each level is associated with a percentage which is how much of a prior move the price has retraced. The Fibonacci retracement levels are 23.6%, 38.2%, 61.8%, and 78.6%. While not officially a Fibonacci ratio, 50% is also used. The indicator is useful because it can be drawn between any two significant price points, such as a high and a low. The indicator will then create the levels between those two points.
What are Gann retracements?
A developer of technical analysis and trading was W.D. Gann. Gann theory expects a normal retracement of 50 percent. This means that under normal selling pressure, the stock price will decline half the amount of its most recent rise, and vice versa. It also suggests that retracements occur at the halfway point of a move, such as 25 percent (half of 50 percent), 12.5 percent (half of 25 percent), and so on.
What is Fibonacci fan?
Fibonacci fan is a set of sequential trend lines drawn from a trough or peak through a set of points dictated by Fibonacci retracements. The first step to create it is to draw a trend line covering the local lowest and highest prices of a security. To reach retracement levels, the trader divides the difference in price at the low and high end by ratios determined by the Fibonacci series. The lines formed by connecting the starting point for the base trend line and each retracement level create the Fibonacci fan.
What is Gann fan?
A Gann fan consists of a series of lines called Gann angles. These angles are superimposed over a price chart to show potential support and resistance levels. The resulting image is supposed to help technical analysts predict price changes. Gann believed the 45-degree angle to be most important, but the Gann fan also draws angles at degrees like 75, 63.75, 26.25 and 15. The Gann fan originates at a low or high point. The resulting lines show areas of potential future support and resistance. The 45-degree line is known as the 1:1 line because the price will rise or fall at a 45-degree angle when the price moves up/down one unit for each unit of time. All other lines in the Gann fan are drawn above and below the 1:1 line. The other angles are associated with 2:1, 3:1, 4:1, 8:1 and 1:8, 1:4, 1:3, and 1:2 time-to-price moves.
Challenges
The most of the time I dedicated to writing this script has been spent on handling these problems:
1. Finding Local Highest/Lowest Prices
In order to draw Fibonacci and Gann fan/retracements, it's necessary to find local highest and lowest price points (Extrema) on the chart. As this could be so challenging, most traders and coders draw the lines covering the low and high prices over a given period of time or a limited number of bars back instead. I already wrote an indicator using this approach ( Auto Fibonacci Combo ).
In this new script I tried to find the exact highest and lowest prices based on this idea that: if a high point is formed lower than previous high which was after a lowest point, then that previous one was the local highest point, and vice versa if a low point is formed higher than previous low which was after a highest point, then that previous one was the local lowest point. So logically an extremum price on the chart won't be found until the next high/low point is formed.
2. Finding Proper Chart Scale for Gann Fan
Based on the theory, Gann angles are sensitive to the chart price scale and in order to have the right angles, the chart must be made with the proper scale. J.A. Hyerczyk in his book "Pattern, Price & Time - Using Gann Theory in Technical Analysis" suggests that the easiest way to determine the scale of a market is by taking the difference between top-to-top and bottom-to-bottom and dividing it by the time it took the market to move from top to top and bottom to bottom.
Thus on a properly constructed chart, the basic equation for calculating Gann angles is: Price * Time.
3. Drawing Fans and Relocating Fan Labels at Each New Bar in Pine (A Programming-Related Subject)
To do this, I used linear equations and line slopes. Of course it was so complicated and exhausting, but finally I overcame that thanks to my genius cousin.
Settings and Usage
By default, the script shows detected extremum points plus 1 Fibonacci fan, 1 Gann fan, 1 set of Fibonacci retracements and no Gann retracements on the chart. All of these could be changed in the indicator settings beside the color and transparency of each line.
Feel free to use this and send me your thoughts!

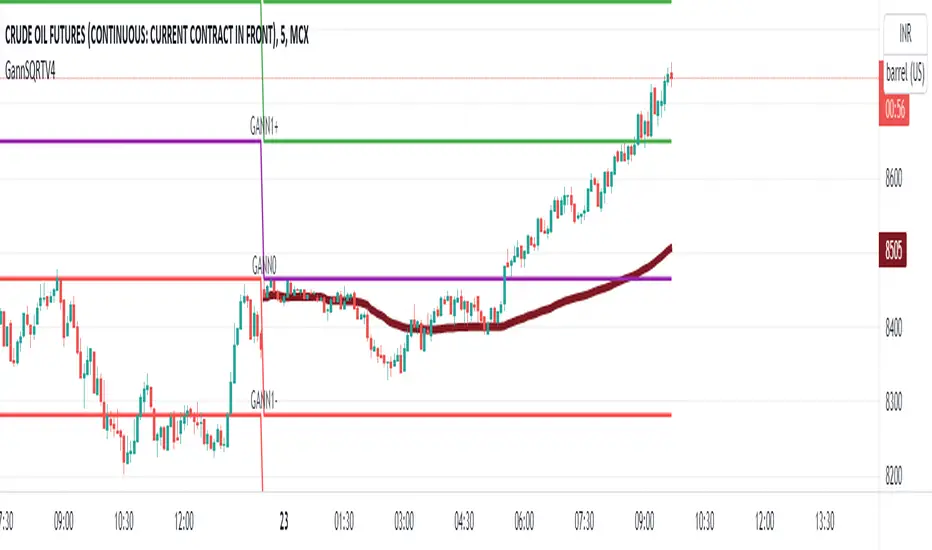
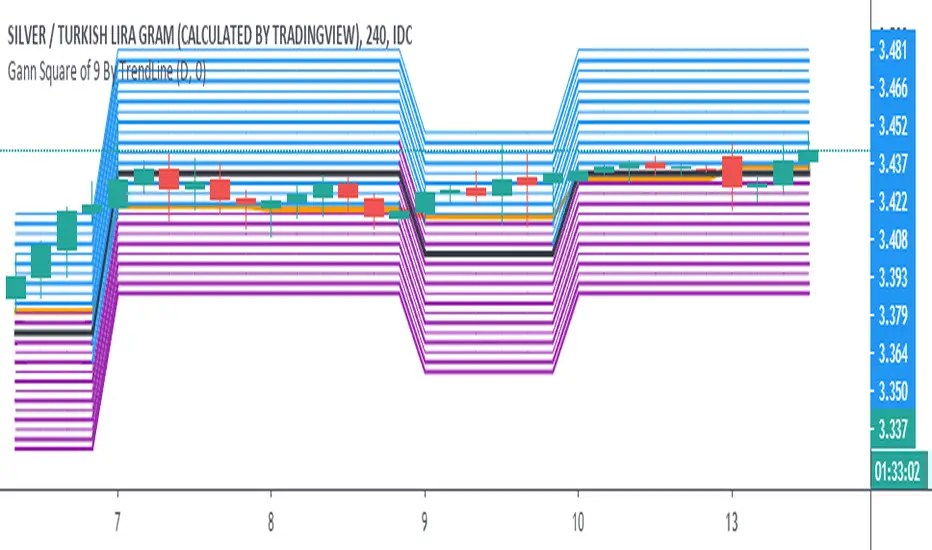
Dynamic GANN Square Of 9 BandsDynamic GANN Square Of 9 Bands
Created on 3 Sept 2023
Adjust Increment Value:
Customize increment to match symbol and price characteristics for accuracy.
Green Line:
200 EMA. Identifies trend direction; moves with the prevailing trend.
Red Lines:
Mark prominent reversal levels closer to the red range; ideal for mean reversion strategies.
Crossing red levels may indicate trend continuation to the next red level.
Grey Lines:
Show immediate target reversal levels; watch for potential reversals.
Key Features:
Levels are different from Standard Deviation Lines.
Levels remain fixed and parallel, unaffected by volatility.
Despite its dynamism, it can serve as a leading indicator, revealing potential trend changes.
Primarily designed for trend-following strategies.
Additional Tips:
Use additional confirmations
Manage predefined risk and quantity
Additional Resources:
GANN Square Of 9 Pivots:

WD Gann: Close Price X Bars Ago with Line or Candle PlotThis indicator is inspired by the principles of WD Gann, a legendary trader known for his groundbreaking methods in time and price analysis. It helps traders track the close price of a security from X bars ago, a technique that is often used to identify key price levels in relation to past price movements. This concept is essential for Gann’s market theories, which emphasize the relationship between time and price.
WD Gann’s analysis often revolved around specific numbers that he considered significant, many of which correspond to squared numbers (e.g., 1, 4, 9, 16, 25, 36, 49, 64, 81, 100, 121, 144, 169, 196, 225, 256, 289, 324, 361, 400, 441, 484, 529, 576, 625, 676, 729, 784, 841, 900, 961, 1024, 1089, 1156, 1225, 1296, 1369, 1444, 1521, 1600, 1681, 1764, 1849, 1936). These numbers are believed to represent natural rhythms and cycles in the market. This indicator can help you explore how past price levels align with these significant numbers, potentially revealing key price zones that could act as support, resistance, or reversal points.
Key Features:
- Historical Close Price Calculation: The indicator calculates and displays the close price of a security from X bars ago (where X is customizable). This method aligns with Gann's focus on price relationships over specific time intervals, providing traders with valuable reference points to assess market conditions.
- Customizable Plot Type: You can choose between two plot types for visualizing the historical close price:
- Line Plot: A simple line that represents the close price from X bars ago, ideal for those who prefer a clean and continuous representation.
- Candle Plot: Displays the close price as a candlestick chart, providing a more detailed view with open, high, low, and close prices from X bars ago.
- Candle Color Coding: For the candle plot type, the script color-codes the candles. Green candles appear when the close price from X bars ago is higher than the open price, indicating bullish sentiment; red candles appear when the close is lower, indicating bearish sentiment. This color coding gives a quick visual cue to market sentiment.
- Customizable Number of Bars: You can adjust the number of bars (X) to look back, providing flexibility for analyzing different timeframes. Whether you're conducting short-term or long-term analysis, this input can be fine-tuned to suit your trading strategy.
- Gann Method Application: WD Gann's methods involved analyzing price action over specific time periods to predict future movements. This indicator offers traders a way to assess how the price of a security has behaved in the past in relation to a chosen time interval, a critical concept in Gann's theories.
How to Use:
1. Input Settings:
- Number of Bars (X): Choose the number of bars to look back (e.g., 100, 200, or any custom period).
- Plot Type: Select whether to display the data as a Line or Candles.
2. Interpretation:
- Using the Line plot, observe how the close price from X bars ago compares to the current market price.
- Using the Candles plot, analyze the full price action of the chosen bar from X bars ago, noting how the close price relates to the open, high, and low of that bar.
3. Gann Analysis: Integrate this indicator into your broader Gann-based analysis. By looking at past price levels and their relationship to significant squared numbers, traders can uncover potential key levels of support and resistance or even potential reversal points. The historical close price can act as a benchmark for predicting future market movements.
Suggestions on WD Gann's Emphasis in Trading:
WD Gann’s trading methods were rooted in several key principles that emphasized the relationship between time and price. These principles are vital to understanding how the "Close Price X Bars Ago" indicator fits into his overall analysis:
1. Time Cycles: Gann believed that markets move in cyclical patterns. By studying price levels from specific time intervals, traders can spot these cycles and predict future market behavior. This indicator allows you to see how the close price from X bars ago relates to current market conditions, helping to spot cyclical highs and lows.
2. Price and Time Squaring: A core concept in Gann’s theory is that certain price levels and time periods align, often marking significant reversal points. The squared numbers (e.g., 1, 4, 9, 16, 25, etc.) serve as potential key levels where price and time might "square" to create support or resistance. This indicator helps traders spot these historical price levels and their potential relevance to future price action.
3. Geometric Angles: Gann used angles (like the 45-degree angle) to predict market movements, with the belief that prices move at specific geometric angles over time. This indicator gives traders a reference for past price levels, which could align with key angles, helping traders predict future price movement based on Gann's geometry.
4. Numerology and Key Intervals: Gann paid particular attention to numbers that held significance, including squared numbers and numbers related to the Fibonacci sequence. This indicator allows traders to analyze price levels based on these key numbers, which can help in identifying potential turning points in the market.
5. Support and Resistance Levels: Gann’s methods often involved identifying levels of support and resistance based on past price action. By tracking the close price from X bars ago, traders can identify past support and resistance levels that may become significant again in future market conditions.
Perfect for:
Traders using WD Gann’s methods, such as Gann angles, time cycles, and price theory.
Analysts who focus on historical price levels to predict future price action.
Those who rely on numerology and geometric principles in their trading strategies.
By integrating this indicator into your trading strategy, you gain a powerful tool for analyzing market cycles and price movements in relation to key time intervals. The ability to track and compare the historical close price to significant numbers—like Gann’s squared numbers—can provide valuable insights into potential support, resistance, and reversal points.
Disclaimer:
This indicator is based on the methods and principles of WD Gann and is for educational purposes only. It is not intended as financial advice. Trading involves significant risk, and you should not trade with money that you cannot afford to lose. Past performance is not indicative of future results. The use of this indicator is at your own discretion and risk. Always do your own research and consider consulting a licensed financial advisor before making any investment decisions.

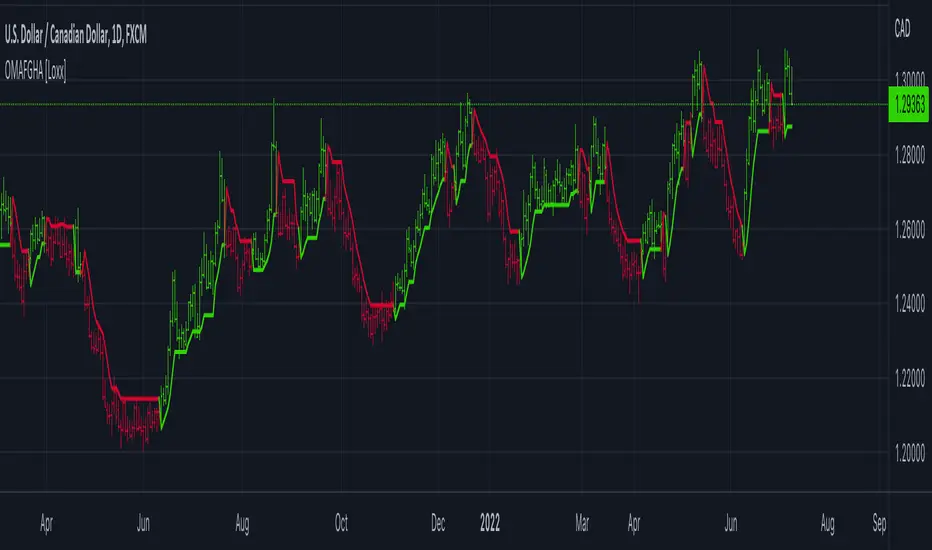
OMA-Filtered, Gann HiLo Activator [Loxx]OMA-Filtered, Gann HiLo Activator is a Gann HiLo activator that uses OMA filtering instead SMA filtering. This GHA calculation also includes a variable for close period to further tune the indicator.
What is Gann HiLo?
The HiLo Activator study is a trend-following indicator introduced by Robert Krausz as part of the Gann Swing trading strategy. In addition to indicating the current trend direction, this can be used as both entry signal and trailing stop.
Here is how the HiLo Activator is calculated:
1. The system calculates the moving averages of the high and low prices over the last several candles. By default, the average is calculated using the last three candles.
2. If the close price falls below the average low or rises above the average high, the system plots the opposite moving average. For example, if the price crosses above the average high, the system will plot the average low. If the price crosses below the average low afterward, the system will stop plotting the average low and will start plotting the average high, and so forth .
The plot of the HiLo Activator thus consists of sections on the top and bottom of the price plot. The sections on the bottom signify bullish trending conditions. Vice versa, those on the top signify the bearish conditions.
Included
-Toggle bar color on/off
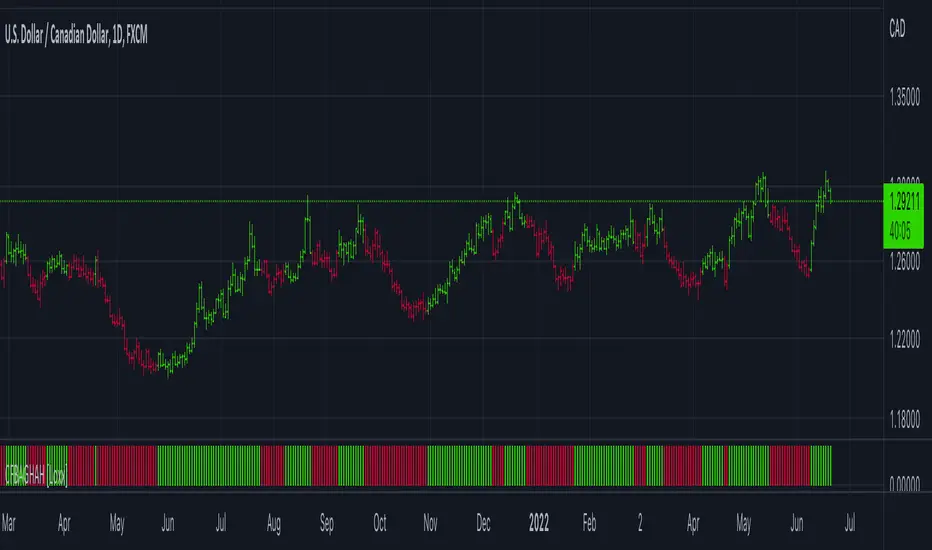
CFB Adaptive Gann HiLo Activator Histogram [Loxx]CFB Adaptive Gann HiLo Activator Histogram is a Composite-Fractal-Behavior-adaptive Gann HiLo activator in histogram form that has been smoothed using Jurik Filtering to reduce noise and better identify trending markets. This indicator is the CFB adaptive version of Jurik-Filtered, Gann HiLo Activator .
What is Gann HiLo
The HiLo Activator study is a trend-following indicator introduced by Robert Krausz as part of the Gann Swing trading strategy. In addition to indicating the current trend direction, this can be used as both entry signal and trailing stop.
Here is how the HiLo Activator is calculated:
1. The system calculates the moving averages of the high and low prices over the last several candles. By default, the average is calculated using the last three candles.
2. If the close price falls below the average low or rises above the average high, the system plots the opposite moving average. For example, if the price crosses above the average high, the system will plot the average low. If the price crosses below the average low afterward, the system will stop plotting the average low and will start plotting the average high, and so forth .
The plot of the HiLo Activator thus consists of sections on the top and bottom of the price plot. The sections on the bottom signify bullish trending conditions. Vice versa, those on the top signify the bearish conditions.
What is Composite Fractal Behavior ( CFB )?
All around you mechanisms adjust themselves to their environment. From simple thermostats that react to air temperature to computer chips in modern cars that respond to changes in engine temperature, r.p.m.'s, torque, and throttle position. It was only a matter of time before fast desktop computers applied the mathematics of self-adjustment to systems that trade the financial markets.
Unlike basic systems with fixed formulas, an adaptive system adjusts its own equations. For example, start with a basic channel breakout system that uses the highest closing price of the last N bars as a threshold for detecting breakouts on the up side. An adaptive and improved version of this system would adjust N according to market conditions, such as momentum, price volatility or acceleration.
Since many systems are based directly or indirectly on cycles, another useful measure of market condition is the periodic length of a price chart's dominant cycle, (DC), that cycle with the greatest influence on price action.
The utility of this new DC measure was noted by author Murray Ruggiero in the January '96 issue of Futures Magazine. In it. Mr. Ruggiero used it to adaptive adjust the value of N in a channel breakout system. He then simulated trading 15 years of D-Mark futures in order to compare its performance to a similar system that had a fixed optimal value of N. The adaptive version produced 20% more profit!
This DC index utilized the popular MESA algorithm (a formulation by John Ehlers adapted from Burg's maximum entropy algorithm, MEM). Unfortunately, the DC approach is problematic when the market has no real dominant cycle momentum, because the mathematics will produce a value whether or not one actually exists! Therefore, we developed a proprietary indicator that does not presuppose the presence of market cycles. It's called CFB (Composite Fractal Behavior) and it works well whether or not the market is cyclic.
CFB examines price action for a particular fractal pattern, categorizes them by size, and then outputs a composite fractal size index. This index is smooth, timely and accurate
Essentially, CFB reveals the length of the market's trending action time frame. Long trending activity produces a large CFB index and short choppy action produces a small index value. Investors have found many applications for CFB which involve scaling other existing technical indicators adaptively, on a bar-to-bar basis.
What is Jurik Volty used in the Juirk Filter?
One of the lesser known qualities of Juirk smoothing is that the Jurik smoothing process is adaptive. "Jurik Volty" (a sort of market volatility ) is what makes Jurik smoothing adaptive. The Jurik Volty calculation can be used as both a standalone indicator and to smooth other indicators that you wish to make adaptive.
What is the Jurik Moving Average?
Have you noticed how moving averages add some lag (delay) to your signals? ... especially when price gaps up or down in a big move, and you are waiting for your moving average to catch up? Wait no more! JMA eliminates this problem forever and gives you the best of both worlds: low lag and smooth lines.
Ideally, you would like a filtered signal to be both smooth and lag-free. Lag causes delays in your trades, and increasing lag in your indicators typically result in lower profits. In other words, late comers get what's left on the table after the feast has already begun.
Included
-Toggle bar color on/off
CFB Adaptive, Jurik-Filtered Gann HiLo Activator [Loxx]CFB Adaptive, Jurik-Filtered Gann HiLo Activator is a Composite-Fractal-Behavior-adaptive Gann HiLo activator that has been smoothed using Jurik Filtering to reduce noise and better identify trending markets. This indicator is the CFB adaptive version of Jurik-Filtered, Gann HiLo Activator .
What is Gann HiLo
The HiLo Activator study is a trend-following indicator introduced by Robert Krausz as part of the Gann Swing trading strategy. In addition to indicating the current trend direction, this can be used as both entry signal and trailing stop.
Here is how the HiLo Activator is calculated:
1. The system calculates the moving averages of the high and low prices over the last several candles. By default, the average is calculated using the last three candles.
2. If the close price falls below the average low or rises above the average high, the system plots the opposite moving average. For example, if the price crosses above the average high, the system will plot the average low. If the price crosses below the average low afterward, the system will stop plotting the average low and will start plotting the average high, and so forth .
The plot of the HiLo Activator thus consists of sections on the top and bottom of the price plot. The sections on the bottom signify bullish trending conditions. Vice versa, those on the top signify the bearish conditions.
What is Composite Fractal Behavior (CFB)?
All around you mechanisms adjust themselves to their environment. From simple thermostats that react to air temperature to computer chips in modern cars that respond to changes in engine temperature, r.p.m.'s, torque, and throttle position. It was only a matter of time before fast desktop computers applied the mathematics of self-adjustment to systems that trade the financial markets.
Unlike basic systems with fixed formulas, an adaptive system adjusts its own equations. For example, start with a basic channel breakout system that uses the highest closing price of the last N bars as a threshold for detecting breakouts on the up side. An adaptive and improved version of this system would adjust N according to market conditions, such as momentum, price volatility or acceleration.
Since many systems are based directly or indirectly on cycles, another useful measure of market condition is the periodic length of a price chart's dominant cycle, (DC), that cycle with the greatest influence on price action.
The utility of this new DC measure was noted by author Murray Ruggiero in the January '96 issue of Futures Magazine. In it. Mr. Ruggiero used it to adaptive adjust the value of N in a channel breakout system. He then simulated trading 15 years of D-Mark futures in order to compare its performance to a similar system that had a fixed optimal value of N. The adaptive version produced 20% more profit!
This DC index utilized the popular MESA algorithm (a formulation by John Ehlers adapted from Burg's maximum entropy algorithm, MEM). Unfortunately, the DC approach is problematic when the market has no real dominant cycle momentum, because the mathematics will produce a value whether or not one actually exists! Therefore, we developed a proprietary indicator that does not presuppose the presence of market cycles. It's called CFB (Composite Fractal Behavior) and it works well whether or not the market is cyclic.
CFB examines price action for a particular fractal pattern, categorizes them by size, and then outputs a composite fractal size index. This index is smooth, timely and accurate
Essentially, CFB reveals the length of the market's trending action time frame. Long trending activity produces a large CFB index and short choppy action produces a small index value. Investors have found many applications for CFB which involve scaling other existing technical indicators adaptively, on a bar-to-bar basis.
What is Jurik Volty used in the Juirk Filter?
One of the lesser known qualities of Juirk smoothing is that the Jurik smoothing process is adaptive. "Jurik Volty" (a sort of market volatility ) is what makes Jurik smoothing adaptive. The Jurik Volty calculation can be used as both a standalone indicator and to smooth other indicators that you wish to make adaptive.
What is the Jurik Moving Average?
Have you noticed how moving averages add some lag (delay) to your signals? ... especially when price gaps up or down in a big move, and you are waiting for your moving average to catch up? Wait no more! JMA eliminates this problem forever and gives you the best of both worlds: low lag and smooth lines.
Ideally, you would like a filtered signal to be both smooth and lag-free. Lag causes delays in your trades, and increasing lag in your indicators typically result in lower profits. In other words, late comers get what's left on the table after the feast has already begun.
Included
-Toggle bar color on/off

Gann Box LogicGann Box Logic
Overview
The Gann Box Logic indicator is a precision-based trading tool that combines the principles of Gann analysis with retracement logic to highlight high-probability zones of price action. It plots a structured box on the chart based on the previous day's high and low, overlays Fibonacci-derived retracement levels, and visually marks a critical “neutral zone” between 38.2% and 61.8% retracements.
This zone — shaded for emphasis — is a decision filter for traders:
- It warns against initiating trades in this area (low conviction zone).
- It identifies reversal pull targets when extremes are reached.
Core Principles Behind Gann Box Logic
Logic 1 — The Neutral Zone (38.2% ↔ 61.8%)
- The 38.2% and 61.8% retracement levels are key Fibonacci ratios often associated with consolidation or indecision.
- Price action between these two levels is considered a neutral, low-conviction zone.
- Trading Recommendation:
- Avoid initiating new trades while price remains within this shaded band.
- This zone tends to produce whipsaws and false signals.
- Wait for a decisive break above 61.8% or below 38.2% for clearer momentum.
- Why it matters:
- In Gann’s market structure thinking, the middle range of a swing is often a battleground where neither bulls nor bears are in full control.
- This is the zone where market makers often shake out weak hands before committing to a direction.
Logic 2 — Extremes Seek Balance (0% & 100% Reversal Bias)
- The indicator’s 0% and 100% levels represent the previous day’s low and high respectively.
- First Touch Rule:
- When the price touches 0% (previous low) or 100% (previous high) for the first time in the current session, there is a high probability it will attempt to revert toward the center zone (38.2% ↔ 61.8%).
- Trading Implication:
- If price spikes to an extreme, be alert for reversion trades toward the mid-zone rather than expecting a sustained breakout.
- Momentum traders may still pursue breakout trades, but this bias warns of potential pullbacks.
- Why it works:
- Extreme levels often trigger profit-taking by early entrants and counter-trend entries by mean-reversion traders.
- These forces naturally pull the market back toward equilibrium — often near the 50% level or within the shaded zone.
How the Indicator is Plotted
1. Previous Day High/Low Reference — The script locks onto the prior day’s range to establish the vertical bounds of the box.
2. Retracement Levels — Key Fibonacci levels plotted: 0%, 25%, 38.2%, 50%, 61.8%, 75%, 100%.
3. Box Structure — Outer Border marks the full prior day range, Mid Fill Zone is shaded between 38.2% and 61.8%.
4. VWAP (Optional) — Daily VWAP overlay for intraday bias confirmation.
Practical Usage Guide
- Avoid Trades in Neutral Zone — Stay out of the shaded area unless you’re already in a trade from outside this zone.
- Watch for First Touch Extremes — First touch at 0% or 100% → anticipate a pullback toward the shaded zone.
- Breakout Confirmation — Only commit to breakout trades when price leaves the 38.2–61.8% zone with strong volume and momentum.
- VWAP Confluence — VWAP crossing through the shaded zone often signals a balance day — breakout expectations should be tempered.
Strengths of Gann Box Logic
- Removes noise trades during low-conviction periods.
- Encourages patience and discipline.
- Highlights key market turning points.
- Provides clear visual structure for both new and advanced traders.
Limitations & Warnings
- Not a standalone entry system — best used in conjunction with price action and volume analysis.
- Extreme moves can sometimes trend without reversion, especially during news-driven sessions.
- Works best on intraday timeframes when referencing the previous day’s range.
In Summary
The Gann Box Logic indicator’s philosophy can be boiled down to two golden rules:
1. Do nothing in the middle — Avoid trades between 38.2% and 61.8%.
2. Expect balance from extremes — First touches at 0% or 100% often pull back toward the shaded mid-zone.
This dual approach makes the indicator both a trade filter and a targeting guide, allowing traders to navigate markets with a structured, Gann-inspired framework.
DISCLAIMER
The information provided by this indicator is for educational purposes only and should not be considered financial advice. Trading carries risk, including possible loss of capital. Past performance does not guarantee future results. Always conduct your own research and consult with a qualified financial professional before making trading decisions.

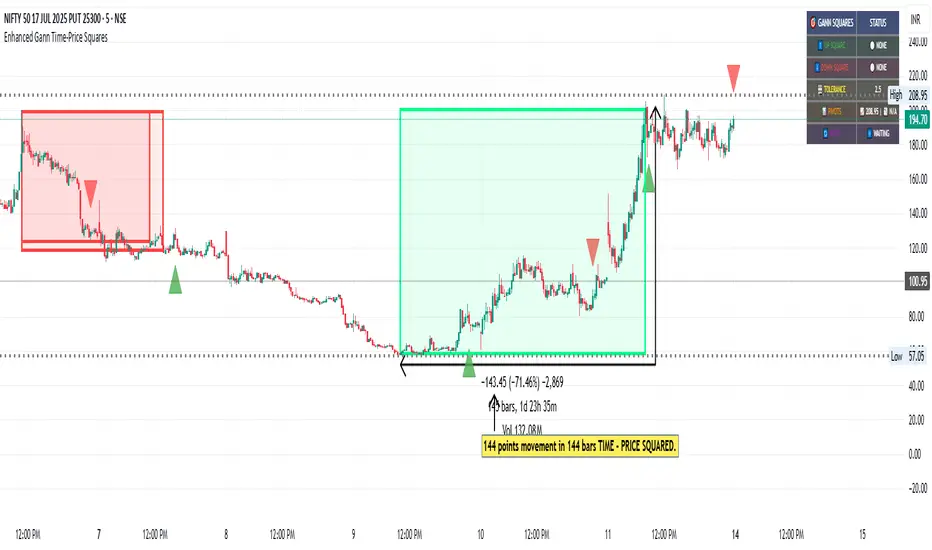
Enhanced Gann Time-Price SquaresEnhanced Gann Time-Price Squares Indicator
A comprehensive Pine Script indicator that identifies and visualizes W.D. Gann's time-price square formations on your charts. This tool helps traders spot potential market turning points where time and price movements align according to Gann's legendary market theories.
Key Features:
Automatic Square Detection - Identifies completed squares where price movement equals time movement
Future Projections - Shows forming squares with projected completion points
Pivot Integration - Automatically detects pivot highs/lows as square starting points
Visual Clarity - Clean box outlines with customizable colors and styles
Smart Filtering - Prevents overlapping squares and includes minimum move thresholds
Real-time Status - Information table showing current square formations
How to Use:
The indicator draws boxes when price moves from pivot points equal the time elapsed (number of bars). Green squares indicate upward movements, red squares show downward movements. Dashed lines show forming squares, while dotted lines project where they might complete.
Settings:
Adjust pivot sensitivity and minimum price moves
Customize tolerance for time-price matching
Toggle projections, labels, and visual elements
Fine-tune colors and line styles
Perfect for Gann theory practitioners and traders looking for time-based market analysis. The squares often coincide with significant support/resistance levels and potential reversal points.
Compatible with all timeframes and instruments.
More updates to follow
GANN Level (Salil Sir)GANN Level Indicator Description
This Pine Script calculates and plots Gann Levels based on a user-defined price input. It creates horizontal lines at key support and resistance levels derived from the input price, applying Gann's theory of market structure. The levels are dynamically calculated and squared for enhanced precision.
Key Features:
Manual Price Input:
The user inputs a round off of square root of base price (Manual_Input), which serves as the foundation for calculations.
Support and Resistance Levels:
Six resistance levels (R1 to R6) and six support levels (S1 to S6) are calculated by incrementing or decrementing the base price in steps of 0.25.
Squared Levels:
Each level is squared (level^2) to align with Gann's mathematical principles.
Visualization:
All levels, including the base price squared (GANN), are plotted as horizontal dotted lines:
Black Line: Base price squared (Gann Level).
Green Lines: Resistance levels.
Red Lines: Support levels.
Purpose:
The indicator helps traders identify potential support and resistance zones based on Gann's methodology, providing a mathematical framework for decision-making.
Usage:
Adjust the Manual Price in the settings to the desired value.
Observe the plotted levels for key support and resistance zones on the chart.
Use these levels to make informed trading decisions or to validate other indicators.
Gann SqrootGann indicators—based on trading techniques developed by W.D. Gann—are used in predicting support and resistance levels, as well as predict tops, bottoms, and future price moves.
Gann studies have been used by active traders for decades, and even though the futures and stock markets have changed considerably, they remain a popular method of analyzing an asset's direction.
Gann angles are a popular analysis and trading tool that are used to measure key elements, such as pattern, price, and time
Crypto Gann Channel Strategy (Long Bias, fixed)This is Gann Strategy Cody with Long Bias. Please try and let me know if can be improved.

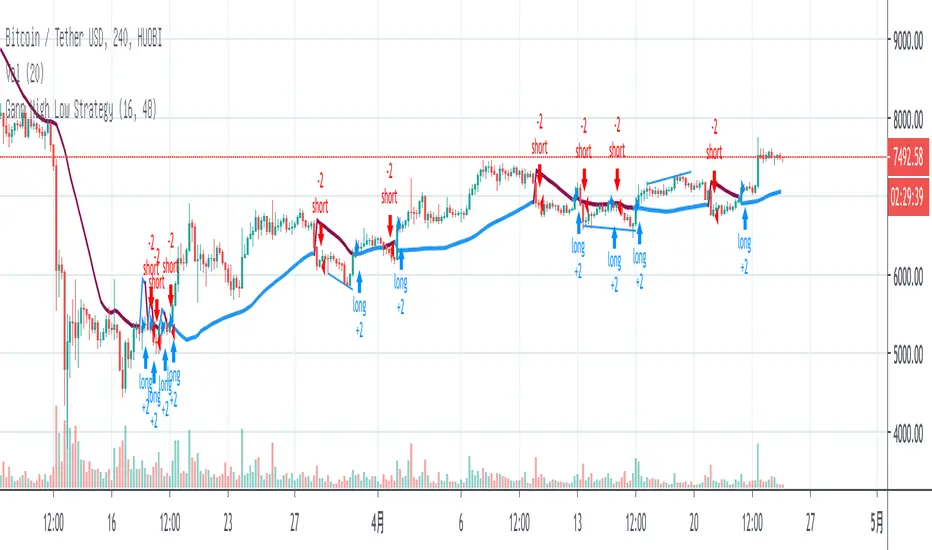
Gann High Low StrategyGann High Low is a moving average based trend indicator consisting of two different simple moving averages.
The Gann High Low Activator Indicator was described by Robert Krausz in a 1998 issue of Stocks & Commodities Magazine. It is a simple moving average SMA of the previous n period's highs or lows.
The indicator tracks both curves (of the highs and the lows). The close of the bar defines which of the two gets plotted.
[RS]Fractal Auto Gann LinesEXPERIMENTAL:
GANN lines projection based on zigzag tops/bottoms, use at your own risk.
CM Gann Swing High Low V2CM Gann Swing High Low V2
Added Improvements:
Used PineScript “linebr" code so solid lines plot only when condition = true.
Via Inputs Tab:
Ability to Turn On/Off Highlight Bars When Crossing Above/Below Swing High Low
Ability to Turn On/Off Back Ground Highlights When Crossing Above/Below Swing High Low
Ability to Turn On/Off linebr plots.
Other Features: All Available Via Inputs Tab
Ability to Adjust Moving Average Values to adjust Sensitivity.
Ability to Turn On/Off Triangles Above/Below Bars based on Indicator.
Ability to Turn On/Off Triangles at Top And Bottom Of Screen Showing Direction of Indicator.
***Basically you have Option to View Indicator about every way possible.
***Special Thanks to Glaz for Original Code.

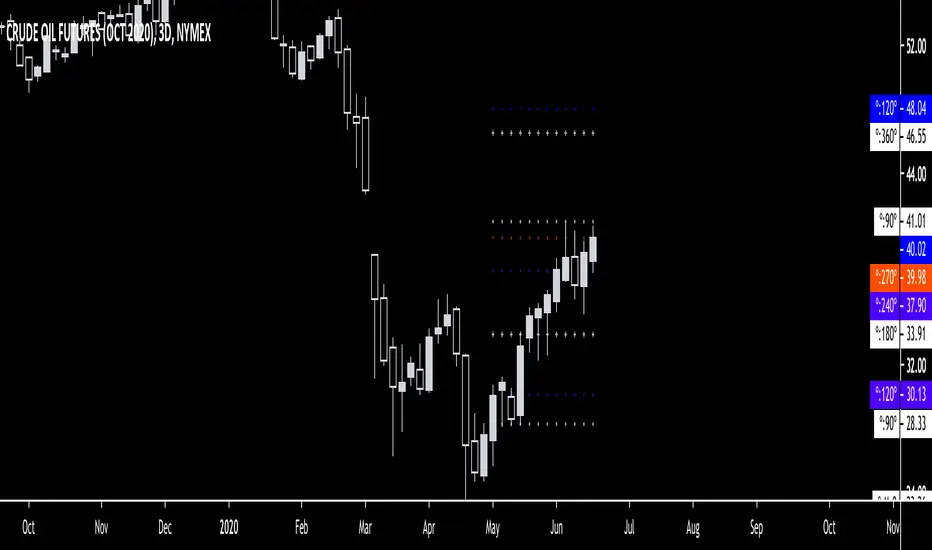
Gann Square Of 9 LevelsThis script uses the last hlc3 value of 1H, 4H, D and/or W and rotates it 360º up/down with four increments of 90º to find out potential support and resistance areas. Can be used as a dynamic support & resistance tool or just to gauge how overbought/oversold the market is. Special thanks to @Nv56 for his assistance in writing this script.
Gann FanHello All,
For long time I have been getting many requests about Gann Fan indicator. now we have linefill() function in Pine Language and I think it's right time to make Gann Fan Indicator. Many Thanks to Pine Team for adding many new features to the Pine Language!
How this indicator works:
- It calculates midline (1/1)
- By using midline it calculates other lines (1/2, 1/3, 1/4...etc)
- It calculates highest/lowest Pivot Points in last 280 bars.( by default it's 280 bars, you can change it and pivot period )
- It checks the location of highest/lowest Pivot Points
- After the calculation of the Gann Fan lines, it draws lines, puts Labels and paints the zones between the lines according to the colors set by the user
Long time ago I created a special algorithm for calculating the line with 45 degree and I used it for "1/1" line. Anybody who needs it can use this algorithm freely ;)
Options:
You can change following items;
- The colors
- Transparency. Possible values for transparency are from 0 (not transparent) to 100 (invisible)
- Line styles
- Loopback Period (by default it's 280)
- Pivot Period (by default it's 5)
- Enable/disable Labels
- Label location (by default it's 50
Tradingview Gann Fan page : The Gann Fan is a technical analysis tool created by WD Gann. The tool is comprised of 9 diagonal lines (extending indefinitely) designed to show different support and resistance levels on a chart. These angles -drawn from main tops and bottoms- divide time and price into proportionate parts and are often used to predict areas of support and resistance, key tops and bottoms and future price moves. Please note that the chart needs to be scaled properly to ensure the market has a square relationship....
Enjoy!

Gann + Laplace Smoothed Hybrid Volume Spread AnalysisThe Gann + Laplace Smoothed Hybrid Volume Spread Analysis ( GannLSHVSA ) Strategy/Indicator is an trading tool designed to fuse volume analysis with trend detection, offering traders a view of market dynamics.
This Strategy/Indicator stands apart by integrating the principles of the upgraded Discrete Fourier Transform (DFT), the Laplace Stieltjes Transform and volume spread analysis, enhanced with a layer of Fourier smoothing to distill market noise and highlight trend directions with unprecedented clarity.
The length of EMA and Strategy Entries are modified with the Gann swings .
This smoothing process allows traders to discern the true underlying patterns in volume and price action, stripped of the distractions of short-term fluctuations and noise.
The core functionality of the GannLSHVSA revolves around the innovative combination of volume change analysis, spread determination (calculated from the open and close price difference), and the strategic use of the EMA (default 10) to fine-tune the analysis of spread by incorporating volume changes.
Trend direction is validated through a moving average (MA) of the histogram, which acts analogously to the Volume MA found in traditional volume indicators. This MA serves as a pivotal reference point, enabling traders to confidently engage with the market when the histogram's movement concurs with the trend direction, particularly when it crosses the Trend MA line, signalling optimal entry points.
It returns 0 when MA of the histogram and EMA of the Price Spread are not align.
WHAT IS GannLSHVSA INDICATOR:
The GannLSHVSA plots a positive trend when a positive Volume smoothed Spread and EMA of Volume smoothed price is above 0, and a negative when negative Volume smoothed Spread and EMA of Volume smoothed price is below 0. When this conditions are not met it plots 0.
HOW TO USE THE STRATEGY:
Here you fine-tune the inputs until you find a combination that works well on all Timeframes you will use when creating your Automated Trade Algorithmic Strategy. I suggest 4h, 12h, 1D, 2D, 3D, 4D, 5D, 6D, W and M.
ORIGINALITY & USEFULNESS:
The GannLSHVSA Strategy is unique because it applies upgraded DFT, the Laplace Stieltjes Transform for data smoothing, effectively filtering out the minor fluctuations and leaving traders with a clear picture of the market's true movements. The DFT's ability to break down market signals into constituent frequencies offers a granular view of market dynamics, highlighting the amplitude and phase of each frequency component. This, combined with the strategic application of Ehler's Universal Oscillator principles via a histogram, furnishes traders with a nuanced understanding of market volatility and noise levels, thereby facilitating more informed trading decisions. The Gann swing strategy is developed by meomeo105, this Gann high and low algorithm forms the basis of the EMA modification.
DETAILED DESCRIPTION:
My detailed description of the indicator and use cases which I find very valuable.
What is the meaning of price spread?
In finance, a spread refers to the difference between two prices, rates, or yields. One of the most common types is the bid-ask spread, which refers to the gap between the bid (from buyers) and the ask (from sellers) prices of a security or asset.
We are going to use Open-Close spread.
What is Volume spread analysis?
Volume spread analysis (VSA) is a method of technical analysis that compares the volume per candle, range spread, and closing price to determine price direction.
What does this mean?
We need to have a positive Volume Price Spread and a positive Moving average of Volume price spread for a positive trend. OR via versa a negative Volume Price Spread and a negative Moving average of Volume price spread for a negative trend.
What if we have a positive Volume Price Spread and a negative Moving average of Volume Price Spread?
It results in a neutral, not trending price action.
Thus the Indicator/Strategy returns 0 and Closes all long and short positions.
I suggest using "Close all" input False when fine-tuning Inputs for 1 TimeFrame. When you export data to Excel/Numbers/GSheets I suggest using "Close all" input as True, except for the lowest TimeFrame. I suggest using 100% equity as your default quantity for fine-tune purposes. I have to mention that 100% equity may lead to unrealistic backtesting results. Be avare. When backtesting for trading purposes use Contracts or USDT.

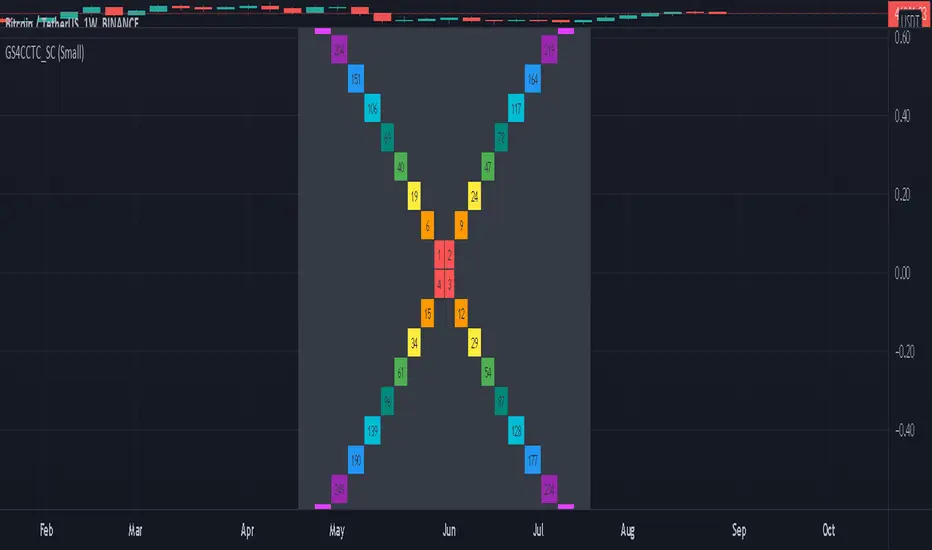
Gann Square 4 Cross Cardinal Table ConceptThis indicator was intended as educational purpose only for Gann Square 4, specifically to show Cross Cardinal.
This indicator was build upon The Tunnel Thru The Air Or Looking Back From 1940, written by WD Gann.
Gann Square 4 is similar to Gann Square 9 (Refer this build) but limited to Cross Cardinal only.
Indikator ini bertujuan sebagai pendidikan sahaja untuk Gann Square 4, khusus untuk menunjukkan Cross Cardinal.
Indikator ini dibina berdasarkan buku The Tunnel Thru The Air Or Looking Back From 1940, ditulis oleh WD Gann.
Gann Square 4 hampir sama dengan Gann Square 9 (Rujuk binaan ini) tetapi terhad kepada Cross Cardinal sahaja.
Indicator features :
1. Font size from tiny to huge.
2. For desktop display only, not for mobile.
3. All values can be selected individually.
Kemampuan indikator :
1. Saiz font dari paling kecil ke paling besar.
2. Untuk paparan desktop sahaja, bukan untuk mobile.
3. Semua nilai boleh dipilih secara individu.
FAQ
1. Credits / Kredit
WD Gann , The Tunnel Thru The Air Or Looking Back From 1940
Ganzilla
2. Page involved / Muka Surat terlibat
195 - 198
3. Code Usage / Penggunaan Kod
Free to use for personal usage.
Bebas untuk kegunaan peribadi.
Left : All values off / Kiri : Semua nilai off
Right : All values on / Kanan : Semua nilai on
Left : Random Usage / Kiri : Kegunaan Random
Right : Ideal Usage / Kanan : Kegunaan Ideal