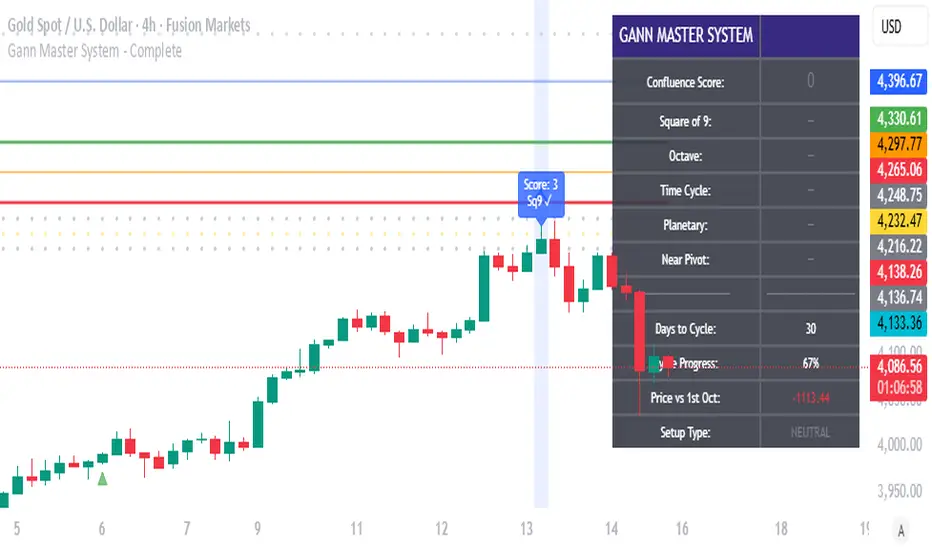
Gann Master System - CompleteGann Master Trading System - Multi-Factor Confluence Indicator
Advanced implementation of W.D. Gann methodology combining Square of 9 calculations, Octave Theory projections, Time Cycle analysis, and Planetary Aspect windows into a systematic confluence-based trading system.
Key Features:
Square of 9 geometric price levels (180°, 270°, 360° rotations)
Octave Theory targets with harmonic divisions (0.5x, 1x, 2x, 4x)
Time cycle tracking with sub-cycle analysis
10 configurable planetary aspect windows (manual input from ephemeris)
Automatic swing pivot detection
Multi-factor confluence scoring (0-20+ points)
Visual signals: Blue (score 3-6), Red (7-10), Purple (11+)
Real-time info panel with factor status
Built-in alerts for high-probability setups
How It Works:
System calculates multiple Gann factors simultaneously and awards points when price aligns with key levels. Higher confluence scores indicate stronger probability of reversal. Combines objective mathematics with astronomical timing for systematic edge.
Best For: Daily/4H charts on Gold, Forex majors, Indices
Signal Frequency: 2-4 high-quality setups per month (score 11+)
Recommended Min Score: 7 for trading, 11+ for highest probability
Setup Required: Configure Square of 9 pivot, Octave base range, Time cycle start date, and planetary aspect dates. See full documentation for detailed guide.
"gann" için komut dosyalarını ara
Gann For XAUUSDThe Gann levels for XAUUSD indicator is designed to plot dynamic Gann levels based on either the previous day’s Close price (for large-cap stocks) or the current day’s Open price (for small-cap stocks). These levels help traders identify key price zones, reversals, and potential trading opportunities.
🔑 Key Features:
Auto/Manual Toggle →
Auto Mode: Automatically fetches the previous day’s Close and today’s Open using real-time market data.
Manual Mode: Allows traders to manually input values for customized backtesting or specific scenarios.
Large vs. Small Stocks Modes → Choose between two calculation sets depending on whether you’re trading large or small stocks.
Dynamic Gann Levels → Multiple levels (e.g., ±T1, ±T2, ±T3, EB, KB, MB, AB, QB, etc.) are plotted with distinct colors for clarity.
Chart Labels → Each level is clearly labeled with its value, making it easy to read without hovering over lines.
Info Panel → Displays the active mode (Auto/Manual) and the exact Close and Open values being used.
🎯 How to Use:
Select Large Stocks mode for higher-value instruments (levels calculated from previous day’s Close).
Select Small Stocks mode for smaller instruments (levels calculated from today’s Open).
Use the Auto Mode for convenience (no daily inputs needed) or switch to Manual Mode if you want to test specific price scenarios.
Watch how price reacts to Gann levels for potential support/resistance zones and trade setups.
⚠️ Disclaimer:
This indicator is intended for educational purposes only and should not be considered financial advice. Always use proper risk management and combine with other tools/analysis before trading.

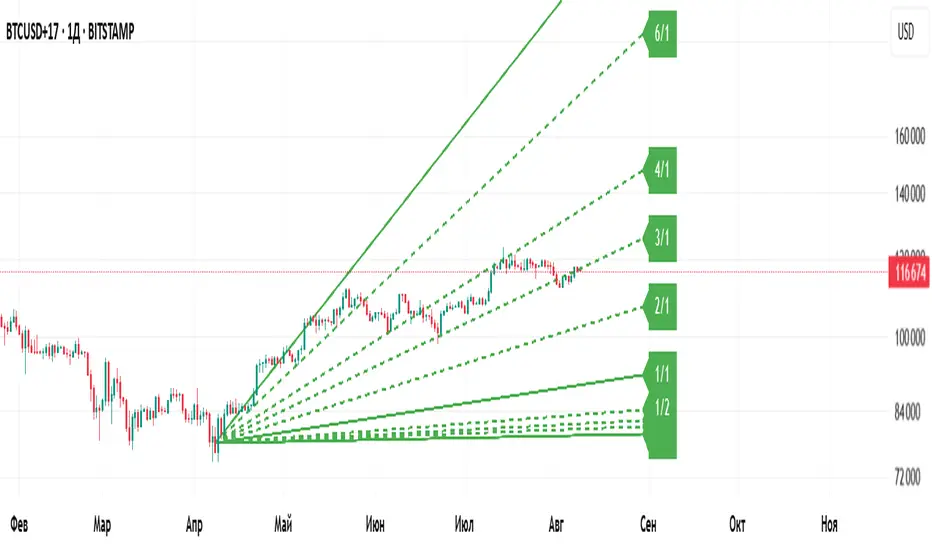
Gann Fan Master – Selectable Base Angle & Fibonacci AnglesGann Fan Master – Selectable Base Angle & Fibonacci Angles
This indicator plots a Gann Fan from point A1 through point B1, with full customization over:
Base angle selection (8/1, 1/1, 1/8)
Main angle set
Fibonacci-based angles
Up to 10 custom user-defined angles
Logarithmic or linear slope calculation
Custom fan color and extended line length
Perfect for manual chart analysis — you select A1 and B1, the script calculates and draws the fan with labeled angles.
How It Works
-Select A1 (time & price) and B1 (time & price).
-The script calculates the base slope depending on the selected base angle:
Linear scale: slope = (B1 − A1) / Δt / base_angle_value
Logarithmic scale: slope = (ln(B1) − ln(A1)) / Δt / base_angle_value
-Each enabled angle is drawn from A1, extended by the chosen number of bars, and labeled with its value.
-Fan color is determined automatically by direction (green for upward, red for downward) or can be overridden.
Quick Start
-Add the indicator to your chart.
-In settings:
A1 Time/Price — starting point.
B1 Time/Price — second point (defines slope).
Base Angle — choose 8/1, 1/1, or 1/8.
Extend Fan (Bars) — number of bars to extend lines into the future.
Logarithmic Fan Calculation — toggle for log-scale mode.
Enable desired angle sets: Main, Fibonacci, or Custom.
-Optionally, enable Use Custom Fan Color and set your own color.
Settings
Enable Fan — master switch.
A1 Time/A1 Price, B1 Time/B1 Price — anchor points.
Base Angle — 8/1, 1/1, 1/8.
Extend Fan (Bars) — extension length.
Use Custom Fan Color / Fan Color — manual color override.
Main Angles — 1/8, 1/4, 1/3, 1/2, 1/1, 2/1, 3/1, 4/1, 6/1, 8/1.
Fibonacci Angles — 0.214, 0.35, 0.382, 0.618, 0.786, 0.886, 0.9335, 1.118, 1.236, 1.382, 1.618.
Custom Angles — up to 10 values (dotted lines), labels from the exact value.
Usage Tips
-Choosing A1 and B1:
A1 — significant starting swing high or low.
B1 — next key swing to define slope.
-Logarithmic scale:
Ideal for long-term exponential trends (crypto, growth stocks).
Prices must be > 0.
-Watch how price reacts to different angles:
1/1 as median trend, fractional for support/resistance, multiples for acceleration/slowdown.
Disclaimer
This is a technical analysis tool. It is not financial advice. Trading decisions are made at your own risk.
Gann Fan Master – Selectable Base Angle & Fibonacci Angles
Индикатор строит веер Ганна от точки A1 через точку B1 с полной кастомизацией:
Выбор базового угла (8/1, 1/1, 1/8)
Набор основных углов
Углы Фибоначчи
До 10 пользовательских углов
Расчёт в логарифмической или линейной шкале
Цвет веера по направлению или заданный вручную
Настройка длины продления линий
Идеально подходит для ручного анализа графика — вы задаёте A1 и B1, а скрипт рассчитывает и строит веер с подписями углов.
Как это работает
-Задайте A1 (время и цена) и B1 (время и цена).
-Скрипт рассчитывает базовый наклон в зависимости от выбранного базового угла:
Линейная шкала: наклон = (B1 − A1) / Δt / base_angle_value
Логарифмическая шкала: наклон = (ln(B1) − ln(A1)) / Δt / base_angle_value
-Каждый включённый угол рисуется из точки A1, продлевается на заданное число баров и подписывается.
-Цвет линий определяется автоматически по направлению (зелёный — вверх, красный — вниз) или задаётся вручную.
Быстрый старт
1)Добавьте индикатор на график.
2)В настройках:
A1 Time/Price — начальная точка.
B1 Time/Price — вторая точка (задаёт наклон).
Base Angle — выберите 8/1, 1/1 или 1/8.
Extend Fan (Bars) — длина продления линий в барах.
Logarithmic Fan Calculation — переключатель логарифмического режима.
Включите нужные блоки углов: Main, Fibonacci, Custom.
3)При желании активируйте Use Custom Fan Color и задайте цвет веера.
Настройки
Enable Fan — общий выключатель.
A1 Time/A1 Price, B1 Time/B1 Price — опорные точки.
Base Angle — 8/1, 1/1, 1/8.
Extend Fan (Bars) — продление линий.
Use Custom Fan Color / Fan Color — цвет вручную.
Main Angles — 1/8, 1/4, 1/3, 1/2, 1/1, 2/1, 3/1, 4/1, 6/1, 8/1.
Fibonacci Angles — 0.214, 0.35, 0.382, 0.618, 0.786, 0.886, 0.9335, 1.118, 1.236, 1.382, 1.618.
Custom Angles — до 10 значений (точечные линии) с подписями.
Советы по применению
Выбор A1 и B1:
A1 — значимый экстремум начала движения.
B1 — следующий важный экстремум для задания наклона.
Логарифмическая шкала:
Подходит для долгосрочных экспоненциальных трендов (крипто, акции роста).
Цена должна быть > 0.
Следите, как цена реагирует на разные углы:
1/1 — медианный тренд.
Дробные углы — потенциальная поддержка/сопротивление.
Кратные — ускорение/замедление движения.
Дисклеймер
Это инструмент технического анализа и не является инвестиционной рекомендацией. Торговые решения вы принимаете на свой страх и риск.
Gann Square of 144This indicator will create lines on the chart based on W.D. Gann's Square of 144. All the inputs will be detailed below
Why create this indicator?
I didn't find it on Tradingview (at least with open source). But the main reason is to study the strategy and be able to draw it fast. Manually drawing the square is not hard, but moving all together to the right spots and scale was time-consuming.
It has a lot of inputs...
Yes, each square point divisible by 6 has information with some options, so the user can create any configuration he wants. Also, it has the advantage of having the square built in seconds and adjusting itself on each new calculation.
About the inputs
Starting Date
This input will be used when the "Set Upper/Lower Prices and Start Bar Automatically" checkbox is not selected. The indicator will calculate all the line locations on the chart using the selected start date. When selecting this input, change the Manual Max and Min Prices to the better calculation
Manual Max/Min Price
This input will be used when the "Set Upper/Lower Prices and Start Bar Automatically" checkbox is not selected. The indicator will calculate all the line's locations on the chart using these prices
Set Upper/Lower Prices and Start Bar Automatically
Selects if the starting date will be automatically selected by the system or based on the input data. When it's set, the indicator will use the most recent bar as the middle point of the square, using the higher price as the Upper Price and the lowest price as the Lower Price in the latest 72 bars (or more based on the Candles Per Division parameter)
Update at a new bar
When this option is market, the indicator will update all created lines to match the new bar position, together with all the possible new Upper/Lower prices. Let it unchecked to watch the progression of the price while the square remains fixed in the chart.
Top X-Axis
When checked, it will display the labels on the Top of the square
Bottom X-Axis
When checked, it will display the labels on the Bottom of the square
Left X-Axis
When checked, it will display the labels on the left of the square
Right X-Axis
When checked, it will display the labels on the right of the square
Show Prices on the Right Y-Axis
When checked, it will display the prices together with the labels on the right of the square
Show Vertical Divisions
Show the lines that will divide the square into 9 equal parts
Show Extra Lines
Show unique lines that will come from the Top and bottom middle of the square, connecting the center to the 36 and 108 levels
Show Grid
When selected, it will display a grid in the square
Line Patterns
A selector with some options of built-in lines configuration. When any option besides None is selected, it will override the lines inputs below
Numbers Color
Select the color of each number on the Axis
Vertical Lines Color
Select the color of the vertical lines
Grid Color
Select the grid line color
Connections from corners to N
Each corner is represented by 2 characters, so they all fit in a single line
It will indicate where the line starts and where it ends
┏ ↓ = Top Left to Bottom
┏ → = Top Left to Right
┗ ↑ = Bottom Left to Top
┗ → = Bottom Left to Right
┓ ← = Top Right to Left
┓ ↓ = Top Right to Bottom
┛ ← = Bottom Right to Left
┛ ↑ = Bottom Right to Top
Besides selecting what line will be created, it's possible to select the color, the style, and the extension
How to use this indicator
When you dig into Gann's books for more information about the square of 144, you find that it was part of his setup with multiple indicators (technical and fundamental, and astrological). It is not a "one indicator" setup, so it's hard to say that you will find entries, exits, stop loss, and take profit in this. Still, it will help see trendiness, support, and resistance levels.
Mixing this with other indicators is probably a good idea, but some may find this indicator the only one needed.
Some aspects of the square
The end of the square is important, so where it starts is crucial. The end is important because it is where the price and time expire. The other parts of the square are defined based on their start and end, so placing them right is essential.
So, where to set the start of the square?
The last major low is the most indicated. The minimum price will be the lowest, and the max price will be the last major Top. Note that the indicator uses 1 candle on each point.
After finding the start, the minimum, and the maximum prices for the square, it will draw all lines. Another essential part of the square is The Midpoint.
The midpoint is the most crucial part of the square and is the best way to see if you positioned the square correctly. When the price is inside the square, using the starting candle as the start, a second higher low or a lower high occurs in that spot. When using the Vertical lines in the indicator, it's the middle square inside Gann's square.
The other divisions will be opposing each other most of the time. So if the price is rising in the 1/3 of the square, it's common to see the price fall in the 3/3 of the square.
More information about these aspects here
Considerations
This indicator was meant for price targets and a time calculator for possible support/resistances in the chart. It was created by William Delbert Gann and was part of his setup for trading almost a century ago. The lines will form geometric figures, which Gann used with high accuracy to predict tops/bottoms and when they would occur.

Gann Trend Oscillator Strategy The Gann Swing Oscillator has been adapted from Robert Krausz's book,
"A W.D. Gann Treasure Discovered". The Gann Swing Oscillator helps
define market swings.

Gann Swing Oscillator Strategy The Gann Swing Oscillator has been adapted from Robert Krausz's book,
"A W.D. Gann Treasure Discovered". The Gann Swing Oscillator helps
define market swings.

Gann Square of 9Here it is, the Gann Square of 9. An easy-to-use tool to determine possible support and resistance levels. Input a starting value to be the starting point of the square. Then the increasing value will be used to get the value of each cell on the table.
It's possible to show the diagonals and a spot number to see what cell value the current price is close to. The diagonals are known to be the key support and resistance levels in Gann's analysis. That way, it's possible to show those diagonals in the chart for easy reading of those levels.

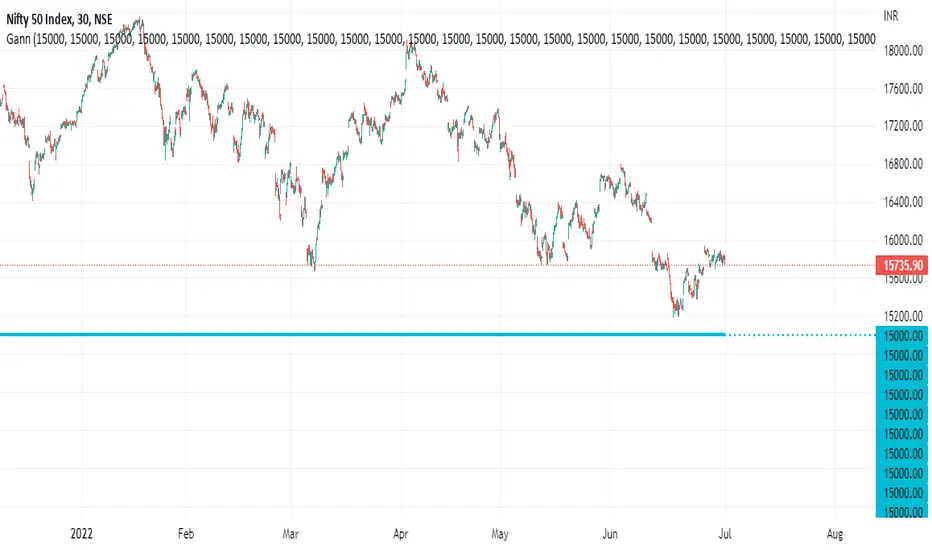
Gann Levels For Nifty Gann Levels for nifty 50 is very important to trade in options. so i create 50 gann levels for intraday trading.
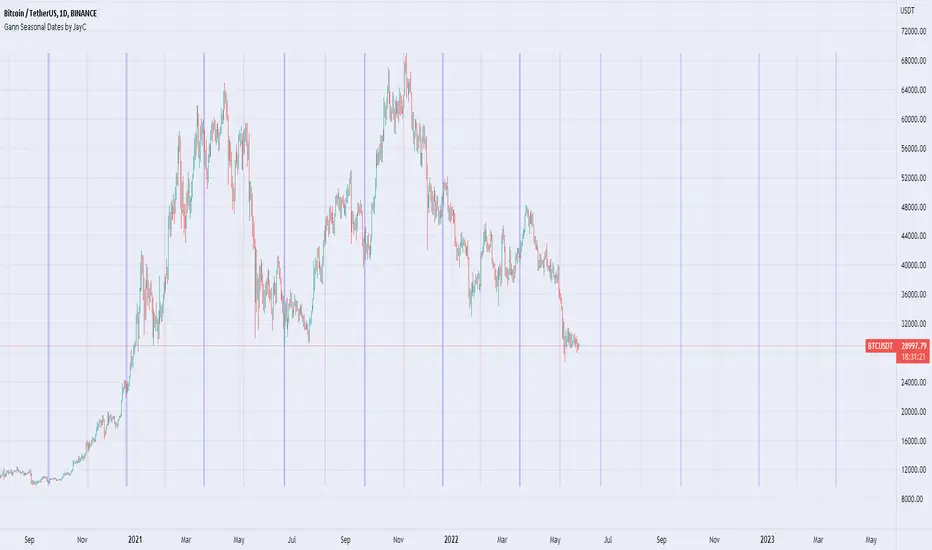
Gann Seasonal Dates by JayCThis script marks important seasonal dates with a vertical line that Gann used to watch for Trend changes.
March 21st
June 22nd
September 23rd
December 22nd
And 50% Levels - Minor seasonal dates.
February 4th
May 6th
August 8th
November 7th
In the settings you can change line colors and toggle the Offset. Offset is the way the script draws lines to show future dates, I offset by 365 so it will show incorrectly at some points in back testing.
Gann-Fun-price-SquaresThis needs no explanation, this is the secrete system that has made many millionaires - By selling courses and indicators of course -I jest
This was just a fun project, that doesn't mean it was not geared towards tradable S/R generation. People who use Gann and Murrey methods will find this useful, others can marvel at it or lol at it, it's all good.
The author takes no responsibility for your profit or loss, this was fun and educational purpose project only.
Have fun :3

Gann_RSGann_RS — Precision Gann Level Indicator (RightSpade Edition)
Gann_RS (RightSpade Edition) is a professional-grade indicator that applies Gann’s square-root progression technique to identify dynamic support and resistance levels around a key reference point (price X).
✅ Key Features
• Auto-detects base level using daily close or daily low.
• Plots symmetrical Gann levels above / below initial X using √X + Step logic.
• Adjustable step size and number of levels.
• Distinct color coding for alternate bands.
⚙️ Usage Tips
• Works on any symbol and timeframe.
• Use smaller Step values (1-2) for tighter intraday analysis, larger values (2-4) for swing setups.
• Combine with trend-based confirmation indicators for maximum accuracy.
🧭 Developed & maintained by
RightSpade Capital Advisors Pvt. Ltd. — SEBI Reg. INH000018799
📌 Disclaimer
This script is for educational & research purposes only and does not constitute investment advice or a buy/sell recommendation. Market participation involves risk; please consult your financial advisor before making trading decisions.
© 2025 RightSpade Capital Advisors Pvt. Ltd. All Rights Reserved.

GannLevelsHow to setup
This script gives ability to quickly add Gann levels on the chart. After adding this indicator on the chart, click setting and set base level. The base-level could be any number in Gann square.
This script will automatically calculate 7 levels below & above the base level. Each level will be at an angle of 22.5 deg in Gann square.
How to trade
This script will draw significant Gann levels on the chart. One may use this like a pivot level to trade.
Work of caution
This script is just an additional help to take trading discussion. This script does not give any buy or sell signals.
Let me know your feedback.

gannsquareof9chart2This Indicator works on W.D.Gann Square of 9 chart
gann works on SQUARES: ODD and EVEN
HIGH and LOW of this chart will be the " SQUARES "
this chart provides 7 major and 8 minor levels in between the ODD or EVEN Squares .
major levels are colored in blue and white respectively.
minor levels are colored in olive .
better visibility in dark background
change the color of the levels according to your requirement.
Once the HIGH or LOW (or SQUARES) breaks The next ODD or EVEN SQUARES open up ,
As the breakout of Squares happens the chart expands and acquire the new HIGH or LOW.
I have given Three different resolution option user can switch between:
DAILY ; WEEKLY ; MONTHLY .
thankyou

Auto Gannbox by BULL┃NETThe B | N GABO (Auto Gannbox by BULL | NET)
indicator helps traders to draw a Gann Box with Angles and Arches automatically. Unlike the many other Gann indictors available at TradingView B | N GABO takes an objective approach to calculate the Price/Time ratio which is the most important part of drawing a Gann Box.
█ ⚠️ DISCLAIMER – READ BEFORE YOU USE ⚠️
█ CONCEPTS
William Delbert Gann used geometric constructions to divide time and price into proportionate parts to predict price development and areas of resistance and support. If you are new to Gann theories you should read about it on the internet.
W.D. Gann never revealed all details about his theory. One of those secrets it how he determined the essential 45° degree line which denotes the 1:1 ratio between price and time. Many people believe the 45° is due to the use of graph paper on which stock prices were drawn in the past. In my opinion, this theory fails precisely because of the price. Even back in time different stocks and commodities had different prices. So what should have been specified on the Y-axis?
Others believe there was no rule of construction at all and that Gann simply drew lines between pivot points. Gann was obsessed by Geometry. It makes no sense to think he had no plan. And if this would be true the Angles would be the result of how the graph paper has been manufactured.
Long story short, we don’t know exactly how he did it, and even studying his drawings leaves us guessing. I’m deeply interested in the objective assessment of facts. If something can’t be reproduced consistently, then it was just luck or coincidence. That’s why I’ve developed my own approach, combining objectivity, geometry, and time into a system that allows us to automatically determine a 45° line on the chart for any asset in any timeframe (see limitations section).
Think about the lifecycle of a tree: it’s planted, grows, may be struck by lightning, decays, and eventually vanishes. Apply this concept to the price of an asset. It starts at a low, rises to a peak, and then decreases to the next low. If we measure the time between the first low and the high, we get a ratio between duration and growth. By applying this ratio to a line starting at the high and moving in the opposite direction, we can determine whether the price is falling faster or slower than it took to rise.
By constructing a Gann Box around this line, with the 45° line as the anchor and adding other angles and arcs, we can get a better sense of how the price might develop over time. This interpretation draws inspiration from the principles of geometry and time-based analysis, and reflects my own unique take on market behavior.
The B | N GABO indicator uses meaningful pivot points on the chart to determine cycles. This is an objective approach that takes momentum into account. Similar to a tree, there are times of slower growth or accelerated decay. The pivot levels are based on the time frame. For example, when looking at a weekly chart, a cycle lasting at least 3 months would be considered meaningful. Therefore, the indicator uses Level 10 pivot points (a high with 10 lower highs or a low with 10 higher lows on each side) on a weekly chart. Instead of doing this automatically, you can set the pivot level manually. (See limitations section)
█ FEATURES
As with all my indicators B | N GABO his highly customizable.
— PIVOPOINT OPTIONS
The most important setting is how pivot points get calculated. By default the pivot level is selected automatically according to the timeframe of the chart.
Level 12 for 1 Hour Timeframe (minimum cycle of 25 hours or round about 3 trading days at the NYSE)
Level 15 for 4 Hours Timeframe (minimum cycle of 64 hours or round about 10 trading days at the NYSE)
Level 10 for any other Timeframe below 1 Day
Level 21 for Daily Timeframe (minimum cycle of 43 Trading days or round about 9 weeks)
Level 10 for any other Timeframe below Weekly
Level 6 for Weekly Timeframe and above
● Pivot Selection
You can switch to manual selection if you want or need to use other pivot level settings.
● Manual Length
The number you enter determines the amount of higher/lower bars needed to form a pivot point form a Low or High. Keep the limitations in mind (see limitations section)
● Display Pivotpoints
By default each calculated pivot point is marked on the chart as GH (Gann High) or GL (Gann Low). You can disable the display if you prefer a clean chart.
● Label
● Active
● Removed
● Size
If you display pivot points you can set the background color of the pivot label, the text color for active and removed pivot points and the size.
A removed pivot point shows pivot points that haven been superseded by a later pivot point in the same direction. Although removed pivot points can never become an anchor for a Gann Box they can tell you something about price momentum.
— GANN BOX OPTIONS
● Enable GANN
By default the active Gann Box is displayed on the chart. If you want to work with the pivot points only i.e. while testing the combination of indicators you can disable drawing the Gann Box.
● Show Info
By default you see the following informational labels around the Gann Box:
63.75° Angle (1x2), 45° Angle, 26.25° Angle (2x1) for better orientation
The current pivot length which is the level you set in the pivot point options or which has been selected automatically.
The Price/Bar ratio which you can use in the chart settings to fix the ratio. This will give you a perfect square.
Disable the display if you don’t need it or if you want a cleaner chart.
● Label
● Size
● Text
Label background color, label size and text color are used across all available labels.
● Time/Price Line
● Style
● Width
This settings define the appearance of the price (horizontal) and time (vertical) lines which define the squares the Gann Box is built with.
— GANN ANGLE OPTIONS
● Angle Line
● Style
● Width
Like with the Price/Time lines above you can fully customize the Angle lines drawn in the Gann Box. Select a line color, style and width to your likings.
● Angle Checkboxes
By default the 1, 2, 4 and 8 relation angles are drawn. The 1 to 1 (45°) can’t be disabled. In addition you can enable the 1.5 and 3 relation angles. Relation is meant as time units per price units.
● Enable 45° Watch
By default the indicator will check whether the price is above or below the 45° angle and change its color accordingly. It is a quick way to tell you whether the rise or fall of momentum is accelerating compared to the time period (Gann Box) before.
● Above
● Below
● Style
● Width
Change the 45° line color separately for price above and below the line, style and width to your likings.
— GANN ARC OPTIONS
● Arc Line
● Style
● Width
Like with the Angle lines above you can fully customize the Arc lines drawn in the Gann Box. Select a line color, style and width to your likings.
● Enable ARC Cross Labels
By default the indicator displays the price at which the current bar would hit or cross an arc line. Disable it if you want a cleaner chart.
● Label
● Text
● Size
● Position
With this settings you customize the color of the label and text, it’s size and whether the label should be moved to the left. This settings apply to the Cross 45° Label as well.
— DISPLAY OPTIONS
● 2 Decimals
To streamline the appearance of prices they are set to display two decimals only. Numbers get rounded! However, trading currency pairs or crypto assets might need to display the full amount of decimals. In this case simply disable the setting “2 Decimals”.
● Enable TF Warning
-------------------------------------------------------
Disclaimer BullNet: The information provided in this document is for educational and informational purposes only and does not constitute financial, investment, or trading advice. Any use of the content is at your own risk. No liability is assumed for any losses or damages resulting from reliance on this information. Trading financial instruments involves significant risks, including the potential loss of all invested capital. There is no guarantee of profits or specific outcomes. Please conduct your own research and consult a professional financial advisor if needed.
Disclaimer TradingView: According to the www.tradingview.com
Copyright: 2025-BULLNET - All rights reserved.
Roadmap:
Version 1.0 03.03.2025

WD Gann: Vertical Lines for Predefined Days/Bars AgoThis Pine Script draws vertical lines on the chart at specific time intervals, inspired by WD Gann’s theories of time cycles . WD Gann, a famous trader, believed that market movements were influenced by predictable time cycles. This script enables traders to visualize these key time cycles on the chart by placing vertical lines at predefined intervals (in bars ago), helping to identify potential turning points in the market.
The time intervals used in this script are inspired by Gann’s work, as well as astrological and numerological principles , which many traders believe influence market behavior . You can customize which time intervals (such as 3, 7, 9, 21, etc.) you want to track by enabling or disabling specific vertical lines on the chart.
Key Features:
Time Cycles Based on Gann’s Theory: Draws vertical lines at significant time intervals such as 3, 7, 9, 21, 27 bars ago, which are commonly used by Gann traders.
Astrological & Numerological Significance: The predefined intervals also align with key numerological and astrological values, allowing for a broader perspective on market cycles.
Customizable Intervals: You can choose which time intervals to display by enabling or disabling checkboxes for each cycle, allowing flexibility in chart analysis.
Visual Labels: Each vertical line is labeled with its corresponding "bars ago" value, providing clear reference points for the selected time cycles.
What Users Can Do:
Track and analyze market movements based on time cycles that are significant to Gann’s theory, as well as numerological and astrological influences.
Enable or disable vertical lines for specific cycles, like the 3-bar cycle, 9-bar cycle, or 365-bar cycle, depending on the intervals that align with your trading strategy.
Combine with other technical analysis tools and Gann techniques (e.g., Gann Angles, Gann Fans, or Square of Nine) for a more comprehensive trading approach.
This tool is designed for traders who believe in the power of time cycles to influence market behavior, and is especially useful for predicting turning points or key price movements based on these cycles.

Gann Square of 9 Pivots By Dr. PWho loves Gann Square of 9? Lots of people.
Who likes calculating square of 9 and then manually putting lines on the chart? No one.
Here's a nifty little add-in that you can have draw your Gann Square of 9 pivot lines with just a little bit of configuration based on what is being traded.
Adjust the modifier value to match the price range being traded. I recommend 1 for prices 1-999, 10 for prices above 1000 (like BTC or AMZN), and .001 for Forex.
The base price from which the levels are calculated can be the high, low, hl2, etc. from the Month, Week, Day, Hour previous.
Adjust the rotation to move the levels up or down 360 degrees if the previous period's price was too high or low to put the levels on the current price.
Have fun with it, play with the settings, drop a like, or shoot me a comment for improvements/problems/questions.
Cheers!
Dr. P

Historical Swing High-Low Gann IndicatorThe Historical Swing High-Low Gann Indicator is a powerful tool designed to track and visualize key market swing points over time. This indicator identifies significant swing highs and lows within a specified time frame and draws connecting lines between these points, allowing traders to observe the natural ebb and flow of the market.
What sets this indicator apart is its ability to maintain all previously drawn swing lines, creating a comprehensive historical view of market movements. Additionally, the indicator projects Gann-style lines from the most recent swing highs and lows, providing traders with potential future support and resistance levels based on the geometric progression of price action.
Features:
Swing Detection: Automatically detects significant swing highs and lows over a user-defined period (default is 3 hours).
Persistent Historical Lines: Keeps all previously drawn lines, offering a complete visual history of the market's swing points.
Gann-Style Projections: Draws forward-looking lines from the latest swing points to help predict possible future market levels.
Customizable Parameters: Allows users to adjust the swing detection period to suit different trading styles and time frames.
This indicator is ideal for traders who rely on price action, support and resistance levels, and Gann theory for their analysis. Whether used in isolation or as part of a broader strategy, the Historical Swing High-Low Gann Indicator provides valuable insights into the market's behavior over time.

Gann StarA script to draw Gann Star given Cycle start point, Cycle space (or size), Cycle type (Bullish / Bearish)
You can customize Time Levels color and style and the rest of lines Color and Style
Telegram : @Kirolos_T

Gann Dates█ INTRODUCTION
This indicator is very easy to understand and simple to use. It indicates important Gann dates in the future based on pivots (highs and lows) or key dates from the past.
According to W.D. Gann the year can be seen as a cycle or one full circle with 365 degrees. The circle can be symmetrically divided into equal sections at angles of 30, 45, 60, etc. The start of the cycle can be a significant key date or a pivot in the chart. Hence there are dates in the calendar, that fall on important angles. According to W.D. Gann those are important dates to watch for significant price movement in either direction.
In combination with other tools, this indicator can help you to time the market and make better risk-on/off decisions.
█ HOW TO USE
ibb.co
You need to adjust the settings depending on the chart. The following parameters can be adjusted:
Gann angles: The script will plot dates that are distant from pivots by a multiple of this.
Gann dates per pivot: The amount of dates that will show.
Search window size for pivots: This is how the local highs and lows are detected in the chart. The smaller this number the more local highs and lows will show.
You also have the option to hide dates derived from lows/highs, or show dates based on two custom key dates.
█ EXAMPLES
The following chart shows the price of Gold in USD with multiples of 20 days from local pivots.
The following chart shows the price of Bitcoin in USD with multiples of 30 weeks from two custom dates (in this case the low in late 2018 and the low in late 2022).

Gann Box by time frame
█ OVERVIEW
This script is designed to plot Gann boxes within a specific time frame candle. That means, you can get your intraday Gann box with one click and zoom in to low time frame. Highs and lows are set by candle chosen, you can display the yearly Gann box if that's something you want to view!
In addition, this script can highlight the golden ratio and its inverse ( .618 & .382 ) within the box itself. You have the option to select between a daily, a weekly, or a monthly candle. Not to mention that you have the ability to select a multiplier to those candles, where for example, you would be able to plot the 3 month ( quarterly ) gann box. or the yearly by selecting 12 months! This script includes zero, one and two divisions to Gann box. The first division would get you the sun lines only. while the first division has the middle 0.5 point and so on. This script is meant to be used as a one-click fast solution. Highs and lows get adjusted as the chart breaks those levels automatically.
█ Future Plans and upgrades to this script may include :
1. Adding more divisions.
2. Data box that shows box stats and performance.
3. More geometrical features such as the spirals and the circles on demand by one click.
and more! feel free to let me know what you'd like to see!
█ How to use :
1. Put the script on your chart
2. Navigate to the settings
3. Select your box's time frame.
give the script a few seconds and you should be set.
This script is coded as an addon to the Gann ToolBox package/scripts.

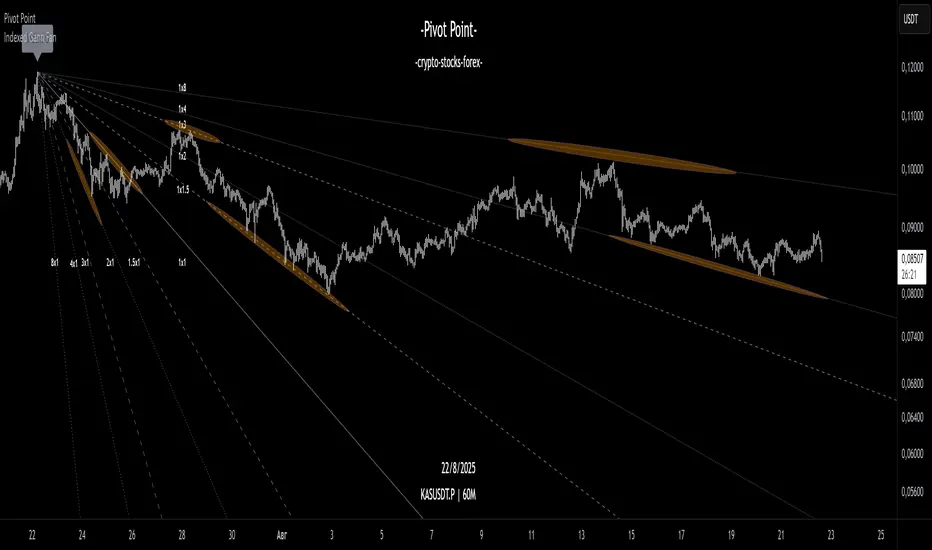
Indexed Gann Fan“This indicator automatically builds an unique trend-based Gann fan by selecting swing high/swing low ubased on price fluctuation index over time for each segment of the chart.
It helps traders identify the true market trend and pinpoint key support and resistance levels at precise angles.
Designed for traders familiar with Gann’s methodology who want a clearer understanding of market structure and greater confidence in their trading decisions.”
__________________________________________________________________________________
Индикатор автоматически по выбору экстремума строит уникальный трендовый веер Ганна, используя индекс колебаний цены во времени для каждого участка графика.
Помогает видеть направление тренда и определять ключевые углы поддержки и сопротивления.
Инструмент создан для трейдеров знакомых с методологией Ганна, которые хотят получать более ясное понимание рыночной структуры и принимать решения с максимальной уверенностью.
Gann ToolsThis is basically an updated version of my scripts with additional features, all in one instead of 3 separated scripts,
The script includes the following but not limited to:
1- Price Angles (Angles of Square of 9) with the ability to add extra primary angles or whole cycles, and the customization of every line color and style and more
2- Gann Star with the customization of every line color and style and more
3- Gann Grid with the customization of every line color and style and more
4- Gann Fan/s, that can be drawn from the all 4 directions/points, with the customization of every line color and style and more
5- Gann Square (Sq of 52/90/144) with the ability to extend boxes in all directions, and of course with the customization of every line color and style
The only reason that made me create 3 separated scripts, is that there was a limit of 55 line per script, and I had to draw a lot of lines, specially in the Grid, now that limit is 500 (crazy right?).
You can now select the starting point with a click instead of having to type the price by yourself, input whatever color you want for every single line that will be drawn on your screen.
I hope everyone enjoys using my indicator/s to plot their creativity on the chart.

Comprehensive 3'bars Gann Swings v6.5 (Architecture Fix)An indicator that displays 3-bar swings based on an original method inspired by the works of W.D. Gann.
___________________________________________________________________________________Индикатор отображающий 3 барные свинги по авторской методике, основанной на работах В.Д.Ганна
