ICT Turtle Soup (Liquidity Reversal)ICT Turtle Soup — Liquidity Reversal Detection
Classic Liquidity Trap Reversal Strategy for Smart Money Traders
This indicator implements the ICT Turtle Soup concept — a classic liquidity-based reversal pattern — which occurs when price runs above or below a recent swing level to grab liquidity, then sharply reverses. This pattern is commonly used in Smart Money Concepts (SMC) and Inner Circle Trader (ICT) strategies to anticipate false breakouts and high-probability reversals.
🔍 What This Script Does:
Identifies Swing Highs & Lows
Detects recent swing highs and lows using a customizable lookback period.
Tracks Liquidity Grabs
A bearish Turtle Soup setup is triggered when price breaks above a recent swing high but closes back below it.
A bullish Turtle Soup setup is triggered when price breaks below a recent swing low but closes back above it.
These conditions often signal liquidity traps, where price sweeps resting orders before reversing.
Plots Signals Directly on the Chart
Turtle Soup setups are marked with 🐢🔻 (bearish) and 🐢🔺 (bullish) labels.
Optional full-text labels can also be displayed for clarity and journaling.
Includes Alert Conditions
Alerts can be enabled to notify you of bullish or bearish Turtle Soup reversals in real-time.
⚙️ Customization Features:
Adjustable swing lookback period
Enable/disable Turtle Soup labels
Set label font size
Choose your preferred bullish/bearish signal colors
💡 How to Use:
Add this script to your chart (ideally on intraday timeframes such as 5m–15m).
Wait for a Turtle Soup signal near a key swing high/low or liquidity zone.
Combine with other confirmation tools (e.g., FVGs, Order Blocks, OTE) for stronger setups.
Use alerts to stay ahead of fast-moving reversals.
🧠 Why It Works:
Turtle Soup setups are rooted in liquidity theory — they exploit the market’s tendency to sweep obvious swing levels before reversing. These moves often trap retail traders and mark the beginning of Smart Money entries.
🔗 Best Used With:
Maximize the edge by combining this with other SMC tools:
✅ First FVG — Opening Range Fair Value Gap Detector
✅ ICT SMC Liquidity Grabs + OB + Fibonacci OTE Levels
✅ Liquidity Levels — Smart Swing Lows
Together, they create a complete ecosystem for identifying, confirming, and executing liquidity-driven trade setups with precision.
"fvg" için komut dosyalarını ara

Nef33 Forex & Crypto Trading Signals PRO
1. Understanding the Indicator's Context
The indicator generates signals based on confluence (trend, volume, key zones, etc.), but it does not include predefined SL or TP levels. To establish them, we must:
Use dynamic or static support/resistance levels already present in the script.
Incorporate volatility (such as ATR) to adjust the levels based on market conditions.
Define a risk/reward ratio (e.g., 1:2).
2. Options for Determining SL and TP
Below, I provide several ideas based on the tools available in the script:
Stop Loss (SL)
The SL should protect you from adverse movements. You can base it on:
ATR (Volatility): Use the smoothed ATR (atr_smooth) multiplied by a factor (e.g., 1.5 or 2) to set a dynamic SL.
Buy: SL = Entry Price - (atr_smooth * atr_mult).
Sell: SL = Entry Price + (atr_smooth * atr_mult).
Key Zones: Place the SL below a support (for buys) or above a resistance (for sells), using Order Blocks, Fair Value Gaps, or Liquidity Zones.
Buy: SL below the nearest ob_lows or fvg_lows.
Sell: SL above the nearest ob_highs or fvg_highs.
VWAP: Use the daily VWAP (vwap_day) as a critical level.
Buy: SL below vwap_day.
Sell: SL above vwap_day.
Take Profit (TP)
The TP should maximize profits. You can base it on:
Risk/Reward Ratio: Multiply the SL distance by a factor (e.g., 2 or 3).
Buy: TP = Entry Price + (SL Distance * 2).
Sell: TP = Entry Price - (SL Distance * 2).
Key Zones: Target the next resistance (for buys) or support (for sells).
Buy: TP at the next ob_highs, fvg_highs, or liq_zone_high.
Sell: TP at the next ob_lows, fvg_lows, or liq_zone_low.
Ichimoku: Use the cloud levels (Senkou Span A/B) as targets.
Buy: TP at senkou_span_a or senkou_span_b (whichever is higher).
Sell: TP at senkou_span_a or senkou_span_b (whichever is lower).
3. Practical Implementation
Since the script does not automatically draw SL/TP, you can:
Calculate them manually: Observe the chart and use the levels mentioned.
Modify the code: Add SL/TP as labels (label.new) at the moment of the signal.
Here’s an example of how to modify the code to display SL and TP based on ATR with a 1:2 risk/reward ratio:
Modified Code (Signals Section)
Find the lines where the signals (trade_buy and trade_sell) are generated and add the following:
pinescript
// Calculate SL and TP based on ATR
atr_sl_mult = 1.5 // Multiplier for SL
atr_tp_mult = 3.0 // Multiplier for TP (1:2 ratio)
sl_distance = atr_smooth * atr_sl_mult
tp_distance = atr_smooth * atr_tp_mult
if trade_buy
entry_price = close
sl_price = entry_price - sl_distance
tp_price = entry_price + tp_distance
label.new(bar_index, low, "Buy: " + str.tostring(math.round(bull_conditions, 1)), color=color.green, textcolor=color.white, style=label.style_label_up, size=size.tiny)
label.new(bar_index, sl_price, "SL: " + str.tostring(math.round(sl_price, 2)), color=color.red, textcolor=color.white, style=label.style_label_down, size=size.tiny)
label.new(bar_index, tp_price, "TP: " + str.tostring(math.round(tp_price, 2)), color=color.blue, textcolor=color.white, style=label.style_label_up, size=size.tiny)
if trade_sell
entry_price = close
sl_price = entry_price + sl_distance
tp_price = entry_price - tp_distance
label.new(bar_index, high, "Sell: " + str.tostring(math.round(bear_conditions, 1)), color=color.red, textcolor=color.white, style=label.style_label_down, size=size.tiny)
label.new(bar_index, sl_price, "SL: " + str.tostring(math.round(sl_price, 2)), color=color.red, textcolor=color.white, style=label.style_label_up, size=size.tiny)
label.new(bar_index, tp_price, "TP: " + str.tostring(math.round(tp_price, 2)), color=color.blue, textcolor=color.white, style=label.style_label_down, size=size.tiny)
Code Explanation
SL: Calculated by subtracting/adding sl_distance to the entry price (close) depending on whether it’s a buy or sell.
TP: Calculated with a double distance (tp_distance) for a 1:2 risk/reward ratio.
Visualization: Labels are added to the chart to display SL (red) and TP (blue).
4. Practical Strategy Without Modifying the Code
If you don’t want to modify the script, follow these steps manually:
Entry: Take the trade_buy or trade_sell signal.
SL: Check the smoothed ATR (atr_smooth) on the chart or calculate a fixed level (e.g., 1.5 times the ATR). Also, review nearby key zones (OB, FVG, VWAP).
TP: Define a target based on the next key zone or multiply the SL distance by 2 or 3.
Example:
Buy at 100, ATR = 2.
SL = 100 - (2 * 1.5) = 97.
TP = 100 + (2 * 3) = 106.
5. Recommendations
Test in Demo: Apply this logic in a demo account to adjust the multipliers (atr_sl_mult, atr_tp_mult) based on the market (forex or crypto).
Combine with Zones: If the ATR-based SL is too wide, use the nearest OB or FVG as a reference.
Risk/Reward Ratio: Adjust the TP based on your tolerance (1:1, 1:2, 1:3)

Market DNA: Structure, Volume, Range, and SessionsMarket DNA: Structure, Volume, Range, and Sessions**
The Market DNA indicator combines market structure, volume analysis, trading ranges, and global trading sessions into a single, comprehensive tool for traders. It helps identify key price levels, volume patterns, consolidation phases, and active market periods, enabling informed trading decisions.
Market Structure Detects swing highs and lows using `ta.pivothigh` and `ta.pivotlow`, plotting them as red/green triangles to highlight support/resistance and trend reversals.
- Fractal Volume Zones (FVG): Highlights areas of significant buying/selling pressure by comparing current volume to an average over a lookback period; high-volume zones are marked with a semi-transparent blue background.
- Trading Range: Defines a price channel using the Average True Range (ATR) and a multiplier, creating upper/lower bands to identify consolidation, breakouts, and potential trade levels.
- Market Sessions: Highlights major global trading sessions (Asia, Europe, US) with colored backgrounds (purple, teal, yellow) to indicate liquidity and volatility shifts.
How It Works
- Swing points help analyze trends and reversals.
- FVG confirms price movements with high volume for stronger signals.
- Trading range bands assist in identifying breakout opportunities and setting stops/take-profits.
- Session highlights allow traders to adapt strategies based on regional activity.
Customization
- Adjust `swing_length` for sensitivity in detecting turning points.
- Modify `volume_lookback` to control volume averaging.
- Tune `range_multiplier` for wider/narrower trading bands.
- Enable/disable session highlighting via `session_highlight`.
Use Cases
- Identify trends and key levels using swing points and FVG.
- Spot breakout opportunities with trading range bands.
- Adapt strategies to regional trading sessions for optimal timing.
This all-in-one indicator provides a clear, customizable view of the market, empowering traders to make data-driven decisions across asset classes and timeframes.

LRLR [TakingProphets]LRLR (Low Resistance Liquidity Run) Indicator
This indicator identifies potential liquidity runs in areas of low resistance, based on ICT (Inner Circle Trader) concepts. It specifically looks for a series of unmitigated swing highs in a downtrend that form without any bearish fair value gaps (FVGs) between them.
What is an LRLR?
- A Low Resistance Liquidity Run occurs when price creates a series of lower highs without any bearish fair value gaps in between
- The absence of bearish FVGs indicates there is no significant resistance in the area
- These formations often become targets for smart money to collect liquidity above the swing highs
How to Use the Indicator:
1. The indicator will draw a diagonal line connecting a series of qualifying swing highs
2. A small "LRLR" label appears to mark the pattern
3. These areas often become targets for future price moves, as they represent zones of accumulated liquidity with minimal resistance
Key Points:
- Minimum of 4 consecutive lower swing highs
- No bearish fair value gaps can exist between these swing highs
- The diagonal line helps visualize the liquidity run formation
- Can be used for trade planning and identifying potential reversal zones
Settings:
- Show Labels: Toggle the "LRLR" label visibility
- LRLR Line Color: Customize the appearance of the diagonal line
Best Practices:
1. Use in conjunction with other ICT concepts and market structure analysis
2. Pay attention to how price reacts when returning to these levels
3. Consider these areas as potential targets for smart money liquidity grabs
4. Most effective when used on higher timeframes (4H and above)
Note: This is an educational tool and should be used as part of a complete trading strategy, not in isolation.

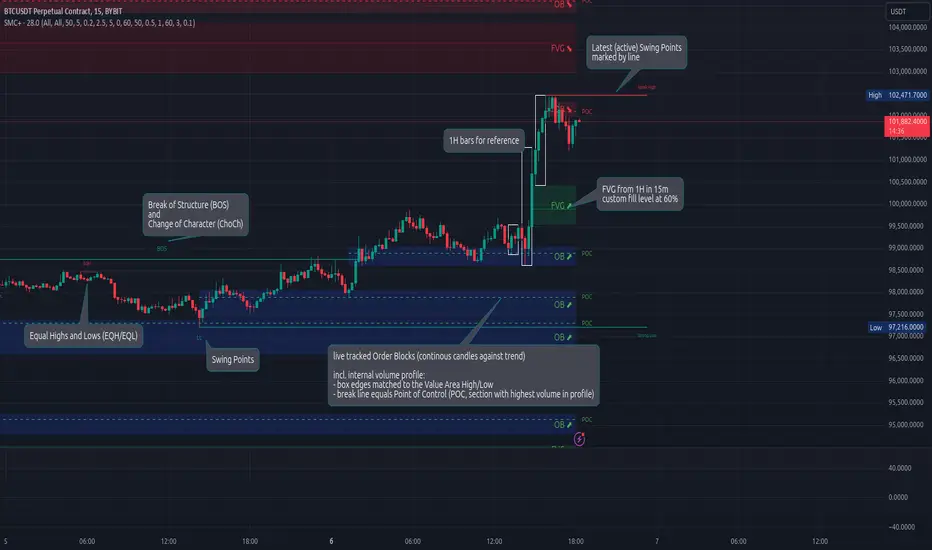
Smart Money Concepts (Advanced)Inspired and initially based on LuxAlgo's Smart Money Concepts Indicator I created a library lib_smc that started to convert every function and return objects. This allowed certain customizations like tracking the current fill level of FVGs or tracking the creation of Order Blocks, by monitoring consecutive bars against the current trend.
This indicator is provided as is, based on, but probably not always be up to date with my lib_smc that I am using for my projects.
WARNING: This indicator shows EXPERIMENTAL Order Blocks that are tracked LIVE. Unlike usual Order Blocks these are not just based on the last confirmed Swing Point (formed 50 bars before) but on consecutive candles opposing an unconfirmed trend. Blocks are confirmed by price movements relative to the unconfirmed block and unconfirmed swing points. This means that some Order Blocks will appear on pullbacks, as well as reversals.
Features
Swing Points (HH / LH / HL / LL), indicating support / resistance zones price might reject off of or want to push through
Market Structure (BOS / ChoCh), indicates confirmation for a continued / changing trend
live Order Blocks (OB), see warning above.
Fair Value Gaps (FVG), optional from higher timeframes
Equal Highs / Lows (EQH/EQL), indicates strong support / resistance zones, especially when the bars forming it have long wicks toward that zone
using my lib_no_delay all moving averages are working from bar 0, so it can be used on charts with limited bars
Enhanced London Session SMC SetupEnhanced London Session SMC Setup Indicator
This Pine Script-based indicator is designed for traders focusing on the London trading session, leveraging smart money concepts (SMC) to identify potential trading opportunities in the GBP/USD currency pair. The script uses multiple techniques such as Order Block Detection, Imbalance (Fair Value Gap) Analysis, Change of Character (CHoCH) detection, and Fibonacci retracement levels to aid in market structure analysis, providing a well-rounded approach to trade setups.
Features:
London Session Highlight:
The indicator visually marks the London trading session (from 08:00 AM to 04:00 PM UTC) on the chart using a blue background, signaling when the high-volume, high-impulse moves tend to occur, helping traders focus their analysis on this key session.
Order Block Detection:
Identifies significant impulse moves that may form order blocks (supply and demand zones). Order blocks are areas where institutions have executed large orders, often leading to price reversals or continuation. The indicator plots the high and low of these order blocks, providing key levels to monitor for potential entries.
Imbalance (Fair Value Gap) Detection:
Detects and highlights price imbalances or fair value gaps (FVG) where the market has moved too quickly, creating a gap in price action. These areas are often revisited by price, offering potential trade opportunities. The upper and lower bounds of the imbalance are visually marked for easy reference.
Change of Character (CHoCH) Detection:
This feature identifies potential trend reversals by detecting significant changes in market character. When the price action shifts from bullish to bearish or vice versa, a CHoCH signal is triggered, and the corresponding level is marked on the chart. This can help traders catch trend reversals at key levels.
Fibonacci Retracement Levels:
The script calculates and plots the key Fibonacci retracement levels (0.618 and 0.786 by default) based on the highest and lowest points over a user-defined swing lookback period. These levels are commonly used by traders to identify potential pullback zones where price may reverse or find support/resistance.
Directional Bias Based on Market Structure:
The indicator provides a market structure analysis by comparing the current highs and lows to the previous periods' highs and lows. This helps in identifying whether the market is in a bullish or bearish state, providing a clear directional bias for trade setups.
Alerts:
The indicator comes with built-in alert conditions to notify the trader when an order block, imbalance, CHoCH, or other significant price action event is detected, ensuring timely action can be taken.
Ideal Usage:
Timeframe: Suitable for intraday trading, particularly focusing on the London session (08:00 AM to 04:00 PM UTC).
Currency Pair: Specifically designed for GBP/USD but can be adapted to other pairs with similar market behavior.
Trading Strategy: Best used in conjunction with a price action strategy, focusing on the key levels identified (order blocks, FVG, CHoCH) and using Fibonacci retracement levels for precision entries.
Target Audience: Ideal for traders who follow smart money concepts (SMC) and are looking for a structured approach to identify high-probability setups during the London session.

ICT HTF Candles [Source Code] (fadi)Plotting a configurable higher timeframe on current chart's timeframe helps visualize price movement without changing timeframes. It also plots FVG and Volume Imbalance on the higher timeframe for easier visualization.
With ICT concepts, we usually wait for HTF break of structure and then find an entry on a lower timeframe. With this indicator, we can set it to the HTF and watch the develop of price action until the break of structure happens. We can then take an entry on the current timeframe.
Settings
HTF Higher timeframe to plot
Number of candles to display The number of higher timeframe candles to display to the right of current price action
Body/Border/Wick The candle colors for the body, border, and wick
Padding from current candles The distance from current timeframe's candles
Space between candles Increase / decrease the candle spacing
Candle width The size of the candles
Imbalance
Fair Value Gap Show / Hide FVG on the higher timeframe
Volume Imbalance Show / Hide Volume Imbalance on the higher timeframe
Trace
Trace lines Extend the OHLC lines of the higher timeframe and the source of each
Label Show/Hide the price levels of the OHLC

Liquidity Levels/Voids (VP) [LuxAlgo]The Liquidity Levels/Voids (VP) is a script designed to detect liquidity voids & levels by measuring traded volume at all price levels on the market between two swing points and highlighting the distribution of the liquidity voids & levels at specific price levels.
🔶 USAGE
Liquidity is a fundamental market force that shapes the trajectory of assets.
The creation of a liquidity level comes as a result of an initial imbalance of supply/demand, which forms what we know as a swing high or swing low. As more players take positions in the market, these are levels that market participants will use as a historical reference to place their stops. When the levels are then re-tested, a decision will be made. The binary outcome here can be a breakout of the level or a reversal back to the mean.
Liquidity voids are sudden price changes that occur in the market when the price jumps from one level to another with little trading activity (low volume), creating an imbalance in price. The price tends to fill or retest the liquidity voids area, and traders understand at which price level institutional players have been active.
Liquidity voids are a valuable concept in trading, as they provide insights about where many orders were injected, creating this inefficiency in the market. The price tends to restore the balance.
🔶 SETTINGS
The script takes into account user-defined parameters and detects the liquidity voids based on them, where detailed usage for each user-defined input parameter in indicator settings is provided with the related input's tooltip.
🔹 Liquidity Levels / Voids
Liquidity Levels/Voids: Color customization option for Unfilled Liquidity Levels/Voids.
Detection Length: Lookback period used for the calculation of Swing Levels.
Threshold %: Threshold used for the calculation of the Liquidity Levels & Voids.
Sensitivity: Adjusts the number of levels between two swing points, as a result, the height of a level is determined, and then based on the above-given threshold the level is checked if it matches the liquidity level/void conditions.
Filled Liquidity Levels/Voids: Toggles the visibility of the Filled Liquidity Levels/Voids and color customization option for Filled Liquidity Levels/Voids.
🔹 Other Features
Swing Highs/Lows: Toggles the visibility of the Swing Levels, where tooltips present statistical information, such as price, price change, and cumulative volume between the two swing levels detected based on the detection length specified above, Coloring options to customize swing low and swing high label colors, and Size option to adjust the size of the labels.
🔹 Display Options
Mode: Controls the lookback length of detection and visualization.
# Bars: Lookback length customization, in case Mode is set to Present.
🔶 RELATED SCRIPTS
Liquidity-Voids-FVG
Buyside-Sellside-Liquidity
Swing-Volume-Profiles

KeitoFX Dynamic Indicator Free vers.This script represents a versatile dynamic indicator called "KeitoFX Dynamic Indicator Free version." It is developed by the author "KeitoFX" and operates as a custom indicator overlaying on financial charts. The indicator utilizes a unique algorithm to dynamically identify bullish and bearish candlestick patterns with specific criteria.
Key Features:
- The indicator visually marks bullish and bearish candlestick patterns using triangle shapes, providing quick visual cues to traders.
- Bullish patterns are detected when the closing price is higher than the opening price and the high and low prices of the candlestick form a narrow range.
- Bearish patterns are identified when the closing price is lower than the opening price, and the high and low prices also form a narrow range.
The indicator incorporates flexible settings that users can customize to fit their trading preferences:
- Users can choose the table's placement, either at the "Top Right," "Middle Right," or "Bottom Right" of the chart.
- Customizable dimensions for the width and height of the table are available.
- Adjustable text size settings ranging from "Auto" to "Huge" are provided for the displayed text.
- A descriptive table containing trading rules and conditions is optionally displayed below the price chart.
Additional Information:
- The indicator's color scheme is harmonious, with shades of purple and neutral tones.
- The "Require FVG" setting influences the pattern detection's sensitivity.
- A dynamic standard deviation is calculated based on the selected displacement settings and historical candle ranges.
- A "FVG" condition enhances pattern accuracy.
- Bullish and bearish pattern detection includes overlapping with other predefined arrays to increase pattern significance.
Note:
This indicator is provided under the Mozilla Public License 2.0, as indicated by the source code comment at the beginning of the script. Users are encouraged to review and comply with the license terms when using this indicator in their trading activities.

itradesize /\ Overnight Session & Silver BulletOvernight Session & Silver Bullet indicator
The indicator can be divided into two separate stuff:
ONS ( Overnight Session ) based on TCM’s ( TheCurrencyMerchant ) theory and Silver Bullet based on what ICT ( InnerCircleTrader ) is teaching to us.
Overnight Session
• ONS will be always based on Chicago 4am to 8am time according to TCM’s CME teaching.
The indicator has the option to show TSO ( Today’s session only ) which is good to have the chart not messed up by it. At this time when it comes to backtesting just turn this off to have the past ONS and SB ranges showed up on your chart.
• Mid line at the ONS range is useful to have as you are able to decide wether price is in a premium or a discount under the ONS.
If Im a buyer target is above the range, if Im a seller target is below the range.
• You are also able to have SD ( Standard Deviation ) lines for price projections. In the variety of TCM’s videos you are able to have a deeper knowledge.
• You can also extend Today’s ONS lines to the very end of the chart which could make an easier looking on the levels you eyeing with.
Silver Bullet
It’s based on New York time as ICT ( Inner Circle Trader ) is always teaching to us that we should use New York time, every time when it comes to his concepts.
Silver Bullets are always be there aiming of an opposing liquidity pool. They are working even on choppy days.
Silver Bullet hours:
• 03:00 - 04:00am NY Time
• 10:00 - 11:00am NY Time
• 02:00 - 03:00pm NY Time
SB highlighted areas could be shown as a box or a range according to your taste, with or without Start/End lines.
Both of them ca be used to form trades.
You should dig yourself into Silver Bullet ( InnerCircleTrader ) and Overnight Session ( TheCurrencyMerchant ) teachings before the use of the indicator.
Simple setups
• Silver Bullet
Look 20-30 minutes before any SB where the Buy or Sell program has started.
Where the first 1m FVG ( Fair Value Gap ) appears under the range, enter the trade.
Expect only a 5 handle move as a beginner.
1m chart is a must for these kind of FVG entries. ( 30s , 15s can also be used )
• ONS
Price is trading aggressively out of the range to take liquidity.
Once price grabbed liquidity that candle on the 3-5m could considered as on order block for the further movement.
If you are trading in the range, then the opposite side can be the target, if its out of the range and trading one sided, then use standard deviations as 0.5 is a minimum target.

VXD SupercycleVXD is a brand new indicator and still developing. to minimize stop losses and overcome sideways market conditions, Higher Timeframe are recommended
Trend lines
-using Rolling VWAP as trend line to determined if Volume related to a certain price.
-you can switch RVWAP to EMA in the setting
ATR
-trailing 12*ATR and 2.4 Mutiplier
Pivot point and Rejected Block
Pivot show last High and low of a price in past bars
Rejected Block show when that High or Low price are important level to determined if it's Hidden Divergence or Divergence
Symbols on chart show Premium and Discount Prices
X-Cross - show potential reversal trend with weak volume .
O-circle - show potential reversal trend with strong volume .
Setting
Momentum: RSI = 25 , RSI MA = 14
Trend: Rolling VWAP and ATR and Subhag
Trailing STOP: ATR 12 x 2.4
Highlight Bars color when volume is above SMA 6
SMA200 act as TP Line
Risk:Reward Calculation
if Buy your Stoploss will be previous Pivot low
if Sell your Stoploss will be previous Pivot high and will be calculated form there, then show TP in Orange color line
VXD เป็นระบบเทรดที่ผมทดลองเอาหลาย ๆ ไอเดีย ทั้งจาก Youtube facebook และกลุ่มคนต่าง ๆ มารวบรวมไว้ แล้วตกผลึกขึ้นมาเป็นระบบนี้ ใน Timeframe ใหญ่ ๆ สามารถลากได้ทั้ง Cycle กันเลย
Trend lines
-ใช้ Rolling VWAP ของแอพ Tradingview (สามารถตั้งแค่าเป็น EMA ได้)
ATR
-ใช้ค่า ATR 12 Mutiplier 2.4
Pivot point and Rejected Block
Pivot โชว์เส้น High low และมีผลกับออเดอร์ หากแท่งเทียนปิดทะลุเส้นนี้
Rejected Block วาดแนวรับ-ต้าน อัตโนมัติ ใช้ประกอบ RSI ว่ามี Divergence หรือไม่
สัญลักษณ์ต่าง ๆ
X-Cross - แท่งกลืนกิน วอลุ่มน้อย
O-circle - แท่งกลืนกิน มีวอลุ่ม
Setting
Momentum: RSI = 25 , RSI MA = 14
Trend: Rolling VWAP and ATR and Subhag
Trailing STOP: ATR 12 x 2.4
Highlight Bars color when volume is above SMA 6
SMA200 act as TP Line
Risk:Reward Calculation
หาก Buy จุด SL จะอยู่ที่ Pivot low
หาก Sell จุด SL จะอยู่ที่ Pivot high และระบบจะคำนวณจากตรงนั้น จากนั้นแสดงเป็นเส้น TP สีส้ม
This Strategy Combined the following indicators and conditioning by me
ATR , RSI , EMA , SMA
Rolling VWAP - /script/ZU2UUu9T-Rolling-VWAP/
Regression Lines - Subhag form Subhag Ghosh /script/LHHBVpQu-Subhag-Ghosh-Algo-Version-for-banknifty/
Rejection Block , Pivots , High Volume Bars and PPDD form Super OrderBlock / FVG / BoS Tools by makuchaku & eFe /script/aZACDmTC-Super-OrderBlock-FVG-BoS-Tools-by-makuchaku-eFe/
ขอให้รวยครับ.

NY PM Session Highlighter (For Hawaiian Traders)Purpose: This script is designed for traders targeting the New York PM Session (1:30 PM – 4:00 PM ET). Based on 5-year historical data for ES and NQ, this window represents a high-probability period for 2:1 Risk-to-Reward setups as institutional traders rebalance and drive price toward the daily close.
Key Features:
DST-Automated Tracking: Uses the America/New_York timezone to ensure the lines stay accurate during Daylight Saving transitions.
Visual Guidance: Draws a dashed vertical line at the 1:30 PM ET start and the 4:00 PM ET close.
Session Boxing: Highlights the background in a soft blue to define the "trading zone," helping you ignore the low-volume "lunch doldrums" that occur immediately before.
Hawaii-Friendly: Automatically adjusts to your local Hawaii Standard Time (HST) so you don't have to calculate the 5 or 6-hour offset manually.
Trade Logic:
Wait for the 1:30 PM ET (8:30 AM HST) line.
Look for a sweep of the 12:00 PM – 1:00 PM (Lunch) range.
Enter on a Market Structure Shift (MSS) or Fair Value Gap (FVG).
Target a 2:1 Reward-to-Risk ratio, aiming to exit by the 4:00 PM ET line.

ICT Trend Candles [KTY]ICT Trend Candles Indicator
This indicator colors candles based on market structure direction.
Candle colors change when BOS (Break of Structure) or CHoCH (Change of Character) occurs, allowing you to quickly identify the current trend direction.
Structure-Based Coloring
- Bullish structure break → Candles turn bullish color
- Bearish structure break → Candles turn bearish color
- Color changes at trend shift points
Two Structure Options
- INTERNAL: Short-term structure based, faster color changes
- EXTERNAL: Long-term structure based, slower but more reliable
1. Select structure type (INTERNAL or EXTERNAL)
2. Watch for candle color changes to identify trend shifts
3. Combine with other ICT concepts (OB, FVG, Liquidity) for confluence
Pro Tips:
- Use INTERNAL for scalping and short-term trading
- Use EXTERNAL for swing trading and position trading
- Color change after liquidity sweep = high probability reversal signal
Show Trend Candles: Toggle candle coloring on/off
Structure Type: Select INTERNAL or EXTERNAL
Bullish Color: Color when in bullish structure
Bearish Color: Color when in bearish structure
This indicator is designed for educational purposes.
Color change does not guarantee trend reversal.
Always combine with proper risk management.
If you find this indicator helpful, please leave a like and follow for more ICT-based tools!

ICT Kill Zone [KTY]ICT Kill Zone Indicator
This indicator displays ICT Kill Zones, which are high-liquidity trading periods during major exchange opening hours.
Smart money tends to make significant moves during these times, resulting in increased volatility and trading volume.
Four Kill Zones
- AS KZ (Asian): Lower volatility, range formation period
- LDN KZ (London): European session start, liquidity surge
- NY KZ (New York): Europe + US overlap, strongest moves
- LDN CL KZ (London Close): London closing, position unwinding period
Market Hours Display
- Shows actual trading hours for Asian, London, and New York markets
- High/low lines for each session
Session Indicators
- Visual markers at the bottom of chart showing active kill zones
- Labels when each kill zone begins
1. Identify which kill zone is currently active
2. Signals during kill zones (CHoCH/BOS, OB, FVG) have higher significance
3. Watch for Asian range breakout in London/New York sessions
4. Be cautious of false moves outside kill zone hours
Pro Tips:
- New York kill zone typically has the strongest moves
- London open often sets the daily direction
- Asian session forms the range that gets broken later
- Combine kill zones with other ICT concepts for best results
Show Kill Zones: Toggle kill zone display on/off
Show Market Hours: Toggle market hours lines on/off
Show Latest Data Only: Display only the most recent kill zone
Daylight Saving Time: Apply DST adjustment (On/Off)
Asian Kill Zone Started
London Kill Zone Started
New York Kill Zone Started
London Close Kill Zone Started
This indicator is designed for educational purposes.
Kill zones only display on 15-minute or lower timeframes.
Always combine with proper risk management.
If you find this indicator helpful, please leave a like and follow for more ICT-based tools!

ICT OTE [KTY]ICT OTE (Optimal Trade Entry) Indicator
This indicator automatically displays the OTE (Optimal Trade Entry) level based on ICT (Inner Circle Trader) methodology.
OTE is the 70.5% Fibonacci retracement level, which is considered a key level where price often reacts during pullbacks.
70.5% Fibonacci Level
- Automatically calculates and displays the OTE level
- Green line with ⬆ indicates uptrend retracement
- Red line with ⬇ indicates downtrend retracement
Multi-Timeframe Support
- Display OTE from two different timeframes simultaneously (LTF & HTF)
- HTF OTE levels carry more significance
Dynamic Calculation
- Automatically identifies swing high and low for the selected timeframe
- OTE level updates as new highs/lows form
1. Identify the OTE level on your chart
2. Watch for price reaction when approaching the OTE line
3. Combine with Market Structure (CHoCH/BOS) for directional bias
4. Look for confluence with OB, FVG, or Liquidity zones at OTE level
Pro Tips:
- HTF OTE (4H, 1D) is more reliable than LTF
- OTE aligned with Order Block increases significance
- Most effective in trending markets, less reliable in ranging conditions
Show OTE: Toggle OTE display on/off
LTF: Enable and select lower timeframe for OTE calculation
HTF: Enable and select higher timeframe for OTE calculation
Price Touched OTE Level
OTE Direction Changed to Bullish
OTE Direction Changed to Bearish
This indicator is designed for educational purposes.
OTE level touch does not guarantee price reversal.
Always combine with proper risk management.
If you find this indicator helpful, please leave a like and follow for more ICT-based tools!

ICT Premium & Discount [KTY]ICT Premium & Discount Indicator
This indicator automatically displays Premium and Discount Zones based on ICT (Inner Circle Trader) methodology.
Premium & Discount zones divide the current price range into upper and lower areas based on swing highs and lows. This helps traders understand where price sits within the broader range.
Three-Zone Structure
- Premium Zone (Red): Upper portion of the range
- Equilibrium (Gray Dashed): Middle 50% line, fair value reference point
- Discount Zone (Green): Lower portion of the range
Multi-Timeframe Support
- Display zones from two different timeframes simultaneously (LTF & HTF)
- HTF zones carry more significance than LTF zones
Dynamic Range Calculation
- Automatically identifies swing high and low for the selected timeframe
- Zones update as new highs/lows form
1. Identify the current zone - Is price in Premium, Equilibrium, or Discount?
2. Combine with Market Structure - Use CHoCH/BOS to confirm directional bias
3. Look for confluence - OB, FVG, or Liquidity zones within Premium/Discount add significance
4. Use Equilibrium as reference - Price often reacts around the 50% level
Pro Tips:
- HTF zones (4H, 1D) are more significant than LTF zones
- Most effective when combined with other ICT concepts
- Ranging markets may see price oscillate between zones without clear direction
Show Premium & Discount Zones: Toggle zone display on/off
LTF: Enable and select lower timeframe for zone calculation
HTF: Enable and select higher timeframe for zone calculation
Price Entered Premium Zone
Price Entered Discount Zone
This indicator is designed for educational purposes.
Always combine with proper risk management.
If you find this indicator helpful, please leave a like and follow for more ICT-based tools!

ICT Market Structure [KTY]ICT Market Structure Indicator
Overview
This indicator automatically detects and displays Market Structure based on ICT (Inner Circle Trader) methodology.
Market structure analysis identifies trend direction and potential reversal points by tracking swing highs and lows. Understanding structure is fundamental to ICT trading concepts.
Key Features
Internal & External Structure
Internal Structure: Short-term swings for quick trend detection (displayed with dashed lines)
External Structure: Long-term swings for major trend identification (displayed with solid lines)
Choose to display Internal, External, Both, or None
CHoCH & BOS Detection
CHoCH (Change of Character): First sign of potential trend reversal
BOS (Break of Structure): Confirmation of trend continuation
Internal labels: lowercase (choch/bos)
External labels: uppercase (CHOCH/BOS)
Equal Highs & Equal Lows
EQH: Multiple highs at similar price levels — liquidity pool above
EQL: Multiple lows at similar price levels — liquidity pool below
Smart money often sweeps these levels before reversing
Swing Point Labels
HH (Higher High): Uptrend continuation
HL (Higher Low): Uptrend confirmation
LH (Lower High): Downtrend continuation
LL (Lower Low): Downtrend confirmation
How to Use
Identify the trend using HH/HL (bullish) or LH/LL (bearish) patterns
Wait for CHoCH as the first signal of potential reversal
Confirm with BOS in the new direction
Watch EQH/EQL levels for potential liquidity sweeps
Combine with OB, FVG, Liquidity zones for higher probability setups
Pro Tips:
External structure is more reliable than internal structure
CHoCH after liquidity sweep = high probability reversal
Multiple timeframe analysis increases accuracy
Internal CHoCH can provide early entries, but with higher risk
Settings
SettingDescriptionStructure TypeSelect INTERNAL, EXTERNAL, ALL, or NONEInternal Structure ColorsCustomize bullish/bearish colors for internal structureExternal Structure ColorsCustomize bullish/bearish colors for external structureEQL & EQHToggle equal highs/lows display with custom colorsSwing PointsToggle HH/HL/LH/LL labels with custom color
Alerts
Structure Alerts:
🟢 Bullish CHoCH (Internal)
🔴 Bearish CHoCH (Internal)
🟢 Bullish CHOCH (External)
🔴 Bearish CHOCH (External)
🟢 Bullish BOS (Internal)
🔴 Bearish BOS (Internal)
🟢 Bullish BOS (External)
🔴 Bearish BOS (External)
Equal Levels Alerts:
🔴 Equal Highs (EQH)
🟢 Equal Lows (EQL)
Swing Point Alerts:
📈 Higher High (HH)
📈 Higher Low (HL)
📉 Lower High (LH)
📉 Lower Low (LL)
Notes
This indicator is designed for educational purposes
Internal structure provides faster signals but more noise
External structure is slower but more reliable
Always combine with proper risk management
If you find this indicator helpful, please leave a like and follow for more ICT-based tools!


ICT Order Block [KTY]ICT Order Block Indicator
Overview
This indicator automatically detects and displays Order Blocks (OB) based on ICT (Inner Circle Trader) methodology.
Order Blocks are price zones where Smart Money (institutions, banks) executed large buy/sell orders. These zones often act as strong support and resistance levels, making them valuable for identifying high-probability entry points.
Key Features
Multi-Timeframe Support
Display OBs from two different timeframes simultaneously (LTF & HTF)
HTF Order Blocks provide stronger, more reliable levels
Bullish & Bearish Order Blocks
Bullish OB: Last bearish candle before a significant up move → Acts as support
Bearish OB: Last bullish candle before a significant down move → Acts as resistance
Breaker Block Detection
When an OB is broken, it converts to a Breaker Block (BB)
Role reverses: Former support becomes resistance, and vice versa
Volume Analysis
Displays volume at OB formation
Shows upper/lower volume balance ratio (%)
Lower percentage = stronger one-sided order flow = more significant zone
OB Body Lines
Dotted lines showing the candle body (open/close) within the OB
Useful for precise entry points
How to Use
Identify the trend on higher timeframes
Wait for price to re-enter an Order Block zone
Look for confirmation (candlestick patterns, lower timeframe structure break)
Enter within the OB, set stop loss below/above the OB
Pro Tips:
OBs that overlap with FVG (Fair Value Gap) or OTE (Optimal Trade Entry) have higher probability
HTF Order Blocks are more reliable than LTF
Fresh (untested) OBs tend to have stronger reactions
Settings
SettingDescriptionLTF / HTFEnable and select timeframes for Order Block detectionBullish OB CountNumber of Bullish Order Blocks to display (1-10)Bearish OB CountNumber of Bearish Order Blocks to display (1-10)Show Breaker BlocksToggle Breaker Block displayShow OB Body LinesToggle candle body lines within OBLabel ColorCustomize text color inside OB boxes
Alerts
🟢 Bullish OB Detected
🔴 Bearish OB Detected
🟢 Bullish OB Touched
🔴 Bearish OB Touched
🟢 Bullish BB Touched
🔴 Bearish BB Touched
💥 Bullish OB → BB Conversion
💥 Bearish OB → BB Conversion
Notes
This indicator is designed for educational purposes
Always combine with proper risk management
Past performance does not guarantee future results
If you find this indicator helpful, please leave a like and follow for more ICT-based tools!

Gold Professional MacrosMacro Window Descriptions
London Opening Sweep (08:00 – 08:30 CET)
Purpose: The "Judas Swing" window. It captures the initial surge of European liquidity, often creating a false move to sweep Asian Session highs or lows before establishing the true London trend.
London LOD/HOD (09:30 – 10:00 CET)
Purpose: The "Maturity" window. This is where the morning trend often establishes its Low of Day (LOD) or High of Day (HOD) before entering a mid-day consolidation.
Pre-NY News Window (13:30 – 14:00 CET)
Purpose: The "High-Impact" window. Corresponds to 07:30–08:00 NY Time, aligning with major US economic data releases (CPI, Jobless Claims) that trigger immediate repricing in Gold.
NY Open Power Surge (15:15 – 15:45 CET)
Purpose: The "Volatility" window. Marks the official New York open. This is the prime time for ICT Silver Bullet setups as heavy institutional volume enters the market.
The Gold Fix Liquidation (16:00 – 16:30 CET)
Purpose: The Master Macro. This is the London Gold Fix. It is the most critical period for Gold, often resulting in massive reversals or final daily expansions as central banks and bullion dealers settle prices globally.
PM Reversal (19:30 – 20:00 CET)
Purpose: The "Correction" window. Often sees Gold retracing to fill Fair Value Gaps (FVG) or imbalances created during the violent NY morning session.
Key Features of the Script
Visual Time-Boxing: Color-coded background zones for instant recognition.
Automated Labeling: Clearly identifies each macro at the moment of inception.
Multi-Timeframe Compatible: Optimized for M1, M5, and M15 execution charts.
Timezone Synchronized: Hard-coded to Europe/Paris (CET) to align perfectly with European and US market overlaps.

ICT Silver Only Toolkit (XAGUSD) No Baby ICTThis indicator is designed exclusively for Silver (XAGUSD) and applies core ICT concepts to help traders identify high-probability smart-money setups. It automatically plots the Asia session range, London and New York killzones, previous day high/low, equal highs and lows (liquidity pools), Asia liquidity sweeps, and ICT fair value gaps (FVGs).
The toolkit also includes “Do Nothing” warning labels to help traders avoid low-quality conditions such as trading outside killzones, extended pre-NY moves, or impulsive candles. Built for precision and patience, this indicator supports traders who wait for liquidity, displacement, and retracement rather than chasing price.
Best used on 1–15 minute charts during London and New York sessions.
No indicators for bias guessing. No scalping gimmicks. Just clean ICT structure for Silver.

NY Open 60-Min VarBox + Pure ICT FVG V8This is little indicator that shows the NY-Stock Exc. opening candles with a vertical line and a label. It works for different time scales. It also finds the bullish FVGs. It is a good tool for those who follow the opening of the exchange.

cephxs + fadi / Previous Time Based Dealing RangesPREVIOUS TIME BASED DEALING RANGES
Visualize previous and current higher timeframe dealing ranges with dual-box OHLC representation, extending reference lines, and HTF candle displays.
Open Source Fork of @fadizeidan 's HTF Candles Indicator
OVERVIEW
This indicator displays time-based dealing ranges from higher timeframes directly on your chart. It shows the complete price action structure of previous (or current/forming) periods using a dual-box system: one box for the full High-Low range and another for the Open-Close body. Reference lines extend from key levels to help identify potential support, resistance, and mean reversion zones.
Perfect for traders who use ICT concepts, market structure analysis, or any methodology that relies on understanding where price has been relative to previous dealing ranges.
KEY FEATURES
Dual-Box Range Visualization: Each range displays two boxes - the full H-L range (outer) and the O-C body (inner) - giving immediate visual context of candle structure
Multiple Timeframes: Support for 90m, 4H, 6H, 1D, 1W, 1M, and 3M ranges
Previous/Current Mode: View completed ranges (Previous) or the forming range (Current) with real-time updates
Auto Mode: Automatically selects the appropriate range based on your chart timeframe
Reference Lines: Extending lines from High, Mid, Low (or Quadrants: H/75/M/25/L) with trade-into detection
HTF Candle Display: Visual HTF candles positioned to the right of price for context
6H Session Support: Session-aware ranges for Asia, London, NY AM, and NY PM with labeled names
Open Line: Vertical line marking the range's opening price/time
Imbalance Detection: Fair Value Gaps and Volume Imbalances highlighted on HTF candles
MODE OPTIONS
Previous/Current: Previous shows the last completed range. Current shows the forming range with dynamic H/L/C updates
Auto/Manual: Auto selects range by chart TF. Manual lets you choose specific ranges
Extend Box (Current): In Current mode, extends the box's right edge as price develops
AUTO MODE TIMEFRAME LOGIC
Auto mode now selects up to 3 ranges automatically based on chart timeframe, providing multi-timeframe context:
Chart ≤ 3m → 90m + 6H + 1D
Chart 4m-14m → 6H + 1D + 1W
Chart 15m-59m → 1D + 1W (+ 1M available)
Chart 1H-3H → 1D + 1W + 1M
Chart 4H-23H → 1W + 1M + 3M
Chart ≥ 1D → 1M + 3M
INPUTS
Mode
Mode: Previous/Current - Choose completed or forming range
Auto/Manual: Auto selects range by chart TF, Manual lets you choose
Extend Box (Current): Extends box right edge with price (Current mode only)
Show Range Boxes: Toggle box visibility (lines remain visible when off)
Filter Lines by Distance: When boxes are hidden, hide reference lines that are too far from current price (Really Close / Balanced / Slightly Far)
Previous Ranges
Range 1: Enable/disable, select timeframe (90m/4H/6H/1D/1W/1M/3M), max display count (1-2)
Range 2: Second range layer for multi-timeframe analysis
Range 3: Third range layer for additional context
Reference Lines
Line Mode: Levels (H/M/L) or Quadrants (H/75/M/25/L)
Line Style: Solid, dashed, or dotted
Line Thickness: 1-4 pixels
Show Labels: Toggle reference line labels
Label Offset: Distance of labels from current price (1-20 bars)
HTF Candle Levels: Show mini H/M/L lines on HTF candles
Open Line: Vertical line at range open with customizable style
Range Boxes & Colors
Per-Range Colors: Customize box and line colors for each timeframe (90m, 4H, 6H, 1D, 1W, 1M, 3M)
HTF Candle Styling
Show HTF Candles: Toggle HTF candle display
Body/Border/Wick Colors: Customize bull and bear candle appearance
Padding/Buffer/Width: Control candle spacing and size
Labels
HTF Label: Show timeframe label above/below candles
Remaining Time: Countdown timer to candle close
Label Position: Top, Bottom, or Both
Label Alignment: Align across timeframes or follow individual candles
Imbalance
Fair Value Gap: Highlight FVGs on HTF candles
Volume Imbalance: Highlight VIs on HTF candles
HOW TO USE
Add the indicator to your chart
Choose Previous or Current mode based on your analysis preference
Use Auto mode for intelligent range selection, or Manual to select specific timeframes
Reference lines extend from range levels - watch for price reactions at H/M/L
In Current mode, observe how the range develops with real-time updates
Use the HTF candles on the right for quick multi-timeframe context
REFERENCE LINE LABELS
Labels follow this format:
Previous mode: pD-H (previous Daily High), pW-M (previous Weekly Mid), p6H-London-L (previous 6H London Low)
Current mode: D-H (Daily High), W-M (Weekly Mid), 6H-Asia-L (6H Asia Low)
6H SESSION NAMES
Asia: 18:00-00:00 ET
London: 00:00-06:00 ET
NYAM: 06:00-12:00 ET
NYPM: 12:00-18:00 ET
RECOMMENDED TIMEFRAMES
Tick/Second charts: 90m ranges
1-5 minute charts: 6H or 1D ranges
15-60 minute charts: 1D or 1W ranges
4H charts: 1W or 1M ranges
Daily charts: 1M or 3M ranges
Or simply use Auto mode to let the indicator choose the optimal range.
TIPS
The Mid (M) level often acts as equilibrium - watch for mean reversion plays
High and Low levels are natural support/resistance zones
In Current mode, watch how price interacts with the forming range boundaries
Combine with your existing analysis for confluence
The Open Line helps identify the "true open" of each range for gap analysis
DISCLAIMER
This indicator is for educational and informational purposes only.
Past performance does not guarantee future results.
Always use proper risk management and never risk more than you can afford to lose.
Trading involves substantial risk of loss and is not suitable for all investors.
CREDITS
Original indicator by @fadizeidan.
Enhanced by cephxs/fstarcapital
CHANGELOG
Pro + v1.1: Reupload + Added 90m ranges for ultra-low timeframe analysis, distance-based line filtering (lines-only mode), third range slot.
Open sourced so users can add more slots.
Enjoy 🤙
