Smart Money Zones (FVG + OB) + MTF Trend Panel## Overview
Professional-grade institutional trading zones indicator that identifies **Fair Value Gaps (FVG)** and **Order Blocks (OB)** - key price inefficiencies where smart money operates. Includes a comprehensive **Multi-Timeframe Trend Panel** for complete market context at a glance.
## Core Features
### 🎯 Fair Value Gaps (FVG)
Fair Value Gaps occur when price moves so aggressively that it leaves an "imbalance" or "gap" in the market structure. These zones often act as magnets where price returns to find liquidity.
**Detection Logic:**
- **Bullish FVG**: When current candle's low is above the high of the candle 2 bars ago
- **Bearish FVG**: When current candle's high is below the low of the candle 2 bars ago
- Requires strong impulse candle (configurable body percentage threshold)
- Color-coded zones: Green for bullish, Red for bearish
### 📦 Order Blocks (OB)
Order Blocks represent the last opposite candle before a significant price move - the zone where institutional orders were placed before the breakout.
**Detection Logic:**
- Identifies the last bearish candle before a strong bullish breakout (Bullish OB)
- Identifies the last bullish candle before a strong bearish breakout (Bearish OB)
- Validates breakout strength using ATR multiplier (1.2x default)
- Color-coded zones: Blue for bullish, Orange for bearish
### 📊 Multi-Timeframe Trend Panel
Real-time trend analysis across **7 timeframes** displayed in an elegant dashboard:
- **1 Minute** - Ultra short-term scalping
- **5 Minutes** - Short-term momentum
- **15 Minutes** - Intraday swings
- **30 Minutes** - Session trends
- **1 Hour** - Multi-session trends
- **4 Hours** - Daily structure
- **Daily** - Long-term direction
**Visual Indicators:**
- 🟢 Green circle = Bullish trend
- 🔴 Red circle = Bearish trend
- Clean, professional table design with customizable position and size
## Intelligence Features
### 🧠 Zone Strength Rating
Every zone is automatically classified by strength based on size relative to ATR:
- **VERY STRONG** - 2.0x ATR or more (major institutional zones)
- **STRONG** - 1.5x to 2.0x ATR (significant zones)
- **MEDIUM** - 1.0x to 1.5x ATR (moderate zones)
- **WEAK** - Below 1.0x ATR (minor zones)
Strength rating helps you prioritize which zones to trade from!
### 📉 Smart Mitigation Tracking
Zones automatically track how much they've been "filled" or mitigated:
- Calculates penetration percentage as price enters the zone
- Zones turn **gray** when 50%+ mitigated or fully filled
- Option to **auto-delete** mitigated zones to keep chart clean
- Live zones extend dynamically with price action
### 🎨 Trend Filter (Optional)
When enabled, only shows zones aligned with the current trend:
- Uses customizable MA period (default 50)
- Bullish zones only appear in uptrend
- Bearish zones only appear in downtrend
- Reduces noise and false signals significantly
## Customization Options
### Display Settings
- Toggle FVGs and OBs independently
- Adjust max zones per type (5-200)
- Choose to remove or gray out mitigated zones
- Color customization for all zone types
### Detection Parameters
- **Min Impulse Body %**: Controls how strong the impulse candle must be (0.3-1.0)
- **Order Block Lookback**: How many bars to look back for OB validation (5-50)
- **ATR Length**: Period for ATR calculation (5-50)
### Trend Filter
- Enable/disable trend filtering
- Adjustable MA period for trend determination
### MTF Panel
- Show/hide the trend panel
- 4 position options: Top Right, Top Left, Bottom Right, Bottom Left
- 3 size options: Small, Normal, Large
- Customizable MA period for trend calculation across all timeframes
## Trading Applications
### 1. **Liquidity Grab Entries**
Wait for price to sweep a zone (50%+ mitigation) then enter on reversal. Smart money often "hunts" these zones before the real move begins.
### 2. **Confluence Trading**
Look for zones that align with:
- Multiple timeframe trends showing same direction
- Multiple FVGs/OBs stacking in same area
- Key support/resistance levels
### 3. **Breakout Confirmation**
Use Order Blocks to confirm the strength of breakouts. Strong OBs indicate institutional participation.
### 4. **Retracement Entries**
Enter when price returns to a fresh, unmitigated zone in the direction of the higher timeframe trend.
### 5. **Range Trading**
Identify FVG zones at range extremes - price often reverses at these inefficiencies.
## How It Works
**Fair Value Gaps** form when the middle candle creates such aggressive movement that it leaves a price gap between the high/low of surrounding candles. Institutional traders know these gaps get filled.
**Order Blocks** mark the origin of major moves. The last opposite-colored candle before a breakout is where large orders were placed. Price often returns to these zones for "retests" before continuing.
**Mitigation** happens when price returns to fill these zones. The indicator tracks this automatically, showing you which zones are still "fresh" and which have been used up.
## Best Practices
✅ **Use higher timeframe trends** - Always check the MTF panel before taking trades
✅ **Trade fresh zones** - Unmitigated zones (not gray) have the highest probability
✅ **Combine with price action** - Look for rejection wicks and engulfing candles at zones
✅ **Respect zone strength** - VERY STRONG and STRONG zones are most reliable
✅ **Use trend filter** - Especially on lower timeframes to reduce false signals
❌ **Don't overtrade** - Not every zone will react, wait for confirmation
❌ **Don't ignore context** - Check the MTF panel for conflicting trends
❌ **Don't chase** - Wait for price to come to the zone, don't enter mid-zone
## Technical Details
- **Non-repainting**: All zones are drawn on confirmed candles only
- **Performance optimized**: Uses efficient array management with per-type caps
- **Real-time updates**: Zones extend and track mitigation as price moves
- **Universal compatibility**: Works on all markets and timeframes
## Recommended Settings by Style
**Scalping (1m-5m charts):**
- Max zones: 10-15
- Use trend filter: ON
- MTF Panel: Focus on 1m-15m trends
- Remove mitigated: ON (keep chart clean)
**Day Trading (5m-1H charts):**
- Max zones: 15-20
- Use trend filter: ON
- MTF Panel: Focus on 15m-4H trends
- Remove mitigated: OFF (track zone history)
**Swing Trading (1H-D charts):**
- Max zones: 20+
- Use trend filter: Optional
- MTF Panel: Focus on 1H-1D trends
- Remove mitigated: OFF (important zones persist)
---
## Perfect For
- Smart Money Concept (SMC) traders
- ICT methodology followers
- Institutional order flow traders
- Price action traders seeking key zones
- Multi-timeframe analysis enthusiasts
**Compatible with all markets:** Forex, Crypto, Stocks, Indices, Commodities, Futures
*Trade where the institutions trade. Follow the smart money.*
"fvg" için komut dosyalarını ara

🟡 GOLD 4H HUD v8.9 — Loose ICT OB + Strong/Weak + FVG/HVN/LVNGOLD 4H HUD v8.9 is a clean, structured Smart Money Concepts (SMC)–based analysis tool designed exclusively for XAUUSD on the 4-hour timeframe.
It focuses on the three most important elements for institutional orderflow analysis:
✔ Loose ICT Order Blocks (Demand/Supply)
✔ Fair Value Gaps (FVG)
✔ Volume Profile Zones (HVN/LVN/POC)
The script builds a professional-style HUD that displays the key institutional regions and structural levels that matter most for gold traders.
📌 Key Features
1 — Market Structure Engine (HH/HL & BOS)
The indicator detects:
Minor swing Highs and Lows
Last confirmed HH / HL levels
Break of Structure (BOS) for directional bias
EMA-200 trend filter (UP / DOWN / NEUTRAL)
This gives traders a clean structural read without clutter or noise.
2 — Loose FVG Engine (Tolerance-Based ICT Gaps)
A soft-threshold FVG engine detects “loose” Fair Value Gaps using a 0.1% price tolerance.
This method ensures:
Fewer missed imbalances
Cleaner OB/FVG alignment
Higher accuracy on 4H gold displacement legs
FVGs automatically shift to the right side of the chart for clean visualization.
3 — Order Block Engine (Demand/Supply + Strong/Weak Classification)
A simplified ICT-style OB engine scans the past few candles whenever BOS is detected.
It identifies:
Demand OB during bullish BOS
Supply OB during bearish BOS
Strong OB if fully nested inside an active FVG
Weak OB otherwise
OB boxes include:
Clear color coding (strong vs. weak)
Price range labels inside each box
Automatic right-shift for visual clarity
4 — Volume Profile Engine (POC / HVN / LVN / VAH / VAL)
Based on a rolling window (default 120 bars), the script builds a lightweight volume distribution.
It displays:
POC (Point of Control)
HVN (High Volume Node)
LVN (Low Volume Node)
Value Area High / Low
HVN/LVN zones are shown as right-shifted colored boxes with price labels.
These zones help identify:
Institutional accumulation
Low-liquidity rejection points
Areas where price tends to react strongly
5 — Support / Resistance Mapping
The script automatically generates:
OB-based support/resistance
Swing-high/swing-low levels
HVN/LVN structural levels
These are displayed in the HUD for fast reference.
6 — Professional HUD Panel
A compact, easy-to-read HUD summarizes:
Trend direction
Latest HH/HL
OB ranges (Strong/Weak)
HVN/LVN price zones
POC
Multi-layer support & resistance
This turns the script into a fully functional analysis dashboard.
📌 What This Indicator Is NOT
To avoid misunderstanding:
It does not take entries or generate buy/sell signals
It does not auto-detect CHOCH, MSS, SMT, or sweeps
It is not a trading bot
This tool is designed as an institutional-style map and analysis HUD, not a strategy.
📌 Best Use Case
This indicator is ideal for traders who want to:
Read institutional structure on XAUUSD
Identify clean Demand/Supply zones
Visualize FVG/OB/HVN interactions
Track high-value liquidity levels
Build directional bias on 4H before dropping to execution timeframes
⚠ Important Note
This tool is designed exclusively for the 4H timeframe.
Using it on lower timeframes will display a warning.

Quantura - Fair Value GapIntroduction
“Quantura – Fair Value Gap” is a precision-engineered institutional concept indicator designed to automatically identify, visualize, and manage Fair Value Gaps (FVGs) across any market or timeframe. It enables traders to observe price inefficiencies, potential liquidity voids, and retracement areas that often act as magnets for price rebalancing.
Originality & Value
Unlike many public FVG scripts that only highlight candle gaps, this indicator integrates dynamic filters and adaptive logic to determine the strength and reliability of each gap. It merges overlapping zones intelligently and optionally extends valid imbalances forward for ongoing reference.
Its value lies in:
Dynamic statistical filtering based on gap standard deviation.
Optional volume confirmation for high-confidence FVGs.
Automatic merging of overlapping or adjacent gaps for clean visualization.
Support for both bullish and bearish imbalances.
Signal alerts when gaps are filled or rebalanced by price.
Functionality & Core Logic
Detects Fair Value Gaps by comparing candle-to-candle price displacement.
Applies a Gap Filter (standard deviation-based) to qualify valid gaps.
Optionally validates gaps formed under significant volume conditions.
Draws color-coded boxes to mark bullish (discount) and bearish (premium) inefficiencies.
Monitors each FVG until price fills the gap, at which point the box is visually closed.
Provides optional signal markers (“▲” or “▼”) when rebalancing occurs.
Parameters & Customization
Gap Filter: Sets the minimum statistical deviation required for a valid FVG. Higher values detect fewer, stronger gaps.
Volume Filter: Toggles additional validation using relative volume strength.
Volume Sensitivity: Adjusts how much above-average volume must be present to confirm a gap.
Bullish/Bearish Colors: Customize color schemes for imbalance zones.
Extend Gaps: Optionally extend open gaps forward for better confluence tracking.
Signals: Enables or disables gap-fill signal markers.
Visualization & Display
Bullish FVGs: Appear in blue-tinted boxes, indicating potential demand-side inefficiencies.
Bearish FVGs: Appear in red-tinted boxes, representing potential supply-side inefficiencies.
Overlapping zones are merged automatically to maintain clarity.
Filled gaps remain visible for historical context, allowing for post-event analysis.
Optional signal arrows display when price returns to rebalance an FVG.
Use Cases
Identify institutional inefficiencies and liquidity voids.
Detect premium and discount levels in trending markets.
Combine with market structure or order block indicators for confluence.
Track when price rebalances inefficiencies to refine entry/exit points.
Build FVG-based algorithmic strategies that rely on structural imbalance resolution.
Limitations & Recommendations
The indicator detects structural imbalances but does not predict future direction or guarantee profitability.
Volume filters may behave differently across brokers due to data-source differences.
Use alongside structure or liquidity tools for enhanced decision-making.
Extreme volatility or illiquid assets may generate temporary invalid gaps.
Markets & Timeframes
Compatible with all markets (crypto, forex, equities, indices, futures) and all timeframes. Recommended for multi-timeframe confluence analysis — e.g., detecting higher-timeframe FVGs and refining lower-timeframe entries.
Author & Access
Developed 100% by Quantura. Published as a Open-source script indicator. Access is free.
Compliance Note
This description adheres fully to TradingView’s House Rules and Script Publishing Requirements . It provides a detailed explanation of originality, core logic, limitations, and appropriate use — with no unrealistic or misleading performance claims.

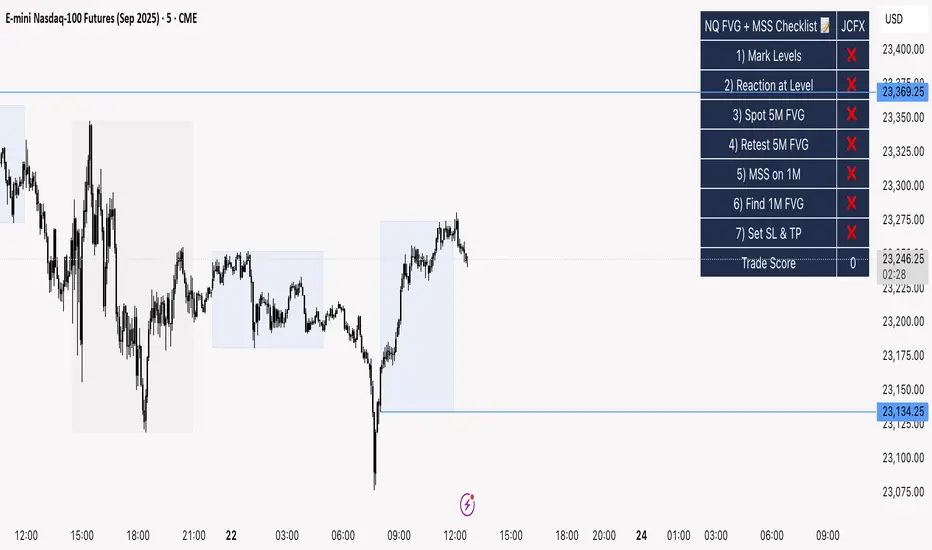
NQ FVG + MSS ChecklistThe NQ FVG + MSS Quick Checklist is a simple yet powerful visual tool for traders focusing on the Nasdaq 100 (NQ) futures. It provides a step-by-step checklist to assess trade setups based on key market concepts like Fair Value Gaps (FVG), Market Structure Shifts (MSS), session highs/lows, and previous day levels.
This indicator helps you quickly see which elements of your trading plan are met before entering a trade. Each checklist item can be manually toggled, and a cumulative Trade Score provides a quick visual guide to setup strength.
Key Features:
Step-by-step checklist for NQ trading setups
Track levels: Session highs/lows & Previous Day High/Low
Spot 5M FVG and Retests
Identify MSS on 1M and find 1M FVG inside MSS
Manual SL & TP guidance
Trade Score for quick setup strength assessment
Fully visible table overlay on top of the chart
How to Use:
Mark session & previous day levels
Observe reaction at key levels (Sweep or Continue)
Identify 5M FVG and any retests
Spot 1M MSS and 1M FVG inside MSS
Set SL/TP based on FVG extremes and next session levels
Check the cumulative Trade Score for setup confirmation
Note: This indicator is manual input-based, letting traders tick off items as they analyze the chart, making it a lightweight trading checklist HUD that stays on top of all chart elements.
ICT Directional FVG Indicator (Buffered SL)This is the first indicator I have ever made, and I am very new to Pine Script. I’ve tried my best to create this as a strategy, but I’m still learning, so please be kind and constructive with your feedback!
ICT Directional FVG Indicator (Buffered SL)
This indicator is designed for traders who follow ICT (Inner Circle Trader) concepts, focusing on Fair Value Gaps (FVGs), liquidity sweeps, and session-based trading. It automatically detects bullish and bearish FVGs, highlights them on the chart, and identifies liquidity sweep events. The indicator features three customizable Kill Zones (London, New York, and Asia sessions), each with independent toggles and color-coded backgrounds for clear visual separation.
Key features:
Fair Value Gap Detection: Highlights bullish and bearish FVGs in real time.
Liquidity Sweep Alerts: Marks potential liquidity sweep events for both highs and lows.
Session Kill Zones: Toggle each Kill Zone (London, New York, Asia) independently; background color changes only in enabled zones.
Trade Signal Visualization: Plots entry, stop loss, and take profit levels based on FVG and sweep logic, with a user-defined stop loss buffer.
Customizable Display: Easily enable or disable FVGs, sweeps, trade levels, and each Kill Zone to suit your strategy.
This tool is ideal for ICT-based traders who want a clear, automated view of FVGs, sweeps, and session activity, with full control over which sessions and signals are displayed.

2:30 [LuciTech]this is a technical analysis tool designed to highlight key price levels and patterns during a specific trading window, based on UK time (Europe/London). It overlays visual elements on the chart, including a 12 PM reference line, Buy Side Liquidity (BSL) and Sell Side Liquidity (SSL) levels, a highlighted 2:30 PM candle, and Engulfing Fair Value Gaps (FVGs). This indicator is intended for traders who focus on intraday price action and liquidity zones.
Features
The 12 PM Line displays a vertical line at 12:00 PM (UK time) to mark the start of the session. It’s customizable, allowing you to enable or disable it and adjust its color.
BSL/SSL Lines track the highest high (BSL) and lowest low (SSL) from 12:00 PM to 2:00 PM (UK time). These lines extend horizontally until 3:30 PM, after which they remain static at their last recorded levels. You can customize them by enabling or disabling visibility, adjusting colors, choosing a line style (solid, dashed, or dotted), and setting the width.
The 2:30 PM Candle highlights the candle at 2:30 PM (UK time) with a distinct color. It’s customizable, with options to enable or disable it and change its color.
Engulfing FVG (Fair Value Gap) identifies bullish and bearish engulfing patterns with a gap from the prior candle’s range. It draws a shaded box over the FVG area, and you can customize it by enabling or disabling it and adjusting the box color.
How It Works
The indicator operates within a session starting at 12:00 PM (UK time). BSL/SSL levels update between 12:00 PM and 2:00 PM, with lines extending until 3:30 PM. After 3:30 PM, these lines freeze.
BSL/SSL lines show the highest price (BSL) and lowest price (SSL) reached during the 12:00 PM to 2:00 PM window. After 3:30 PM, they remain static, marking the final range boundaries.
The 2:30 PM candle emphasizes a key timestamp, often of interest to intraday traders.
Engulfing FVGs detect significant price gaps created by engulfing candles, which may indicate potential reversal or continuation zones.
Settings
12 PM Line Settings let you toggle visibility and set the line color.
BSL/SSL Line Settings allow you to toggle visibility, set BSL and SSL colors, choose a line style (Solid, Dashed, Dotted), and adjust width (1-4).
2:30 Candle Settings let you toggle visibility and set the candle color.
Engulfing FVG Settings allow you to toggle visibility and set the box color.
Interpretation
The 12 PM Line serves as a reference for the session start.
BSL/SSL Lines may act as potential support or resistance zones or highlight liquidity areas. After 3:30 PM, they remain static, showing the session’s final range.
The 2:30 PM Candle can be monitored for price action signals, such as reversals or breakouts.
Engulfing FVGs shaded areas may indicate imbalances in supply and demand, useful for identifying trade opportunities or stop-loss placement.
Notes
The timezone is set to Europe/London (UK time). Ensure your chart’s timezone aligns for accurate results.
This indicator is best used on intraday timeframes, such as 1-minute or 5-minute charts.
It provides visual aids for analysis and does not generate buy or sell signals on its own.

ICT Balanced Price Range - Double FVG with VolumeThis is an FVG indicator combined with volume to identify moments when a sudden volume spike creates a price gap.
Additionally, I've added the ICT Balanced Price Range, which occurs when two opposing FVGs form a connected gap. This gap has a high probability of reversal and is one of the key signs of liquidity sweeps.
Unlike other FVG indicators that filter FVGs based on ATR, average price, or range, I believe such methods lead to overfitting and may not work across multiple pairs with a single setting. Instead, I only filter FVGs when there are consecutive overlapping FVGs.
The indicator includes full functionality:
Candle color customization
FVG line color customization
FVG fill color customization
BPR color customization
Adjustable average volume and volume threshold
Highlighting candles with abnormal volume
Enjoy and make sure to backtest thoroughly before using!

ICT Judas Swing | Flux Charts💎 GENERAL OVERVIEW
Introducing our new ICT Judas Swing Indicator! This indicator is built around the ICT's "Judas Swing" strategy. The strategy looks for a liquidity grab around NY 9:30 session and a Fair Value Gap for entry confirmation. For more information about the process, check the "HOW DOES IT WORK" section.
Features of the new ICT Judas Swing :
Implementation of ICT's Judas Swing Strategy
2 Different TP / SL Methods
Customizable Execution Settings
Customizable Backtesting Dashboard
Alerts for Buy, Sell, TP & SL Signals
📌 HOW DOES IT WORK ?
The strategy begins by identifying the New York session from 9:30 to 9:45 and marking recent liquidity zones. These liquidity zones are determined by locating high and low pivot points: buyside liquidity zones are identified using high pivots that haven't been invalidated, while sellside liquidity zones are found using low pivots. A break of either buyside or sellside liquidity must occur during the 9:30-9:45 session, which is interpreted as a liquidity grab by smart money. The strategy assumes that after this liquidity grab, the price will reverse and move in the opposite direction. For entry confirmation, a fair value gap (FVG) in the opposite direction of the liquidity grab is required. A buyside liquidity grab calls for a bearish FVG, while a sellside grab requires a bullish FVG. Based on the type of FVG—bullish for buys and bearish for sells—the indicator will then generate a Buy or Sell signal.
After the Buy or Sell signal, the indicator immediately draws the take-profit (TP) and stop-loss (SL) targets. The indicator has three different TP & SL modes, explained in the "Settings" section of this write-up.
You can set up alerts for entry and TP & SL signals, and also check the current performance of the indicator and adjust the settings accordingly to the current ticker using the backtesting dashboard.
🚩 UNIQUENESS
This indicator is an all-in-one suit for the ICT's Judas Swing concept. It's capable of plotting the strategy, giving signals, a backtesting dashboard and alerts feature. Different and customizable algorithm modes will help the trader fine-tune the indicator for the asset they are currently trading. Three different TP / SL modes are available to suit your needs. The backtesting dashboard allows you to see how your settings perform in the current ticker. You can also set up alerts to get informed when the strategy is executable for different tickers.
⚙️ SETTINGS
1. General Configuration
Swing Length -> The swing length for pivot detection. Higher settings will result in
FVG Detection Sensitivity -> You may select between Low, Normal, High or Extreme FVG detection sensitivity. This will essentially determine the size of the spotted FVGs, with lower sensitivies resulting in spotting bigger FVGs, and higher sensitivies resulting in spotting all sizes of FVGs.
2. TP / SL
TP / SL Method ->
a) Dynamic: The TP / SL zones will be auto-determined by the algorithm based on the Average True Range (ATR) of the current ticker.
b) Fixed : You can adjust the exact TP / SL ratios from the settings below.
Dynamic Risk -> The risk you're willing to take if "Dynamic" TP / SL Method is selected. Higher risk usually means a better winrate at the cost of losing more if the strategy fails. This setting is has a crucial effect on the performance of the indicator, as different tickers may have different volatility so the indicator may have increased performance when this setting is correctly adjusted.

Gaps Trend [ChartPrime]The Gaps Trend - ChartPrime indicator is designed to detect Fair Value Gaps (FVGs) in the market and apply a trailing stop mechanism based on those gaps. It identifies both bullish and bearish gaps and provides traders with a way to manage trades dynamically as gaps appear. The indicator visually highlights gaps and uses the detected momentum to assess trend direction, helping traders identify price imbalances caused by strong buy or sell pressure.
⯁ KEY FEATURES & HOW TO USE
⯌ Fair Value Gap (FVG) Detection :
The indicator automatically detects both bullish and bearish FVGs, identifying gaps between candle highs and lows. Bullish gaps are shown in green, and bearish gaps in purple. These gaps indicate price imbalances driven by strong momentum, such as when there is significant buying or selling pressure.
Use : Traders can use FVG detection to identify periods of high price momentum, offering insight into potential continuation or exhaustion of trends.
⯌ Trailing Stop Feature Based on FVGs :
A core feature of this indicator is the trailing stop mechanism, which adjusts dynamically based on the identified FVGs. When a bullish gap is detected, the trailing stop is placed below the price to capture upward momentum, while bearish gaps result in a trailing stop placed above the price. This feature helps traders stay in trends while protecting profits as the price moves.
Use : The trailing stop follows the momentum of the price, ensuring that traders can stay in profitable trades during strong trends and exit when the momentum shifts.
bullish set up
bearish set up
⯌ Trend Direction Indication :
The indicator colors the chart according to the current trend direction based on the position of the price relative to the trailing stop. Green indicates an uptrend (bullish gap), while purple shows a downtrend (bearish gap). This provides traders with a quick visual assessment of trend direction based on the presence of gaps.
Use : Traders can monitor the chart's color to stay aligned with the market’s trend, staying long during green phases and short during purple ones.
⯌ Gap Size Filtering :
Each detected gap is assigned a numerical ranking based on its size, with larger gaps having higher rankings. The gap size filter allows traders to only display gaps that meet a minimum size threshold, focusing on the most impactful gaps in terms of price movement.
Use : Traders can use the filter to focus on gaps of a certain size, filtering out smaller, less significant gaps. The numerical ranking helps identify the largest and most influential gaps for decision-making.
⯌ FVG Level Visualization :
The indicator can display dashed lines marking the levels of previously filled FVGs. These levels represent areas where price once experienced a gap and later filled it. Monitoring these levels can provide traders with key reference points for potential reactions in price.
Use : Traders can use these gap levels to track where price has filled gaps and potentially use these levels as zones for entry, exit, or assessing market behavior.
⯁ USER INPUTS
Filter Gaps : Adjust the size threshold to filter gaps by their size ranking.
Show Gap Levels : Toggle the display of dashed lines at filled FVG levels.
Enable Trailing Stop : Activate or deactivate the trailing stop feature based on FVGs.
Trailing Stop Length : Set the number of bars used to calculate the trailing stop.
Bullish/Bearish Colors : Customize the colors representing bullish and bearish gaps.
⯁ CONCLUSION
The Gaps Trend indicator combines Fair Value Gap detection with a dynamic trailing stop feature to help traders manage trades during periods of high price momentum. By detecting gaps caused by strong buy or sell pressure and applying adaptive stops, the indicator provides a powerful tool for riding trends and managing risk. The additional ability to filter gaps by size and visualize previously filled gaps enhances its utility for both trend-following and risk management strategies.

Precise Gap FinderPrecise Gap Finder
This indicator identifies Fair Value Gaps (FVGs) in price action and it is perfect for traders looking to exploit price imbalances and capitalize on trading opportunities.
How It Works:
The Precise Gap Finder detects Fair Value Gaps by analyzing three consecutive candles. A gap is identified when the middle candle’s price range (open to close) is not overlapped by the high and low prices of the surrounding candles. This indicates a price imbalance, which can be a strong signal for potential market moves.
How to Use for Trading:
Identify Entry Points: Use the highlighted Fair Value Gaps to spot potential entry points. An upward FVG can indicate a potential buying opportunity, while a downward FVG can signal a potential selling opportunity.
Confirm Trends: Combine the FVG signals with other technical indicators to confirm trends and enhance the accuracy of your trades.
Risk Management: Use FVGs to identify potential stop-loss and take-profit levels. Gaps can serve as natural support and resistance levels.
Backtesting: Analyze historical data to understand how FVGs have impacted price movements in the past, helping you refine your trading strategy

Session Sweeps [LuxAlgo]The Session Sweeps indicator combines ICT-based features for a complete trading methodology involving market sessions, market structure, and fair value gaps to find optimal entry conditions for trading price action.
Traders frequently tend to place stop/limit orders at the high and low points of major trading sessions such as Asian (Tokyo), European (London), and North American (New York), resulting in the establishment of liquidity pools at those particular levels. The Session Sweeps indicator is crafted to recognize and underscore occurrences of session sweeps or liquidity sweeps during these major trading sessions.
🔶 USAGE
Default settings utilize major forex trading sessions, yet users can select their preferred opening and closing times, rename the sessions, or adjust the colors. It's important to note that the specified times for each session align with the respective local timezones: Asian (Tokyo) UTC+9, European (London) UTC, and North American (New York) UTC-5.
If the price briefly crosses either the highest or lowest point of a market session. These movements, aiming at triggering stop losses, suggest potential shifts in the market direction. Detecting such movements is the fundamental purpose and core functionality of the script.
🔹Market Structure Shifts
A Market Structure Shift refers to a change in market direction, either from an uptrend to a downtrend or vice versa. A part of a common entry model when using session sweeps is waiting for the formation of a CHoCH after a session sweep.
🔹Fair Value Gaps
A Fair Value Gap (FVG) holds particular appeal for price action traders, emerging when there are inefficiencies or imbalances in the market, often a result of uneven buying and selling activity. The underlying concept of FVGs is that the market tends to revisit these inefficiencies before resuming its trajectory in alignment with the initial impulsive move.
After the formation of a CHoCH traders can enter a position when the price enters the area of a Fair Value Gap (FVG).
🔹Setup Examples
This entry setup is commonly used by ICT traders and is shared for informational & educational purposes only.
Long Positions (5-Minute Timeframe):
Wait for the previous session's low to be swept.
Look for a Bullish Choch.
Find a Bullish FVG formed by or before the Choch.
Entry Point: At the FVG.
Take Profit (TP): At the session high or aim for a 1:2 Risk-Reward Ratio.
Stop Loss (SL): At the session low or nearest Swing Low.
Take partial profits at intermediate swings, but don’t shift SL prematurely.
Short Positions (5-Minute Timeframe):
Wait for the previous session's high to be swept.
Look for a Bearish Choch.
Find a FVG formed by or before the Choch.
Entry Point: At the FVG.
Take Profit (TP): At the previous session's low or aim for a 1:2 RR.
Stop Loss (SL): At the session high or nearest Swing High.
Take partial profits at intermediate swings, but don’t shift SL prematurely.
🔶 SETTINGS
🔹Session Sweeps
Buyside Sweep Zones, Color, and Margin: toggles the visibility of bullside sweep zones, customizes the associated color, and sets the margin value defining the range of a bullside sweep zone.
Sellside Sweep Zones, Color, and Margin: toggles the visibility of sell-side sweep zones, customizes the associated color, and sets the margin value defining the range of a sell-side sweep zone.
Sweep Margin Length: specifies the maximum allowed length of a sweep zone invalidation, the length over which the price slightly invalidated the margin range.
Detect Sweeps Once per Session: if enabled will detect only once a sweep zone within a session.
Hide Fake Sweep Zones, and Color: controls the visibility and color of the fake sweep zones.
🔹Sessions
Session (Asia, London, New York AM, and New York PM), Start Time, and End Time: enables or disables the visibility of the named market session range, and customization of the session hours.
Color: color customization option of the named session.
Extend Max/Min: extends the highest and lowest price levels of the named session until the end of the next enabled session. This option is recommended to be enabled when sweep zone detection is activated to observe the relationship between the sweep zone and previous session extreme levels.
Extend Mid: extends the mean price levels of the named session until the end of the next enabled session. The extended line may serve as potential support and resistance levels.
Fill: enables/disables background coloring of the named session.
New York DST | London DST: enabling this option initiates Daylight Saving Time (DST) for New York or London. Note: Daylight Saving Time is not applied to the Asian (Tokyo) session.
Sessions Extreme Lines | Sessions Names: toggles the visibility of the highest and lowest price levels, as well as the names, for all market sessions.
Session Lines Width: sets the width of the lines for all sessions.
Session Fill Transparency: sets the background color transparency of the range for all sessions.
🔹Market Structure Shifts
Market Structure Shifts: toggles the visibility of market structure shifts, also known as change of character (CHoCH).
Detection Length: specifies the detection length.
Market Structure Shifts; Bull & Bear: color customization options.
🔹Fair Value Gaps
Fair Value Gaps: toggles the visibility of the fair value gaps.
Fair Value Gap Width Filter: specifies the filtering multiplier; additional details can be found in the tooltip of the respective input option.
Bullish & Bearish Imbalance: color customization options.
🔹Sessions Tabular View
Sessions Tabular View: toggles the visibility of the tabular view of the sessions, displaying date &time, status, and countdown counter.
Hide if not Forex Market Instrument: checks the market and automatically enables/disables the option based on the market instrument.
Table Text Size & Position: size and placement customization options
🔶 LIMITATIONS
Please be aware that fair value gap filtering cannot be applied to the initial 144 candles (with a fixed-length ATR) as the ATR value necessary for filtering won't be available during this period.
🔶 RELATED SCRIPTS
Buyside-Sellside-Liquidity
Sessions
Liquidity-Voids-FVG
Thank you to our community for the recommendation of this script. To explore additional conceptual scripts and related content, we invite you to visit >>> LuxAlgo-Scripts .

ICT Session Opening FVG / Silver Bullet [MK]Students of ICT concepts will know that the first FVG found within particular session periods can identify an important price level for intraday traders.
"Find the first FVG at the start of the session and drag a box from it to the right"....ICT
The script finds the first FVG (either bull or bear) within the following periods:
London Killzone (0200 - 0500) EST
02:00 - 0259
03:00 - 0359
0400 - 0459
Dead Zone (05-00 - 0600) EST
05-00 - 0559
0600 - 0659
NY AM Killzone (0700 - 1100) EST
0700 - 0759
0830 - 0929
0929 - 0959
1000 - 1100 (Silver Bullet)
A chart higher timeframe can be chosen to detect the FVGs and they will be displayed on lower timeframe. Default is 5min for detection. I like to then following price reacting to 5mi FVGs on a 1 min chart.
FVG boxes can be extended to the end of the session, or to any time within the current days trading hours. Colors/Labels/ Session Periods can all be edited. A maximum timeframe for display is available and
timezone can be adjusted.
FVGs are only shown for the current days trading hours.

Impulse Move FVG TrackerThis script identifies strong directional impulse moves and automatically plots Fair Value Gaps (FVGs) only in locations that are contextually relevant to those moves. It tracks consecutive candle bodies to determine when a large move up or down has occurred, calculates the midpoint of that impulse, and then displays bullish FVGs above the midpoint after strong upward moves and bearish FVGs below the midpoint after strong downward moves. The script operates only within a user-selected, scrollable time-of-day window and allows full control over FVG colors, extension length, minimum impulse size, and how many of the most recent FVGs remain on the chart. It is designed to reduce noise by showing FVGs only where price displacement suggests meaningful imbalance rather than marking every gap indiscriminately.

Volume-Weighted FVG (Fixed)1. The Core Concept: Identifying "Institutional Footprints"
FVG (Fair Value Gap): These are "gaps" or "voids" in price created by rapid movement. The market has a natural tendency to return and "fill" these gaps.
The Volume Filter: Unlike standard FVGs, this tool highlights zones created with high trading volume (Strong FVG). These represent the "footprints" of institutional traders—the "Big Money" that truly moves the market.
2. Trading the "Wall": Rejection and Reversal
The Rejection (Bounce): A Strong FVG acts as a powerful "wall." When price returns to this zone, unfilled orders often trigger, causing the price to bounce back (reject).
The Reversal (Breakout): If this "wall" is completely breached, it triggers a cascade of stop-losses from those who bet on the bounce. This results in a violent move in the opposite direction, known as a reversal.
The Retest: Once a "wall" is broken, its role flips (e.g., support becomes resistance). Trading the first retest of a broken Strong FVG is one of the highest-probability setups in scalping.
3. The Execution: High-Precision Entry
To achieve a Profit Factor (PF) of 5.0+, we combine three elements:
Structure: Confirm the trend using Multi-Timeframe (MTF) HH/HL (Higher Highs/Higher Lows).
The Zone: Price enters a Strong FVG (Darker color).
The Trigger: Enter when an Engulfing Candle breaks through the BB20 Middle Line, confirmed by an RCI 9 reversal.

HTF FVG + SessionsThis indicator combines multi-timeframe FVG A–C detection with intraday session boxes on a single chart.
It automatically finds bullish and bearish Fair Value Gaps on 15m, 30m, 1H, 4H, 1D and 1W timeframes.
Fresh FVGs are drawn in a transparent gold color, then dynamically shrink as price trades back into the gap.
Once price fully fills the gap, the FVG box and its label are automatically removed from the chart.
After the first touch, each FVG changes to a per-timeframe gray shade, making overlapping HTF gaps easy to see.
You can toggle each timeframe on/off and also globally enable/disable all FVGs from the settings panel.
Session boxes highlight Asia, London, NY AM, NY Lunch and NY PM using soft colored rectangles.
Each session box is plotted from the high to the low of that session and labeled with its name in white text.
A global “Show all session boxes” switch allows you to quickly hide or display the session structure.
This tool is designed for traders who want to combine FVG liquidity maps with clear intraday session context.

Greer Gap# Greer Gap Indicator (No mitigation: i.e. removing false signals)
## Summary
The **Greer Gap Indicator** identifies **Fair Value Gaps (FVGs)** and introduces specialized **Greer Bull Gaps (Blue)** and **Greer Bear Gaps (Orange)** to highlight high-probability trading opportunities. Unlike traditional FVG indicators, it avoids hindsight bias by not removing historical gaps based on future price action, ensuring transparency in signal accuracy. Built upon LuxAlgo’s FVG logic, it adds unique filtering: only the first Greer Gap after an opposite gap is plotted if its level (min for Bull, max for Bear) is not higher/lower than the previous Greer Gap of the same type, while all valid gaps are recorded for comparison. Traders can use these gaps as support/resistance or entry signals, customizable via timeframe, look back, and display options.
## Description
This indicator detects and displays **Fair Value Gaps (FVGs)** on the chart, with a focus on specialized **Greer Gaps**:
- **Bullish Gaps (Green)**: Areas where the low of the current candle is above the high of a previous candle (look back period), indicating potential upward momentum.
- **Bearish Gaps (Red)**: Areas where the high of the current candle is below the low of a previous candle, indicating potential downward momentum.
- **Greer Bull Gaps (Blue)**: A bullish gap that is above the latest bearish gap's max. Only the first such gap after a bearish gap is plotted if it meets criteria (not higher than the previous Greer Bull Gap's min), but all valid ones are recorded for comparison.
- **Greer Bear Gaps (Orange)**: A bearish gap that is below the latest bullish gap's min. Only the first such gap after a bullish gap is plotted if it meets criteria (not lower than the previous Greer Bear Gap's max), but all valid ones are recorded.
## How It Works
The script uses a dynamic look back period to detect FVGs. It maintains a record of all detected gaps and applies additional logic for Greer Gaps:
- **Greer Bull Gaps**: Checks if the new bullish gap's min is above the latest bearish gap's max. Plots only if it's the first since the last bearish gap and its min is <= previous Greer Bull min (or first one).
- **Greer Bear Gaps**: Checks if the new bearish gap's max is below the latest bullish gap's min. Plots only if it's the first since the last bullish gap and its max is >= previous Greer Bear max (or first one).
- **Resets**: A new bearish gap resets the Greer Bull Gap flag, and a new bullish gap resets the Greer Bear Gap flag.
## How to Use
- **Timeframe**: Set a higher timeframe (e.g., 'D' for daily) to detect gaps from that timeframe on the current chart.
- **Look back Period**: Adjust to change gap detection sensitivity (default: 34). Use 2 if you want to compare to LuxAlgo
- **Extend**: Controls how far right the gap boxes extend.
- **Show Options**: Toggle visibility of all bullish/bearish gaps or Greer Gaps.
- **Colors**: Customize colors for each gap type.
- **Application**: Use Greer Gaps as potential support/resistance levels or entry signals, but combine with other analysis for confirmation.
## Originality and Credits
This script is inspired by and builds upon the **"Fair Value Gap "** indicator by LuxAlgo (available on TradingView: ()).
**Credits**: Thanks to LuxAlgo for the core FVG detection logic.
**Significant Changes**:
- Added **Greer Bull and Bear Gap** logic for filtered, directional gaps with reset mechanisms.
- Introduced recording of all valid Greer Gaps without plotting all, to compare levels without hindsight bias.
- **No mitigation/removal of gaps**: Unlike LuxAlgo's approach, which mitigates (removes or alters) gaps based on future price action (e.g., when filled), this can create a hindsight bias where incorrect signals disappear over time. If a signal is used for a trade and later removed due to new data, it doesn't reflect real-time performance accurately. The Greer Gap avoids this by using gap comparisons to validate signals without altering historical boxes, ensuring transparency in when signals were right or wrong.

Fair Value Gap & Gap Profile [BigBeluga]This indicator is designed to help traders identify and utilize fair value gaps on price charts and analyze volume at these points. These gaps, formed by significant price movements, can act as key support and resistance levels. The indicator enhances trading strategies by visually representing these gaps, making it easier for traders to spot potential entry and exit points.
⦿ What Is A Fair Value Gap?
Before diving into the practical use of the Fair Value Gap in trading, it's crucial to have a clear understanding of what it is and how to identify it on your charts. The Fair Value Gap, or FVG , is a widely utilized tool among price action traders to detect market inefficiencies or imbalances. Sometimes you will even see them labeled as inefficiencies by other traders. These imbalances arise when buying or selling pressure is significant, resulting in a large upward or downward move, leaving behind an imbalance in the market.
The idea behind FVGs is that the market will eventually come back to these inefficiencies in the market before continuing in the same direction as the initial impulsive move. FVGs are important since traders can achieve an edge in the market. Price action traders can also use these imbalances as entry or exit points in the market.
By visually representing gaps and their profile, the Fair Value Gap (FVG) & Gap Profile indicator provides a historical overview of gaps within a specified lookback period, showing the distribution and density of gaps across different price levels. This insight helps traders identify zones where the price tends to move more fluidly, often encountering less resistance. High points on the Gap Profile indicate areas where gaps have occurred frequently in the past, which could serve as potential breakout or breakdown zones.
⦿ Key Features:
● Gap Detection and Visualization:
- Identifies Bullish and Bearish Gaps: Highlights gaps where the price moved significantly up or down along with a volume. Intensivity of color show strength of FVG by volume
- Filter for Significant Gaps: Allows users to filter out insignificant gaps, ensuring only relevant gaps are displayed.
● Customizable Display Options:
- Shows Filled Gaps: Option to display gaps that have been filled, aiding in the analysis of historical price movements.
- Displays Filled Gap Levels: Highlights the levels of filled gaps.
● Gap Profile:
Gap Profile Insight: The Gap Profile feature shows the distribution of gaps over a specified lookback period. High points on the FVG Profile indicate areas with a significant number of gaps in the past. These high points are signs of low resistance for price movement. Consequently, at these points, the price tends to move more easily without encountering strong resistance. Traders can use this information to identify potential breakout or breakdown zones where price action is likely to be more fluid.
● Grab Liquidity Detection:
- Collect liquidity Signals: Plots markers on the chart where price interacts with gap levels, providing potential trade signals based on liquidity.
⦿ How Traders Can Use This Indicator:
- Plan Trades: Use gaps as potential entry and exit points, based on whether the price is approaching, filling, or moving away from a gap.
- Analyze Market Trends: Understand historical price movements by analyzing filled gaps and their impact on current price action.
- Analyze Gap Profile: Identify zones where the price tends to move more fluidly, often encountering less resistance. High points on the Gap Profile indicate areas where gaps have occurred frequently in the past, which could serve as potential breakout or breakdown zones.
- Price imbalance: market will eventually come back to these inefficiencies and fill them. inefficiencies or imbalances in the market usually act as a magnet for price.
By incorporating the Fair Value Gap & Gap Profile indicator into their trading strategy, traders can gain a clearer understanding of market dynamics and make more informed trading decisions.

15m FVG Alerts with Timezone and time selectorThis indicator will help you detect 15m FVGs on NQ. After setting the alert, you can check the chart to see if the FVG aligns with the Bias. This way, when the price reenters this FVG, we can check the LTF for an IFVG that aligns with the Bias. If you find this FVG interesting, set a manual alert on the FVG again, let the price return, and see if you can initiate a continuation trade towards the clear DOL.
You can also specify a time window for the alerts to arrive.
This indicator is for "NQ1!"

Institutional Liquidity & FVG Tracker by Herman Sangivera(Papua)Institutional Liquidity & FVG Tracker (Precision SMC) by Herman Sangivera ( Papuan Trader )
This indicator is designed to identify key institutional levels by tracking Buy Side Liquidity (BSL), Sell Side Liquidity (SSL), and Fair Value Gaps (FVG). It helps traders visualize where "Smart Money" is likely to hunt for stops and where market imbalances exist.
Key Features:
Dynamic Liquidity Levels: Automatically identifies Swing Highs and Lows where retail Stop Losses are clustered.
Liquidity Purge Detection: Lines will visually fade once price "sweeps" or grabs the liquidity, signaling a potential reversal.
Fair Value Gaps (FVG): Highlights price imbalances (gaps) created by aggressive institutional displacement. These areas often act as magnets for price retracements.
How to Use:
The Sweep: Wait for the price to cross a dashed liquidity line (BSL or SSL). This indicates a "Stop Hunt" is occurring.
The Shift: Look for a rapid price reversal immediately after the sweep that leaves a Fair Value Gap (colored boxes) in its wake.
The Entry: Consider entering a trade when price retraces back into the FVG box, using the liquidity sweep high/low as your protected Stop Loss.
Settings:
Liquidity Lookback: Adjust the sensitivity of swing points. Higher values identify more significant, longer-term liquidity pools.
FVG Minimum Size: Filters out small, insignificant gaps to keep your chart clean and focused on high-probability setups.

ICT First FVG Per Session - Big Boss TradersICT First FVG Per Session like per session FVG Asia FVG london First P FVG and New york first P FVG

Daily/Weekly FVG by KrisThis indicator is a Multi-Timeframe (MTF) tool designed to automatically identify and project Fair Value Gaps (Imbalances) from Daily and Weekly timeframes onto your current chart. It helps traders locate higher-timeframe Areas of Interest (POI) and liquidity voids without manually switching charts.
How it works:
The script utilizes `request.security` to fetch High and Low data from Daily and Weekly timeframes. It identifies a Fair Value Gap (FVG) based on the 3-candle formation logic where price moves inefficiently, leaving a gap between the wicks.
- Bullish FVG: Identified when the current Daily/Weekly Low is greater than the High of the candle from 2 periods ago.
- Bearish FVG: Identified when the current Daily/Weekly High is lower than the Low of the candle from 2 periods ago.
The indicator draws a box extending to the right to visualize the zone, along with a dotted midline which often acts as a sensitive support/resistance level.
Unique Feature: Smart Mitigation (Auto-Hide)
To keep your chart clean and focused on relevant data, the script includes a "Full Fill" logic. It continuously monitors price action relative to existing FVG boxes.
- If price completely crosses through a box (fully fills the gap), the indicator considers it "mitigated" and automatically hides the box and its midline (sets transparency to 100%).
- This ensures you only see "fresh" or unfilled gaps that are still relevant for trading.
Settings:
- TF Checkboxes (Daily/Weekly FVG): Toggle the visibility of Daily or Weekly gaps independently based on your analysis needs.
- Design Mode:
Colored: Uses classic Green (Bullish) and Red (Bearish) colors for easy trend identification.
Monochrome: Uses Gray tones for a minimalist look that reduces visual noise on the chart.
Usage:
Use these zones to identify potential reversal points or liquidity targets. Since these are higher-timeframe levels, they often carry more weight than intraday imbalances.

Effort HeatmapThe Effort Heatmap visualizes where meaningful, same-direction volume occurred inside an imbalance during strong directional movement.
Instead of analyzing total bar volume or traditional volume-at-price distributions, this tool reconstructs a simplified internal volume profile using lower-timeframe data.
When a Fair Value Gap forms during a high-volume displacement, the script highlights the portions of the imbalance candle where directional effort was concentrated and projects those regions forward as a heatmap.
The purpose of this indicator is not to predict price or represent institutional activity, but to offer a visual way to study how the market delivered volume inside a move that created an imbalance.
How It Works
1. Lower-Timeframe Volume Extraction
The indicator retrieves open, close, and volume data from a selected lower timeframe.
Only sub-candles that move in the same direction as the previous bar are considered, ensuring the heatmap reflects directional effort—not mixed volume.
2. Candle Body Binning
The FVG candle is divided into multiple horizontal bins.
Each lower-timeframe sub-candle contributes volume proportionally to the bins it overlaps, creating a vertical volume distribution for that bar.
3. Imbalance (FVG) Detection
A simple 3-bar displacement logic detects bullish or bearish imbalances.
An optional Z-Score filter ensures the heatmap only forms when volume is relatively elevated compared to recent history.
4. Heatmap Projection
When a qualifying imbalance occurs:
• The FVG bar’s volume distribution is normalized
• Only areas with relatively elevated volume are displayed
• Colored heatmap boxes are created and extend forward
• These boxes remain until price trades into or through them
This allows traders to observe how price interacts with past zones of concentrated directional effort.
What Makes It Different
Most volume tools focus on fixed session profiles, market-wide volume-at-price calculations, or bar-level volume totals.
The Effort Heatmap instead reconstructs a per-bar vertical volume distribution using lower-timeframe price action and displays it only when displacement occurs.
Rather than treating the candle as a single block of volume, the indicator highlights where inside the candle body volume was delivered while moving in the displacement direction.
This creates a unique visualization of directional effort that conventional profiles, OB/FVG indicators, and classic oscillators do not show.
How to Use It
1. Apply to any timeframe: The indicator works on all chart timeframes, but gains more detail when higher timeframes are used in combination with lower-timeframe volume data.
2. Identify displacement moments: When a bullish or bearish FVG forms with a high volume Z-Score, the heatmap will appear.
3. Observe the heatmap structure:
Each horizontal band represents the relative concentration of same-direction volume inside the previous candle.
4. Watch how price interacts with these zones:
Heatmap areas extend until price touches or trades through them, at which point they stop extending and are finalized.
5. Combine with your own analysis:
These areas can be used to study...
...how past directional volume clusters influence current movement
...structural reactions to zones of prior effort
...which parts of a displacement candle were most active
The indicator is a visual study tool, not a signal generator.
Settings
• Volume Source Timeframe
Chooses the lower timeframe used to reconstruct internal volume. Smaller timeframes give more detail; larger timeframes give smoother profiles.
• Z-Score Lookback
Controls how many bars are used to measure relative volume. Larger values make the volume filter stricter.
• Z-Score Threshold
Minimum relative-volume strength required to draw a heatmap. Higher values show only high-effort moves.
• Volume Filter (%)
Removes weaker bins based on how much volume they contain compared to the strongest one. Higher percentages = fewer but more meaningful zones.
• Bullish / Bearish Colors
Sets the base color for heatmap boxes depending on direction.

Bull/Bear FVG Density RatioThis indicator tracks the directional frequency of Fair Value Gaps (FVGs) over a configurable lookback window, offering a clean, responsive measure of market imbalance.
🔍 What It Does:
Detects bullish and bearish FVGs using a 3-bar displacement logic
Calculates the ratio of FVGs to candles over the last N bars
Plots separate density curves for bullish and bearish FVGs
Includes a threshold line to help identify regime shifts (e.g., drought vs spate)
📈 How to Use:
Use rising density to confirm trend strength or breakout momentum
Watch for crossovers above the threshold to signal active imbalance regimes
Combine with price action or volume overlays for high-confluence setups
⚙️ Inputs:
Lookback Window: Number of candles used to calculate FVG density
Threshold: Visual guide for regime classification (default: 0.2)
This tool is ideal for traders who want to move beyond symptomatic signals and model structural causality. It pairs well with lifecycle scoring, retest velocity, and HTF overlays.
