Realtime 5D Profile [LucF]█ OVERVIEW
This indicator displays a realtime profile that can be configured to visualize five dimensions: volume, price, time, activity and age. For each price level in a bar or timeframe, you can display total or delta volume or ticks. The tick count measures activity on a level. The thickness of each level's line indicates its age, which helps you identify the most recent levels.
█ WARNING
The indicator only works in real time. Contrary to TradingView's line of volume profile indicators , it does not show anything on historical bars or closed markets, and it cannot display volume information if none exists for the data feed the chart is using. A realtime indicator such as this one only displays information accumulated while it is running on a chart. The information it calculates cannot be saved on charts, nor can it be recalculated from historical bars. If you refresh the chart, or the script must re-execute for some reason, as when you change inputs, the accumulated information will be lost.
Because "Realtime 5D Profile" requires time to accumulate information on the chart, it will be most useful to traders working on small timeframes who trade only one instrument and do not frequently change their chart's symbol or timeframe. Traders working on higher timeframes or constantly changing charts will be better served by TradingView's volume profiles. Before using this indicator, please see the "Limitations" section further down for other important information.
█ HOW TO USE IT
Load the indicator on an active chart (see here if you don't know how).
The default configuration displays:
• A double-sided volume profile showing at what price levels activity has occurred.
• The left side shows "down" volume, the right side shows "up" volume.
• The value corresponding to each level is displayed.
• The width of lines reflects their relative value.
• The thickness of lines reflects their age. Four thicknesses are used, with the thicker lines being the most recent.
• The total value of down/up values for the profile appears at the top.
To understand how to use profiles in your trading, please research the subject. Searches on "volume profile" or "market profile" will yield many useful results. I provide you with tools — I do not teach trading. To understand more about this indicator, read on. If you choose not to do so, please don't ask me to answer questions that are already answered here, nor to make videos; I don't.
█ CONCEPTS
Delta calculations
Volume is slotted in up or down slots depending on whether the price of each new chart update is higher or lower than the previous update's price. When price does not move between chart updates, the last known direction is used. In a perfect world, Pine scripts would have access to bid and ask levels, as this would allow us to know for sure if market orders are being filled on upticks (at the ask) or downticks (at the bid). Comparing the price of successive chart updates provides the most precise way to calculate volume delta on TradingView, but it is still a compromise. Order books are in constant movement; in some cases, order cancellations can cause sudden movements of both the bid and ask levels such that the next chart update can occur on an uptick at a lower price than the previous one (or vice versa). While this update's volume should be slotted in the up slot because a buy market order was filled, it will erroneously be slotted in the down slot because the price of the chart's update is lower than that of the previous one. Luckily, these conditions are relatively rare, so they should not adversely affect calculations.
Levels
A profile is a tool that displays information organized by price levels. You can select the maximum quantity of levels this indicator displays by using the script's "Levels" input. If the profile's height is small enough for level increments to be less than the symbol's tick size, a smaller quantity of levels is used until the profile's height grows sufficiently to allow your specified quantity of levels to be displayed. The exact position of levels is not tethered to the symbol's tick increments. Activity for one level is that which happens on either side of the level, halfway between its higher or lower levels. The lowest/highest levels in the profile thus appear higher/lower than the profile's low/high limits, which are determined by the lowest/highest points reached by price during the profile's life.
Level Values and Length
The profile's vertical structure is dynamic. As the profile's height changes with the price range, it is rebalanced and the price points of its levels may be recalculated. When this happens, past updates will be redistributed among the new profile's levels, and the level values may thus change. The new levels where updates are slotted will of course always be near past ones, but keep this fluidity in mind when watching level values evolve.
The profile's horizontal structure is also dynamic. The maximum length of level lines is controlled by the "Maximum line length" input value. This maximum length is always used for the largest level value in the profile, and the length of other levels is determined by their value relative to that maximum.
Updates vs Ticks
Strictly speaking, a tick is the record of a transaction between two parties. On TradingView, these are detected on seconds charts. On other charts, ticks are aggregated to form a chart update . I use the broader "update" term when it names both events. Note that, confusingly, tick is also used to name an instrument's minimal price increment.
Volume Quality
If you use volume, it's important to understand its nature and quality, as it varies with sectors and instruments. My Volume X-ray indicator is one way you can appraise the quality of an instrument's intraday volume.
█ FEATURES
Double-Sided Profiles
When you choose one of the first two configuration selections in the "Configuration" field's dropdown menu, you are asking the indicator to display a double-sided profile, i.e., where the down values appear on the left and the up ones on the right. In this mode, the formatting options in the top section of inputs apply to both sides of the profile.
Single-Sided Profiles
The six other selections down the "Configuration" field's dropdown menu select single-sided profiles, where one side aggregates the up/down values for either volume or ticks. In this mode, the formatting options in the top section of inputs apply to the left profile. The ones in the following "Right format" section apply to the right profile.
Calculation Mode
The "Calculation" input field allows the selection of one of two modes which applies to single-sided profiles only. Values can represent the simple total of volume or ticks at each level, or their delta. The mode has no effect when a double-sided profile is used because then, the total is represented by the sum of the left and right sides. Note that when totals are selected, all levels appear in the up color.
Age
The age of each level is always displayed as one of four line thicknesses. Thicker lines are used for the youngest levels. The age of levels is determined by averaging the times of the updates composing that level. When viewing double-sided profiles, the age of each side is calculated independently, which entails you can have a down level on the left side of the profile appear thinner than its corresponding up side level line on the right side because the updates composing the up side are more recent. When calculating the age of single-sided profiles, the age of the up/down values aggregated to calculate the side are averaged. Since they may be different, the averaged level ages will not be as responsive as when using a double-sided profile configuration, where the age of levels on each side is calculated independently and follows price action more closely. Moreover, when displaying two single-sided profiles (volume on one side and ticks on the other), the age of both sides will match because they are calculated from the same realtime updates.
Profile Resets
The profile can reset on timeframes or trend changes. The usual timeframe selections are available, including the chart's, in which case the profile will reset on each new chart bar. One of two trend detection logics can be used: Supertrend or the one used by LazyBear in his Weis Wave indicator . Settings for the trend logics are in the bottommost section of the inputs, where you can also control the display of trend changes and states. Note that the "Timeframe" field's setting also applies to the trend detection mechanism. Whatever the timeframe used for trend detection, its logic will not repaint.
Format
Formatting a profile for charts is often a challenge for traders, and this one is no exception. Varying zoom factors on your chart and the frequency of profile resets will require different profile formats. You can achieve a reasonable variety of effects by playing with the following input fields:
• "Resets on" controls how frequently new profiles are drawn. Spacing out profiles between bars can help make them more usable.
• "Levels" determines the maximum quantity of levels displayed.
• "Offset" allows you to shift the profile horizontally.
• "Profile size" affects the global size of the profile.
• Another "Size" field provides control over the size of the totals displayed above the profile.
• "Maximum line length" controls how far away from the center of the bar the lines will stretch left and right.
Colors
The color and brightness of levels and totals always allows you to determine the winning side between up and down values. On double-sided profiles, each side is always of one color, since the left side is down values and the right side, up values. However, the losing side is colored with half its brightness, so the emphasis is put on the winning side. When there is no winner, the toned-down version of each color is used for both sides. Single-sided profiles use the up and down colors in full brightness on the same side. Which one is used reflects the winning side.
Candles
The indicator can color candle bodies and borders independently. If you choose to do so, you may want to disable the chart's bars by using the eye icon near the symbol's name.
Tooltips
A tooltip showing the value of each level is available. If they do not appear when hovering over levels, select the indicator by clicking on its chart name. This should get the tooltips working.
Data Window
As usual, I provide key values in the Data Window, so you can track them. If you compare total realtime volumes for the profile and the built-in "Volume" indicator, you may see variations at some points. They are due to the different mechanisms running each program. In my experience, the values from the built-in don't always update as often as those of the profile, but they eventually catch up.
█ LIMITATIONS
• The levels do not appear exactly at the position they are calculated. They are positioned slightly lower than their actual price levels.
• Drawing a 20-level double-sided profile with totals requires 42 labels. The script will only display the last 500 labels,
so the number of levels you choose affects how many past profiles will remain visible.
• The script is quite taxing, which will sometimes make the chart's tab less responsive.
• When you first load the indicator on a chart, it will begin calculating from that moment; it will not take into account prior chart activity.
• If you let the script run long enough when using profile reset criteria that make profiles last for a long time, the script will eventually run out of memory,
as it will be tracking unmanageable amounts of chart updates. I don't know the exact quantity of updates that will cause this,
but the script can handle upwards of 60K updates per profile, which should last 1D except on the most active markets. You can follow the number of updates in the Data Window.
• The indicator's nature makes it more useful at very small timeframes, typically in the sub 15min realm.
• The Weis Wave trend detection used here has nothing to do with how David Weis detects trend changes.
LazyBear's version was a port of a port, so we are a few generations removed from the Weis technique, which uses reversals by a price unit.
I believe the version used here is useful nonetheless because it complements Supertrend rather well.
█ NOTES
The aggregated view that volume and tick profiles calculate for traders is a good example of one of the most useful things software can do for traders: look at things from a methodical, mathematical perspective, and present results in a meaningful way. Profiles are powerful because, if the volume data they use is of good enough quality, they tell us what levels are important for traders, regardless of the nature or rationality of the methods traders have used to determine those levels. Profiles don't care whether traders use the news, fundamentals, Fib numbers, pivots, or the phases of the moon to find "their" levels. They don't attempt to forecast or explain markets. They show us real stuff containing zero uncertainty, i.e., what HAS happened. I like this.
The indicator's "VPAA" chart name represents four of the five dimensions the indicator displays: volume, price, activity and age. The time dimension is implied by the fact it's a profile — and I couldn't find a proper place for a "T" in there )
I have not included alerts in the script. I may do so in the future.
For the moment, I have no plans to write a profile indicator that works on historical bars. TradingView's volume profiles already do that, and they run much faster than Pine versions could, so I don't see the point in spending efforts on a poor ersatz.
For Pine Coders
• The script uses labels that draw varying quantities of characters to break the limitation constraining other Pine plots/lines to bar boundaries.
• The code's structure was optimized for performance. When it was feasible, global arrays, "input" and other variables were used from functions,
sacrificing function readability and portability for speed. Code was also repeated in some places, to avoid the overhead of frequent function calls in high-traffic areas.
• I wrote my script using the revised recommendations in the Style Guide from the Pine v5 User Manual.
█ THANKS
• To Duyck for his function that sorts an array while keeping it in synch with another array.
The `sortTwoArrays()` function in my script is derived from the Pine Wizard 's code.
• To the one and only Maestro, RicardoSantos , the creative volcano who worked hard to write a function to produce fixed-width, figure space-padded numeric values.
A change in design made the function unnecessary in this script, but I am grateful to you nonetheless.
• To midtownskr8guy , another Pine Wizard who is also a wizard with colors. I use the colors from his Pine Color Magic and Chart Theme Simulator constantly.
• Finally, thanks to users of my earlier "Delta Volume" scripts. Comments and discussions with them encouraged me to persist in figuring out how to achieve what this indicator does.
"fib" için komut dosyalarını ara

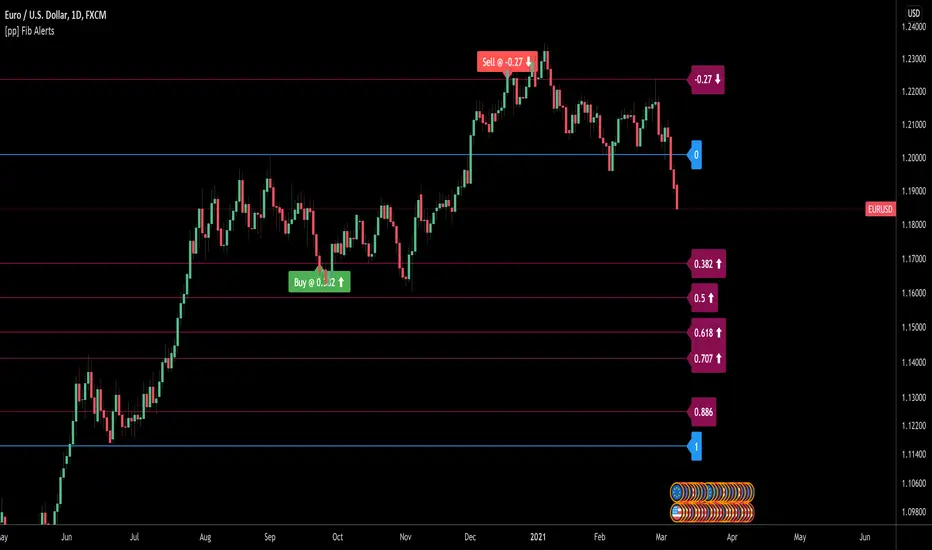
[pp] Fib AlertsUsing the new input.price() function we can now automate our fibonacci tools a little better.
This tool is designed with the intention of trading off of a fibonacci level using alerts.
How to use:
1.Add the indicator to your chart.
2. Place the bottom price where you would normally start your fibonnaci drawing
3. Place the top price where you would normally end your fibonacci drawing
4. Set your alert syntax "buy alert message" and "sell alert message" Should be replaced with webhook configurations or something better.
5. Fibonacci values > 1 (ie. 0.382, 0.5, 0.618) are recognized as retracements and work well as buying opportunities. When the price crosses one of these levels the "buy alert message" alert will be immediately triggered ONCE per BAR (I may update this in the future so it can only trigger ONCE ever to avoid multiple orders)
6. Fibonacci values < 1 (ie . -0.113, -0.27) are recognized as extensions levels and work well as selling opportunities. When the price crosses one of these levels the "Sell alert message" alert will be triggered.
If anyone knows how to convert the fibonacci values to logarithmic values I would greatly appreciate insight.
Opening Range FibonaccisThis indicator uses the concept of the "Opening Range" to create a Fibonacci zone from the high and low set during a specific time period after open (Defaults to 9:30 - 10:05 AM, EST)
The Opening Range is a popular tool for intraday technical analysis. Price frequently uses these levels as support/resistance, and a breakout from within the range can be a sign of further movement.
The Fibonacci levels are set such that the opening range high/low fall on the +/-0.5 fib. This creates an "extended range" outside of the opening range that may be useful during breakouts.

Ultimate Bullish Divergence for RSI OBV RVSI MFI w/ Buy AlertsThis Indicator detects Divergence based on multiple Pivot points instead of just one.
- You can detect divergence on these Oscillators:
- RSI, RVSI, MFI, TRIX RSI, OBV and more soon
You can detect bullish and hidden bullish divergence:
- bullish divergence: Oscillator makes a higher low while price is making a lower low
- hidden bullish divergence: Oscillator makes a lower low while price is making a higher low
ranges where it should look for Divergence:
- To reduce false positives you are able to define and combine the following ranges:
- Manual Ranges: you’re able to type in the ranges that you came up with your manual technical analysis
- Auto Fib Ranges: option to only look for divergence below/above/within multiple Fibonacci levels
- Oversold limit: option to only look for divergence below a certain Oscillator Level
- EMA Ranges: Only look for divergence if below/above/within certain EMA's
- VWAP Ranges: option to only look for divergence below/above/within VWAP levels
Multiple options of waiting for confirmation:
- Waiting for X candle closes
- Wait for a price bounce
- Wait for an Oscillator to Oscillator EMA cross
- Wait for EMA cross (coming soon)
Volume Price Trend with Divergence and Pivot Points The volume price trend indicator is used to determine the balance between a security’s demand and supply. The percentage change in the share price trend shows the relative supply or demand of a particular security, while volume indicates the force behind the trend. The VPT indicator is similar to the on-balance volume (OBV) indicator in that it measures cumulative volume and provides traders with information about a security’s money flow.
This is Volume Price Trend or VPT recalculated to be an Oscillator, a Divergence hunter was added, also Pivot Points and Alerts.
VPT is considered a "leading indicator" - in contrast to a "lagging indicator" just as Moving Averages it does not show a confirmation what already happened, but it shows what can happen in the future. For example: The chart is climbing while the VPT oscillator is slowly declining, gets weaker and weaker, maybe even prints bearish divergences? That means that a reversal might be occurring soon. Leading indicators are best paired with Stop and Resistance Lines, general Trendlines , Fib Retracements etc...Your chart is approaching a very important Resistance Trendline but the VPT shows a very positive signal? That means there is a high probability that the Resistance is going to be pushed though and becomes Support in the future.
What are those circles?
-These are Divergences. Red for Regular-Bearish. Orange for Hidden-Bearish. Green for Regular-Bullish. Aqua for Hidden-Bullish.
What are those triangles?
- These are Pivots . They show when the VPT oscillator might reverse, this is important to know because many times the price action follows this move.
Please keep in mind that this indicator is a tool and not a strategy, do not blindly trade signals, do your own research first! Use this indicator in conjunction with other indicators to get multiple confirmations.

ORB with Shorty Targets
The ORBS indicator study utilizes the theory of an Opening Range Breakout occurring on a security. The indicator uses data collected from the first thirty minute session of the trading day to create fibonacci retracements at specific positions. The 'session' high and low are derived from the first thirty minutes and used as a basis to plot these values. Fibonacci retracement lines are plotted at key positions above and below the high/low values pulled during the opening 'session'. These fibonacci retracement lines are plotted at: 0 (ORB high); 1.272; 1.618; 2.00; 2.175; 2.618; and 3.236. Levels in-between these values are known as 'ranges'. Upper lines are shown green in color and indicate key levels at which the price may react within the market. No guarantees are given nor implied - ORBs is simply a tool to help plot out key fibonacci levels at specific levels accurately and completely.
This will only work on 3min or 5mins and it is intended for intraday trading only.
ORH - opening range high
ORL - opening range low
OR50% - mid between ORH and ORL aka 50% fib
The way i use ORBS:
1. ORH break - i go long on 3min or 5 min close above ORH. I use heiken-ashi candles.
2. ORL breal - i will short on 3min or 5 min close below ORL
3. Double bottoms on reclaims of ORL - i will go long with SL being the ORL
4. Double tops on ORH considering market is weak i will short with SL being the ORH
Trendbar:
Trendbar use combo of CCI and ATR to help figure out the trend the stock is in. Stock moving below the trendbar indicates it is loosing the trend dependent on what time-frame you are using it.
Pivots:
Shorty Pivots are a collection of daily/weekly/ monthly pivots indicator that allows for plotting a daily, weekly, and monthly line on a chart. The values are pulled from the three separate resolutions (daily, weekly, and monthly), and shown on the chart each day. Calculations pulled from each respective high/low/close (divided by 3.0) for the session values.
Settings:
Show Daily/Weekly/Monthly Pivot - Shows/Hides each respective pivot .
Pivot Colors - Change the color of each pivot .
Pivot Width - Line width of the plotted pivot .
Line Style - Choose Solid, Dashed, or Dotted to view different styled lines.
Label Text Color - Choose the label text color if it clashes with your chosen line color(s).
Extend Pivot Lines to Right Offset: This allws you to extend each pivot line to the right by an offset of X bars.
Day Session Timeframe - Ignore this setting.
Pivot Adjustment Timeframe - Ignore this setting.

Divergence HunterThis script searches multiple divergences based on the wave trend indicator
You could combine support and resistance to identify with the bearish divergence a Potential Top.
Bullish divergence on the other hand could indicate that the market found its bottom and you should keep your eye open for an long entry.
If you are already short and took some profit the hidden bearish divergence could indicate a continuation of the downtrend. Could also be used together with Fib-Retracement to find a reentry or an add for your current entry.
Hidden bull divs could be used to find a reentry in the current up trending move or of course could be used as and add for your current position.
If you want to try it or have questions leave me a message.
DISCLAIMER: No sharing, copying, reselling, modifying, or any other forms of use are authorized for the documents, script / strategy, and the information published with them. This informational planning script / strategy is strictly for individual use and educational purposes only. This is not financial or investment advice. Investments are always made at your own risk and are based on your personal judgement. I am not responsible for any losses you may incur. Please invest wisely.
Divergence, RSI+Bollinger Band breachHi everyone, I have developed a divergence system using RSI and Bollinger Bands. It contains a series of filters which are fine tuned to generate razer sharp entries. It works by first identifying divergence between peak 1 and peak 2. Peak 1 must have enough momentum and strength to Breach the Bollinger bands. Once these criteria are met, a white candle will signal an entry to go long or short. The take profits for this trading system are most accurate when set at about 50-70% retracement of the bottom/top of the valley, to the trade entry. Stop loss's can be set 1:1 or up to the discretion of the trader if they so choose to grid/martingale their way out of a loosing trade. Signals are best taken on the 30M timeframes, and using upper time frames to determine market structure ( support, resistance, fibs, ) or what ever you may use to provide confidence of a reversal.
On-Balance Volume Oscillator with Divergence and PivotsThis is On-Balance Volume recalculated to be an Oscillator, a Divergence hunter was added, also Pivot Points and Alerts.
On-Balance Volume, or OBV is considered a "leading indicator" - in contrast to a "lagging indicator" just as Moving Averages it does not show a confirmation what already happened, but it shows what can happen in the future. For example: The chart is climbing while the OBV oscillator is slowly declining, gets weaker and weaker, maybe even prints bearish divergences? That means that a reversal might be occurring soon. Leading indicators are best paired with Stop and Resistance Lines, general Trendlines, Fib Retracements etc...Your chart is approaching a very important Resistance Trendline but the OBV shows a very positive signal? That means there is a high probability that the Resistance is going to be pushed though and becomes Support in the future.
What are those circles?
-These are Divergences. Red for Regular-Bearish. Orange for Hidden-Bearish. Green for Regular-Bullish. Aqua for Hidden-Bullish.
What are those triangles?
- These are Pivots. They show when the OBV oscillator might reverse, this is important to know because many times the price action follows this move.
Please keep in mind that this indicator is a tool and not a strategy, do not blindly trade signals, do your own research first! Use this indicator in conjunction with other indicators to get multiple confirmations.

C Squared HelperThe C² Helper Signal is meant to supplement my personal c² Bot. However, due to increasing interest in the signal, i am making this public.
This script measures various indicators such as EMA, Fisher, Fib, STO, OBV, RSI, MACZ, SMI, DIOSC, Chalkin, Aroon, SAR to create a unified alert that considers all of these at once.
Whats even more exciting is that this is operating on 3 different timeframes (so its important to view the results on a timeframe lower than the lowest set one).
You have options to change the lengths being measured. However, this is not advised. I have spend some time tweaking and playing with this to find out the best results.

Multi ZigZag EW - Impulse V2Another version of Elliot Wave 3 projection. This time with more features.
I have based the calculations based on Wave 1,2 and 3 relation mentioned in www.esignal.com
Ratios for Wave 2
Wave 2 = either 50% of Wave 1 or 62% of Wave 1
Wave 3 is related to Wave 1 by one of the following:
Wave 3 = either 1.62 x length of Wave 1 or 2.62 x length of Wave 1 or 4.25 x length of Wave 1
Logic and calculations are similar to that of previous version:
But, effort has been made to add some additional infomation and tools into this script.
Similar to the previous script, upto 4 zigzag lengths can be selected from input. Users can also set, color, line style and width for each Zigzag lines. Error threshold defines how much vairation from fib ratios are allowed before recognizing patterns. EntryPercent is minimal bounce off required from Wave 2 to get into the trade. This will also determine initial Stoploss.
Now lets have look at fun features.
In Trade Stats Table
By default, you can find this in bottom right corner of the screen. This table shows details of trades which are running at the moment based on different patterns formed. Trade will be running till it hits target 4 or trailing stop loss. Multiple zigzags can generate multiple trades at a time, stats containing Wave Points 0 to 3 and other information will be printed in the table.
Closed Trades Stats Table
This is by default found in bottom left corner of the screen. This table consists of stats related to all the closed trades. It shows how many trades are generated, how many failed to hit Entry point, how many hit Entry and then reversed to hit stoploss. How many entered trades hit different stop levels etc.
Unique Coordinates: Sometimes different zigzags produce same waves - Point (1) (2) abd (3). Enabling unique coordinates will filter these and generate only one trade altogether.
AtrLength and AtrMult are used for calculation of trailing stop loss. Trailing stop loss activation can be controlled by the parameter TrailingStart - which lets you select upon reaching what state the trailing stop needs to be activated. Even if trailing stop is not activated, stops will still trail by two levels. For example, when price hits Target 3, stoploss is automatically moved to Target 1 which is below two levels.
In the chart, the remaining Target levels and Current stop levels are highlighted with bigger font and solid lines whereas the inactive ones will have dotted lines and smaller font. For example, Entry label and line will show up in bigger font till price crosses entry. Once this is done, Entry point is not significant anymore. Hence, they are diminished. Similarly target levels will diminish as and when they are reached.
Last parameter is Direction - this lets you select what direction you want to generate the signals. By default it is set to all. But, users can select only bullish or bearish signals.

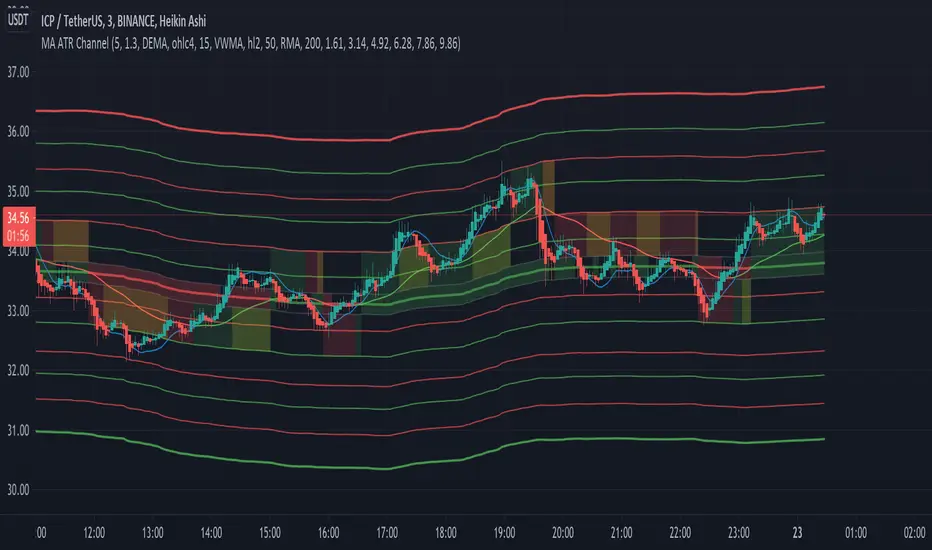
[EG] MA ATR ChannelsGreetings - the aim of this indicator was to code a single indicator with a selectable moving average, so I could examine price relationships to MA's and Average True Range (ATR) bollinger type bands. You can obviously approach this tool in so many different ways so I am going to share first an overview of moving averages and a short overview of how I use this this indicator.
Simple ( SMA ) – A simple average of the past N (length) prices. Just add the price data for each N (bar) and divide the total by N.
Exponential ( EMA ) – An exponential moving average with a greater weight for recent prices. The weighting is exponential. An N-period EMA takes more than N data points into account and gradually dilutes past data’s effect.
Double Exponential ( DEMA ) - Same as an EMA , the Double exponential moving average , or DEMA , is a measure of a security's trending average price that gives the even more weight to recent price data. Aimed to help reduce lag.
Triple Exponential ( TEMA ) - Same as an EMA , the Triple exponential moving average , or TEMA , is a measure of a security's trending average price that gives the even more weight to recent price data than EMA or DEMA . Aimed to help reduce lag.
Weighted ( WMA ) – An average of the past N prices with a linear weighting, again giving greater weight to more recent prices.
Hull ( HMA ) - The Hull Moving Average (developed by Alan Hull) has the purpose of reducing lag, increasing responsiveness while at the same time eliminating noise. It emphasises recent prices over older ones, resulting in a fast-acting yet smooth moving average that can be used to identify the prevailing market trend.
Wilder's (RMA) - Wilder's smoothing is a type of exponential moving average . It takes one parameter, the period n, and price. Larger values for n will have a greater smoothing effect on the input data but will also create more lag. It is equivalent to a 2n-1 Exponential Moving Average . For example, a 10 period Wilder's smoothing is the same as a 19 period exponential moving average .
Symmetrically Weighted ( SWMA ) - Weight distribution starts from median of given period and it's reduced linearly to the sides so the ending and starting point of period have the least weight. It's smooth and fast but reacts late to trend changes on higher lengths (lookback).
Arnaud Legoux ( ALMA ) - Arnaud Legoux Moving Average removes small price fluctuations and enhances trend via applying a moving average twice, once from left to right, and once from right to left and combines both. At the end of this process the phase shift (price lag) commonly associated with moving averages is significantly reduced.
Volume-Weighted ( VWMA ) - A Volume-Weighted Moving Average gives a different weight to each closing price and this weight depends on the volume of that period. For example, the closing price of a day with high volume will have a greater weight on the moving average value.
Volume Weighted Average Price ( VWAP ) - Though not necessarily a MA - Volume-weighted average price ( VWAP ) is a ratio of the cumulative share price to the cumulative volume traded over a given time period and so I thought would be useful as an ATR tool. The VWAP is calculated using the opening price for each day and adjusting in real time right up until the close of the session. Thus, the calculation uses intraday data only.
So what is Average True Range ?
Average True Range is a measure of volatility . It's an area that represents roughly how much you can expect a security to change in price over a time period. Average true range is usually calculated by applying Wilders Smoothing to True Range. If you want regular ATR - use RMA as the input for the ATR. The ATR is then divided into periods based on derivatives of Phi (3.14) and Fibs (0.618, 1.618 etc.) You will notice price bounces off the lines. Look for patterns.
The indicator - consisting of 3 parts:
Price/Fast MA - this is an MA anywhere between 3-20 periods that is reflective of very recent price action. It is red when price is below - and green when above. Recommendations : SMA , EMA , WMA , HMA
Trend/Medium MA - this is a slower MA that you could set anywhere between 30 - 100 periods that is reflective of overall bull/bear market trend depending on both it's direction and whether the Price MA / price is lower or higher. Recommendations: EMA , WMA , VWMA , RMA, ALMA
Average True Range - this is a way to measure and visualise range the price may be capable of in - if it is towards or below the 2.1 multiplier - a bull reversal is more likely and vice versea. The multi's are set to factors of Pi and Fibonacci ratio's. Green channel means bullish, red channel means bearish. Gold means sign of a likely reversal. If the PMA enters the channel - it is likely the reversal is cancelled for a short period more.
Recommendations : RMA, EMA , VWMA , ALMA , SWMA , VWAP
How I use it :
First of all - Consider longs when channel is green - or going to bounce on a support line - and consider shorts based on the opposite. This is not a buy/sell indicator - this is a MAP to PRICE to give reference and meaning to price movements across multiple time frames - very useful when using with a volume indicator and an RSI. I personally use it on the 3m chart but change the TFM to 5 for 15m data.
If you wish to see any other more exotic or interesting MA's added please feel free to request them in the comments ! And thanks for checking out my first indicator
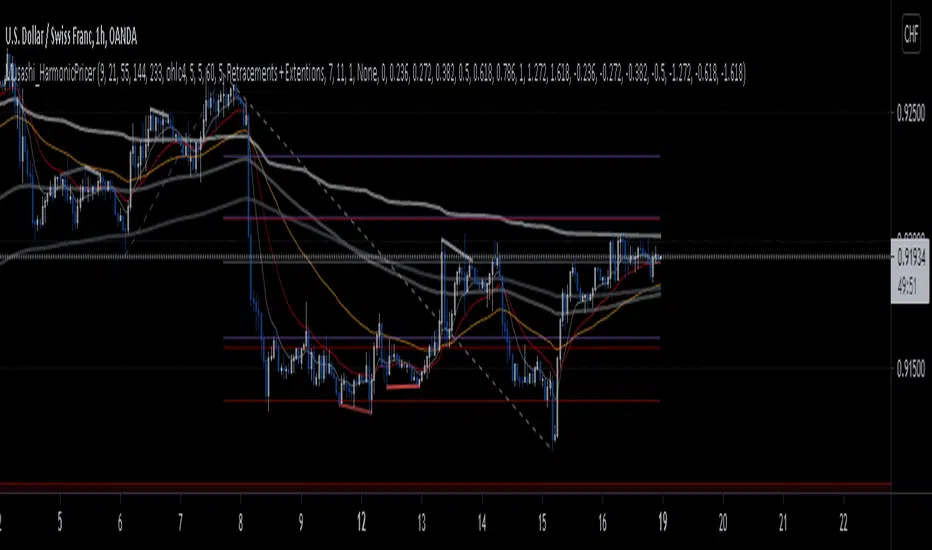
Musashi_HarmonicPricerMusashi HarmonicPricer was designed to my a tool for my personal trading strategy, and help me plot what I call ''Harmonic Structure', which is just a sophisticated way of using Fibonacci ratios based on the Elliott Wave Principle, Harmonic Patterns, and market structure.
- A distinctive element will be the integrated Fibonacci cluster tool, which plots automatically retracements and extensions of .272 (red) and .618 (purple) ratios, using the last two significant swings. For powerful usage, adjust the timeframes until they group into clusters or adjust the setup. You can also adjust the settings and select to plot only retracement, only extensions, both (default), the deviation (default = 7), and the historical approach.
- To be used wisely properly, you require multi-timeframe analysis, reason why you will find Monthly and Yearly VWAPs, as they won't change while you're switching timeframes, and fib-based EMAs to provide trend and dynamic support.
- Finally, the indicator will plot in price Hidden and Regular divergences for any oscillator you have on screen.
Have a good day.
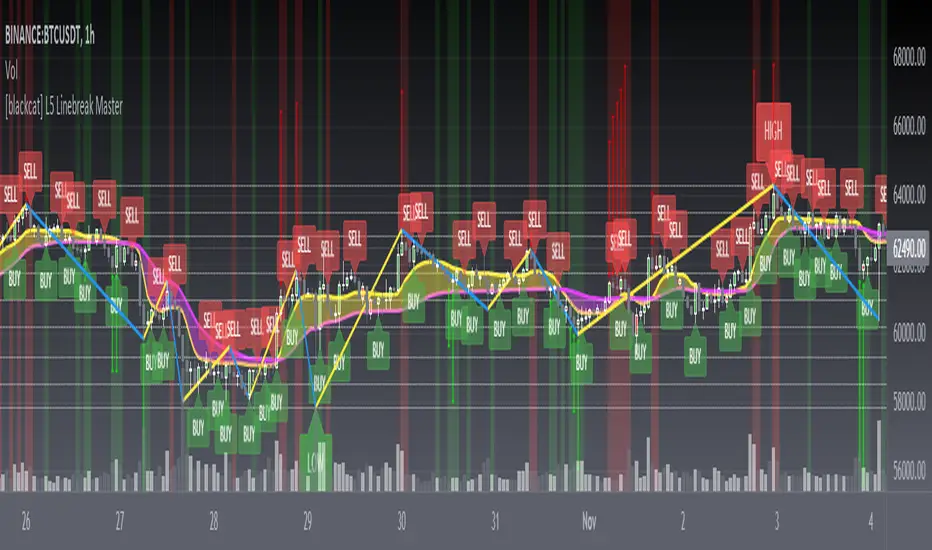
[blackcat] L5 Linebreak MasterLevel: 5
Background
Like many people in the Tradingview community, I have been studying how to apply Line Break Chart to backtesting and live trading for long. However, as we all know, the official Tradingview Line Break Chart is not recommended for backtesting because it will lead to unrealistic backtesting results. So, I thought about developing a Line Break Chart that can be used for backtesting and trading. This "L5 Linebreak Master" is one of them that I am introducing today.
This indicator is based on OHLC data, because this kind of chart can be used for reliable backtesting and live trading in Tradingview. Therefore, the Linebreak Master in this script can actually coexist with the standard Japanese candlestick chart, but the trend reversal information it prompts is based on a principle similar to Line Break Chart. When the two can coexist and produce trading signals at the same time, this is really a very interesting invention.
Function
Linebreak charts were developed in Japan and popularized here by Steve Nisson in his book Beyond Candlesticks. The purpose of linebreak charts is to filter out market noise and give a clear indication of the current trend and trend reversals. As you may know, sometimes determining the current trend can be difficult due to market price movement that consolidates, and a trend reversal can be just as difficult. The green and red bars are called lines. Notice that whenever we have consecutive green lines, each line has a higher close than the previous one; when we have consecutive red lines each line has a lower close than the previous line.
First of all, this Linebreak chart can coexist in the main chart with the Japanese candlestick chart. However, many parts may be overlapped with Japanese candle stick to see it clearly. My recommendation is that users can click "Settings" of main chart and turn off default candle chart.
Secondly, this Linebreak chart can be used for backtesting strategies, because it is essentially OHLC data. And the absolute values of the price is based on the original OHLC data. The certainty of the trend reversal is relatively high. It can be compared with Japanese candlesticks on the timeline.
Finally, this Linebreak chart is embedded with a Linebreak intrinsic trading strategy, which can be used to locate entry points through red and green labels. This strategy supports Tradingview alerts. You can get "LONG" or "SHORT" trading reminders by creating alerts. In order to obtain a clear market structure, Zen Stroke (Autolength ZigZag ), Zen Kiss (Special Moving Averages), Fibnacci Retracement Golden Levels, Unique Fibnacci Time windows and Dynamic Fibonicci support and resistance arrows can be checked to be superimposed and displayed on the main chart to facilitate understanding of the temporal and spatial position of prices in the market.
A trading system based on linebreak charts must must have all entries and exits based on the close or open of a line. The two key values of a linebreak chart are the linebreak number and the underlying time interval. We can construct linebreak charts based on daily, weekly, 5 minute, hourly, any time frame. This allows us to adapt it for day trading or swing trading systems. I developped an inheret linebreak strategy with labels facilitate you to locate trend reversals.
Indicator Set
Linebreak Master Chart (新价图)
Zen Stroke (Auto ZigZag , 自动画缠论笔)
Zen Kiss Moving Averages (缠论均线)
Fibnacci Retracement Golden Levels (半对数-黄金分割线)
Unique Fibnacci Time windows (独创的斐波那契时间窗口)
Dynamic Fibonicci support and resistance arrows (动态斐波那契支撑和阻力箭头)
Inputs
Source Type: Open, High, Low, Close, Hl2, Hlc3, Lx, Vwapc, Vwaplx, Vwaphl2 (Case Sensitive)
Returns source input selection variant, default to "Close" if blank or typo.
Open --> open
High --> High
Low --> Low
Close --> Close
Hl2 --> hl2
Hlc3 --> hlc3
Lx --> Lao Xu 1949 Median Price
Vwapc --> vwap based on close
Vwaplx --> vwap based on Lao Xu 1949 Median Price
Vwaphl2 --> vwap based on hl2
Show Zen Stroke --> True as default
Show Fib Space based on Semi-LOG --> True as default
Zen Fractals Lookback Period --> 377 as default
Key Signal
Bars
Green bars for up trend
Red bars for down trend
Labels
Green labels for buy/long.
Red labels for sell/short.
Zen Stroke ( ZigZag )
Green line section for up stroke
Red line section for down stroke
Moving Averages
Yellow for fast line
Fuchsia for slow line
Pros and Cons
Suitable for discretionary trading and bots via alerts. However, only well selected trading pair and time frame can guarantee bot works.
Intuitive and effective, the output signal is more reliable after multi-indicator resonance
Remarks
My fourth L5 indicator published
Closed-source
Invite-only
How to get it?
500 Tradingview Coins Per Monthly Subscription
5000 Tradingview Coins Per Yearly Subscription
(FireflyTA) COG AverageCOG Average
COG stands for Center of Gravity. This indicator is an average of multiple COGs based on different sets of timeframes. To get the single COGs this average is based on, use the Market Flow COG (Overlay) indicator.
COG Average is primarily a support and resistance indicator. It can also be used to identify trend and trend changes as well imminent breakouts.
----------------------
About "Center of Gravity"
The COG is an entity that is pulling price back to it frequently (this is why it is called Center of Gravity ) as the law of mean reversion dictates. Mean reversion can be loosely broken up into mean reversion on multiple timeframes, and the COGs are included for ULT (ultra low, 15-60m), L (low, 1h-4h), M (medium, 6h-12H) and H (higher, 1D+) timeframes. As this entity is a new development in TA there is still a lack of scientific evidence that it is reliable. However, if you look at the charts, you will notice that price action will respect this entity and circle around it on the appropriate timeframes most of the time.
The COG is similar to a Bollinger Band , it is using volatility as its main component. However, COGs are aggregated entities looking at more timeframes at the same time, so besides the Time X Volatility perspective that is provided by Bollinger Bands , this entity adds a third dimension by looking at multiple timeframes. The COG is the mean of all the BBs that are included in the calculation, which can be a large number. This makes a COG a meta-analytic entity that is more sensitive to market price action.
The COG helps you in identifying how far and for how long price has been overextended to one side beyond the means. In theory, the probabilities increase dramatically to see a mean reversion to the COG. Watching price interacting with the COG should make clear that the correlations are significant, however there might be differences based on the markets used. The COGs have primarily been tested with the BTCUSD market and for crypto in general.
A way to trade based on COGs is to look for weakness (if price is above the COG) or strength (if price is below the COG) in price action while it is approaching S&R.; If signs of accumulation or distribution arise, and the distance to the COG is meaningful (as well as being maintained for a few candles), it can provide additional backing for your long/short scalping and swing trading ideas. I'd recommend to always use the COG in combination with your knowledge on price action.
By using all COGs at the same time for ULTF, LTF , MTF and HTF you can get a feeling for where price is in the context overall market flow.
----------------------
Deviation Bands
The Deviation Bands are fib-based deviations of the COG. When this module is enabled, the deviation bands are plotted around the COG. The deviations can be adjusted manually as well by changing the values in the indicator UI. The main purpose of these bands is to identify the structure of price movements in relation to the COG distance, i.e. analyzing how long price can maintain levels in an area >X or

Support and ResistanceThis indicator shows three types of support and resistance lines: Horizontal, Parallel (using linear regression) and Fibonacci Retracement. Lines can be adjusted or turned on and off in settings. A great tool for setting up entries, exits and locating pivot points.

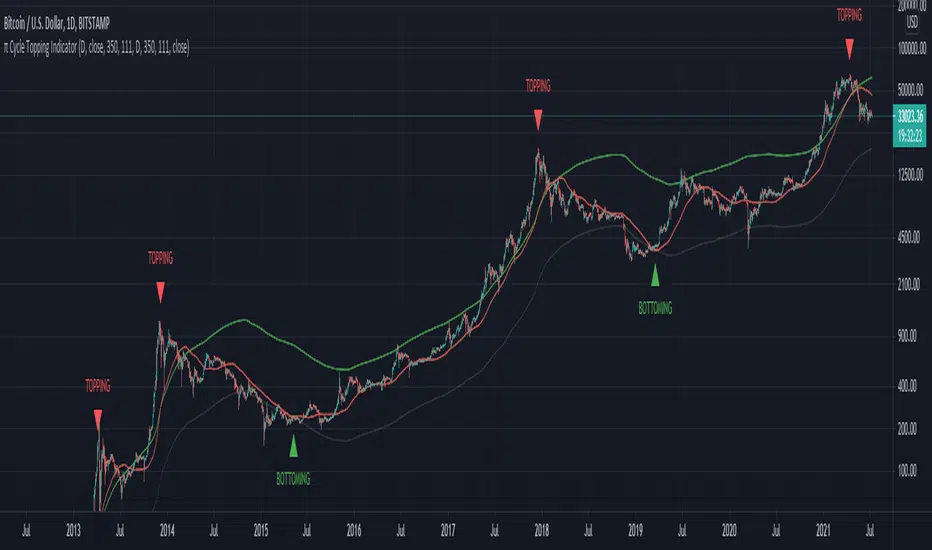
π Cycle Market Tops & Bottoms Performante IndicatorWhy is it called the Pi Cycle Tops & Bottoms Indicator?
When the 111-Day moving average crosses over the (350-Day moving average X 2), we've seen the price come to a key top or bottom within the Bitcoin market for the past 3 cycles.
350 divided by 111 is very close to π - hence the name the Pie cycle!
Yes, we are selecting arbitrary numbers initially, but through the use of proper back-testing, we are able to find key cycle shifts using mathematical numbers (fibs, Pi, etc)
We use this topping & bottoming signal when things look overbought over oversold within the market.
The "topping" label turns on as soon as we see the 111-Day moving average cross above the 350-Day moving average.
The "bottoming" signal turns on as soon as we see the 111-day moving average cross below the 350-Day moving average.
This indicator should only be used on the daily timeframe!
Historically speaking, we've seen this indicator become impressively accurate.
Intraday Trading ZonesThis script can help in intraday trading. It can plot
1. Previous day high, low and close.
2. Intraday Fibonacci levels
3. Big Round Numbers
3. CPR (Central Pivot Range)
4. VWAP

Average EnvelopeA script to calculate a support / resistance level which acts as either a bounce level or a flip level. This is rather a macro play guide than a day trade tool.
The average is calculated by taking into account monthly/weekly/daily highs and average them out.
The script also paints fib levels based on the values of the upper and the lower band.
While this was designed with a cryptocurrency market in mind (no 'close' values per-se) it holds with traditional markets as well.

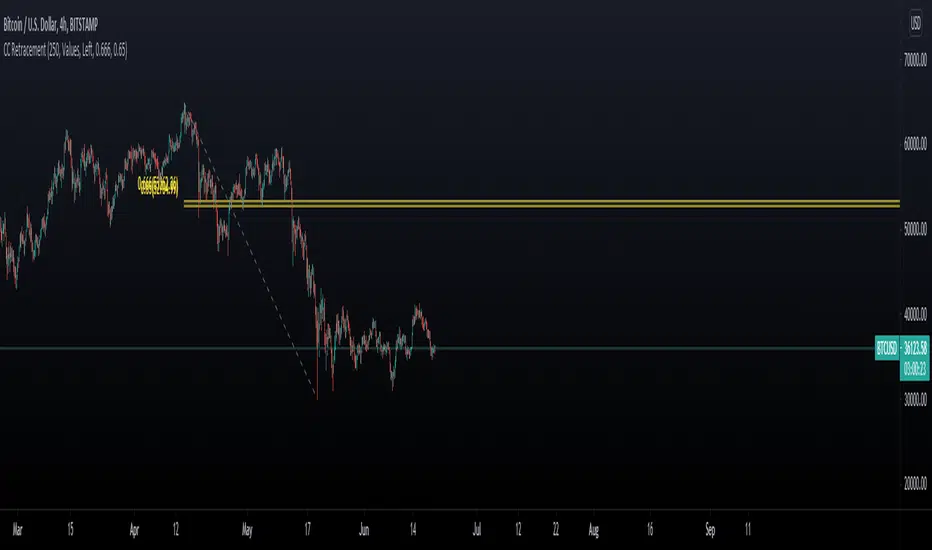
Chart Champions CC Pocket 0.65 -0.666 Fib levels or commonly know as the CC pocket
Marks Strong Support/Ressitance, Use with conflunce.
Lookback Length is adjustable
Let me know any suggestions or ideas which could help improve
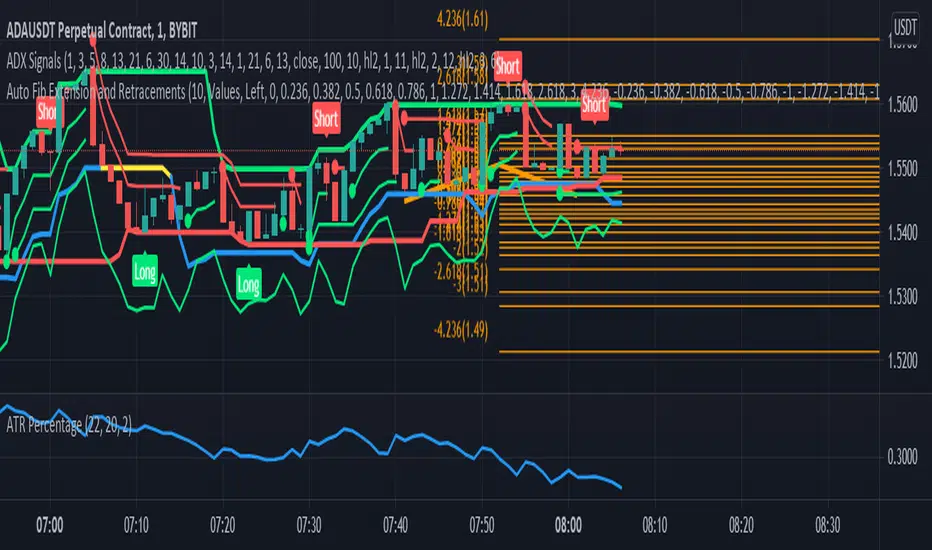
Auto Fib Extension and RetracementsThis script is used for plotting the Fibonacci support and resistance levels. Compared to other ones, the changes to this script are that you can choose what color should all the lines be and that it doesn't change the chart's size, meaning that it won't shrink the chart so that all the levels can be seen. If you have any suggestions, I'm open to anything.
Also, if you could give a like/comment or if you could follow me, that would do my day. Thank you all and enjoy!
V1=PRICE ACTION (INVITE ONLY SCRIPT)
Hello Traders,
Here i bring you my first Price Action Atr based Indictor combined with fib entry and exit trailing levels with minimum risk and maximum profit , as we must have seen at times as we enter the trend reverse and hits our stoploss . Keeping that in mind as i too stuggled and made losses so i decided and focused more on minimizing the stoploss and only on confirmation Long or Short trade is been initiated along with trailing Stoploss as explaned in the images below , why should we give market our money ;) as we are here to make money :D .. There is no holy grail as Stoploss wont be hit but yes it will be way less and all alerts are based on candle close ... Trend Screener is added too which will tell you about the trend .. One can use this on any chart and any timeframe and its very good for scalping too . Vwap and Baseline is added too just incase you want to enter trend manually ... Better results are on 15m and above . Hope you guys will like it and comment if you have any doubts..
-----------------
Disclaimer
Copyright by FaizanNawazz.
The information contained in my scripts/indicators/strategies/ideas does not constitute financial advice or a solicitation to buy or sell any securities of any type. I will not accept liability for any loss or damage, including without limitation any loss of profit, which may arise directly or indirectly from the use of or reliance on such information.
All investments involve risk, and the past performance of a security, industry, sector, market, financial product, trading strategy, or individual’s trading does not guarantee future results or returns. Investors are fully responsible for any investment decisions they make. Such decisions should be based solely on an evaluation of their financial circumstances, investment objectives, risk tolerance, and liquidity needs.
My scripts/indicators are only for educational purposes!
Happy Trading!

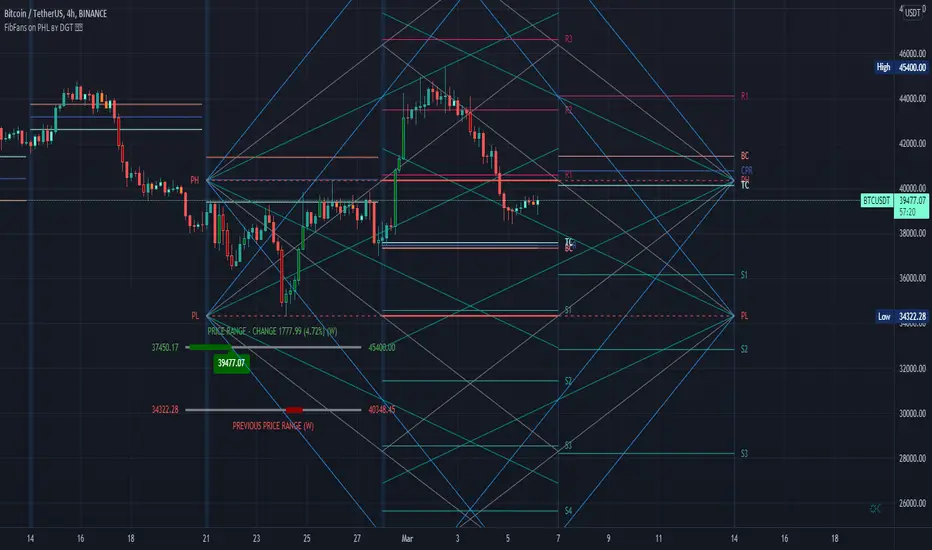
FibFans on Previous HTF HL [FaizanNawaz] by DGTFibonacci Fans application on top of Previous Higher TimeFrame High and Low. Idea owner is @faizannawaz1, special thanks to him for both the idea and tesing the application
WARNING : Study includes plottings in the future, and due to temporal gaps in non 7/24 markets such as weekends, holidays etc plotting of the fans will move to the open session (the effect will be observed on Friday and Monday). With crypto no any side affect will be observed.
More about Fibonacci Fans, how to apply fibonacci fans and automated fibonacci speed and resistance fans study
Adiitonally the study includes some addons, such as
Central Pivot Range and Traditional Pivot Points
Volume Weighted Colored Bars
Price Range Meter - Horizontal HTF Candle
Disclaimer :
Trading success is all about following your trading strategy and the indicators should fit within your trading strategy, and not to be traded upon solely
The script is for informational and educational purposes only. Use of the script does not constitute professional and/or financial advice. You alone have the sole responsibility of evaluating the script output and risks associated with the use of the script. In exchange for using the script, you agree not to hold dgtrd TradingView user liable for any possible claim for damages arising from any decision you make based on use of the script