Order-Flow Market StructureOrder-Flow Market Structure by The_Forex_Steward
A precision tool for visualizing internal shifts, swing structure, BOS events, Fibonacci levels, and multi-timeframe alerts.
What It Does
The Order-Flow Market Structure indicator intelligently tracks and visualizes price structure using higher timeframe candles. It automatically detects:
• Internal bullish and bearish structure shifts
• Swing highs and lows (HH, HL, LH, LL)
• Break of Structure (BoS) confirmations
• Fibonacci retracement levels from recent swing moves
• Real-time alerts across LTF, MTF, and HTF modes
It’s a complete tool for traders who follow Smart Money Concepts, ICT, or institutional price action strategies.
How It Works
• You select a Higher Timeframe (HTF) to set the structural context
• Internal shifts are identified using HTF candle closes
• The indicator scans for swing highs/lows after each internal shift
• Breaks of previous swing points confirm BoS and plot horizontal lines
• Zigzag lines visually connect structural points (swings and BoS)
• Fibonacci levels are drawn between the latest swings
• Alerts can be configured for structure shifts, BoS events, and fib level breaks
How to Use It
Set your preferred HTF (e.g., 1H while trading on 5-minute)
Enable Fibonacci levels to visualize retracement zones
Watch for:
• Bullish internal shifts → HL to HH
• Bearish internal shifts → LH to LL
• BOS → Breakout confirmation
Enable alerts to catch structural events in real-time
Adjust the "Safe History Offset" if working with long lookbacks or volatile assets
Who It's For
• Traders using Smart Money, ICT, or market structure-based systems
• Scalpers, day traders, and swing traders
• Anyone needing precise structural insight across multiple timeframes
Features
• BoS detection with custom line styles and width
• HH, HL, LH, LL label plotting
• Optional Fibonacci retracement zones
• Custom alerts for swing shifts and fib level breaks
• LTF, MTF, and HTF alert modes
Stay aligned with structure, trade with precision, and get alerted to key shifts in real time.
"fib" için komut dosyalarını ara

Pure Price Action Momentum OscillatorComplete Trading Guide: Pure Price Action Momentum Oscillator
1. Script Overview
What It Does
Tracks real-time momentum strength (bullish/bearish acceleration)
Identifies dynamic support/resistance zones for momentum (not price)
Alerts when momentum breaks or holds critical levels
What It Doesn’t Do
Predict long-term trends (use with trend indicators)
Replace price-based S/R levels (use alongside them)
Work well in extreme choppiness (adjust settings or avoid)
2. Key Features & Components
Feature Purpose Visual Cue
Momentum Histogram Shows strength/direction of price acceleration Color-coded bars
Zero Line Bullish/bearish momentum baseline Gray line (0 level)
Support Zone (Blue) Momentum floor where bounces happen Blue horizontal line
Resistance Zone (Orange) Momentum ceiling where pullbacks start Orange horizontal line
Stateful Alerts Persistent signals until conditions reverse Green/Red labels
3. Best Timeframes & Markets
Market Recommended Timeframe Notes
Stocks 5min - 1H Works best with high liquidity
Forex 15min - 4H Avoid during major news spikes
Crypto 1H - 4H Use with volume confirmation
Futures 5min - 1H Ideal for intraday momentum trades
❌ Avoid: Tick charts, <1min (too noisy), >Daily (loses sensitivity).
4. Confirmation Tools (Must-Use Combos)
A. Trend Confirmation
200 EMA (Price Chart)
Only trade longs if price > 200 EMA + momentum supports
Only trade shorts if price < 200 EMA + momentum confirms
ADX (14)
Use when ADX > 25 (strong trend) + momentum aligns
B. Volume Confirmation
Volume Profile
Enter longs only if momentum breaks resistance at high-volume nodes
VWAP
Buy pullbacks when momentum holds support and price is above VWAP
C. Price Structure
Fibonacci Retracements
Look for momentum breaks at 61.8% Fib levels for high-probability trades
Market Structure (Higher Lows/Lower Highs)
Momentum breakouts work best when price confirms trend
5. Trading Signals & Execution Rules
A. Breakout Trades (High Momentum)
Signal Conditions Action
Resistance Broken Histogram > Orange Zone + Price > Key S/R Enter Long
Support Broken Histogram < Blue Zone + Price < Key S/R Enter Short
Stop Loss:
Longs: 1 tick below nearest swing low
Shorts: 1 tick above nearest swing high
Take Profit:
Trail using the opposite zone (exit long when momentum drops below support)
B. Reversal Trades (Momentum Exhaustion)
Signal Conditions Action
Resistance Holding Histogram rejects Orange Zone + Bearish candle Short Entry
Support Holding Histogram bounces off Blue Zone + Bullish candle Long Entry
Stop Loss:
Beyond the recent swing high/low
Take Profit:
At next key S/R level
6. Advanced Interpretation
A. Divergence Trading
Hidden Bullish Divergence:
Price makes higher low, but momentum makes lower low → Potential reversal up
Hidden Bearish Divergence:
Price makes lower high, but momentum makes higher high → Potential reversal down
B. Session-Based Trading
London Open (3 AM EST): Watch for momentum breaks with volume surge
NY Midday (10 AM - 12 PM EST): Best for trend continuation
Crypto (UTC Midnight): Often sees volatility spikes
7. Risk Management & Position Sizing
Risk per trade: 1-2% of account
Leverage: ≤5x for intraday, ≤2x for swing
Avoid trading:
First 15 mins after major news
Low-volume periods (e.g., forex after 5 PM EST)
8. Pro Tips for Consistency
✅ Wait for Close: Don’t trade wicks, wait for candle close beyond zones.
✅ Combine with Price Action: Only trade if momentum aligns with candlestick patterns (e.g., pin bars, engulfing).
✅ Adjust Lookback: Increase in choppy markets, decrease in trends.
9. Limitations & Fixes
Issue Solution
Whipsaws in choppy markets Increase Min Lookback to 30+
Slow reaction in trends Reduce Max Lookback to 50
False breakouts Require volume confirmation
Final Verdict
This script is best used as a momentum filter – not a standalone system. Combine with:
✔ Trend indicators (200 EMA, ADX)
✔ Volume analysis (VWAP, Volume Profile)
✔ Price structure (S/R, Fibs)

Smart Money Gap [Algo Seeker]Introduction – Originality and usefulness
It is important for traders to diversify their strategies, and having a few approaches for different situations is key to increasing their odds of success.
These days, substantial information and important events happen so fast and so often that all the noise created afterward makes people forget the events that were actually worth remembering.
The same can be said about trading and investing. Every day, there seems to be something new happening and new price action unfolding, which can make it difficult for traders to filter out the noise and stay focused on relevant events. But for every problem, a solution can be born.
🟠 Unique Features & Trading Benefits
The SMG aims to be a system that helps traders filter out what it deems to be irrelevant noise and stay focused on what matters most. In addition, SMG provides multiple plans and ways to act on that information.
The reason it’s called “Smart Money Gap” is because this algorithm is designed to identify the most relevant price action—whether it's earnings, an economic calendar event, a stock-specific development, major news, or institutional activity. It determines which of these situations is the most current and relevant, and it keeps the focus on that. This means that day in and day out, traders and investors can rely on a consistent plan and framework that is automatically drawn up for them, helping them trade with confidence that they’re acting on meaningful price levels. When the algorithm identifies a new event as more important, it will switch focus and build a new system around that.
SMG also goes a step further—it understands that different types of traders, such as scalpers, swing traders, or investors, have different time horizons and risk tolerance regarding how long they plan to hold a position and how much space and time they are willing to give a move. With that in mind, SMG provides different trading modes for these personas, selecting events that match the criteria needed for that specific trader.
For instance, a scalper may benefit from a smaller, more recent event that provides quick entry and exit opportunities—whereas an investor might focus on something more significant and long-term. SMG takes this into consideration and builds its entire framework accordingly.
🟠 Description of the Unique SMG (Continued) – How It Works Together as One System
The true power of SMG begins once a relevant event is identified, and the entire system is automatically displayed on the user’s chart. From that single event, SMG generates a structured framework that produces three distinct strategies. Each of these strategies takes inspiration from fundamentals within trading but gives it our own unique twist inside the SMG system. These strategies can be used individually or in combination, depending on the trader’s style and market context.
🟢 1. Filling the Smart Money Gap
One of the key opportunities is to trade the SMG itself—the “gap” created by the specific event. Gap fills are a strategy that traders and investors like to use. SMG continuously tracks how much of this unique gap has been filled, so users are never confused about how much remains. They can reference the shaded region or the percentage-left box for clarity.
🟢 2. Targeting SMG-Based Extensions and Retracements
When the SMG zone is created, the algorithm simultaneously generates extension and retracement levels tied to that event. These levels remain anchored to the original structure, providing consistent, event-driven targets. Unlike the constantly redrawn lines many traders adjust throughout the day, these levels stay fixed and reflect meaningful price action—not noise.
🟢 3. Executing Trades Based on SMG Volume
Because SMGs are tied to meaningful events, they often remain valid for an extended time. This is where Anchored VWAP becomes critical. From the moment the event occurs, SMG begins calculating volume-based data. The longer the event goes unchanged, the more powerful and influential the Anchored VWAP and its deviation bands become—due to the increasing accumulation of volume over time. These volume layers not only help refine entries and exits—they also serve as additional points of confluence where traders can place stops, take profits, or re-enter trades with greater context and confidence.
In conclusion:
SMG is designed to help traders diversify their portfolio of strategies even further. It creates an entire system that filters out noise and builds a strategy around a key event—and it will stay focused on that event until another becomes more relevant. SMG gives traders the ability to react calmly, with a plan that is automatically laid out for them. This is a special algorithm that we’ve incorporated into our approach for over three years, and we hope users will find it to be a valuable aid in their trading journey.
🟠 How to Use
Initial Setup
🟢 1. Select Trading Mode:
Choose from six built-in personas—Scalp 1, Scalp 2, Swing 1, Swing 2, Invest 1, and Invest 2—based on your trading style. Each persona adjusts the SMG logic to fit the risk profile and time horizon of that specific persona.
1. Scalp: For intraday movements (minutes to hours)
• Best used on faster charts (1-minute to 30-minute)
2. Swing: For medium-term positions (days to weeks)
• Best used on 1-hour to daily charts
3. Investor: For longer-term positions (weeks to months)
• Best used on 1-hour to daily charts
🟢 2. Choose SMG Update Behavior: Bar Close vs Live Update:
By default, SMG waits until all conditions are met and the bar closes before updating. This ensures confirmed structure and helps avoid noise or repainting.
If “Update Before Bar Closes?” is selected, the algorithm updates as soon as all conditions are met — even if the bar hasn’t closed yet. This allows earlier updates but may result in elements that repaint if the conditions don’t hold through the close.
Keep this setting unchecked if you prefer confirmed, non-repainting elements.
🟢 3. Visual Customization:
Customize the appearance of SMG zones, extension labels, and volume-derived levels via the “SMG Zone” and “Anchored VWAP” settings groups. This includes:
1. Zone colors and opacity
2. Label positions
3. Retracement display toggle
4. Anchored VWAP and ±1, ±2, ±3 deviation bands
Extra Notes on User Customization:
• Bull Box Color – the color used when SMG retracement is active
• Final Bull Box Color – the color used when SMG retracement is finished
• Same logic applies to Bear Box Color and Final Bear Box Color
• Retracement % Label – If the label is hard to see, it may be overlapping with the Fib labels depending on your chart zoom. To adjust, bring the Retracement % Label Indent closer to 1 to shift it left. Then increase the Fib Label Indent value to move those labels further right.
🟠 Strategic Execution
Strategy Usage Example
🟢 1. Entry & Exit Tactics Within the SMG
Use the shaded Smart Money Gap as a decision-making framework. Traders may choose to:
1. Fade a retracement (shorting or exiting as price retraces into the SMG)
2. Enter on signs of continuation (rejoining the move after a partial retrace)
3. Wait for the gap to fill completely and reverse
Volume-weighted Anchored VWAP levels add an additional layer—helping assess whether price is entering or rejecting volume consensus zones.
🟢 2. Extension Targeting:
When price resumes in the original direction, SMG plots potential extension levels. These can be used to:
1 Set take-profit or stop-loss targets
2. Spot exhaustion areas
3 Evaluate whether to scale in, take partial profits, or re-enter a position
🟢 3. Volume-Based Execution via Anchored VWAP:
For traders looking to incorporate volume into execution—especially when an SMG has remained active for an extended period—Anchored VWAP and its deviation bands can be used to:
1. Confirm direction or momentum via VWAP slope and interaction
2. Enter or fade positions at volume-backed levels
3. Set dynamic entries or exits as volume builds or thins across deviations
⚠️Optional Update Behavior: Bar Close vs Live Update
By default, SMG waits until all conditions are met and the bar closes before updating. This ensures confirmed structure and helps avoid noise or repainting.
If “Update Before Bar Closes?” is selected, the algorithm updates as soon as all conditions are met — even if the bar hasn’t closed yet. This allows earlier updates but may result in elements that repaint if the conditions don’t hold through the close.
Keep this setting unchecked if you prefer confirmed, non-repainting elements.
⚠️ Interpreting Anchored VWAP Behavior
Anchored VWAP and its deviation bands become more relevant with time as they widen and separate. While tight and accumulating near price, it may be worth holding off on using VWAP for entries or exits until expansion begins.
🟠 Additional Description – SMG Table Overview
The SMG table presents four key pieces of information to help traders quickly understand the current setup at a glance:
1) If the Algo is set for dynamic or bar close
2) Which trading mode they currently have selected
3) What type of SMG gap is displayed
4) how much of the Retracement is done
🟠 Additional Benefits:
🟢 1. Risk Profile Options
Trading personas allow users to instantly switch between different risk profiles—Scalp, Swing, or Investor—at the click of a button. This helps traders quickly align the system to their preferred holding period and risk tolerance without reconfiguring inputs.
🟢 2. Time Efficiency
SMG saves traders time by creating a complete system around each Smart Money Gap. From gap logic to retracement tracking, extension targets, and volume levels—everything needed to trade the SMG is generated at once, eliminating the need for manual setup or separate tools.
The Smart Money Gap represents years of development and refinement aimed at creating a unified, event-driven trading system. It was designed to help traders manage through the constant noise of the market, and we hope that traders benefit from having an additional tool to support and diversify their trading strategy.

Heatmap Trailing Stop with Breakouts (Zeiierman)█ Overview
Heatmap Trailing Stop with Breakouts (Zeiierman) is a trend and breakout detection tool that combines dynamic trailing stop logic, Fibonacci-based levels, and a real-time market heatmap into a single, intuitive system.
This indicator is designed to help traders visualize pressure zones, manage stop placement, and identify breakout opportunities supported by contextual price–derived heat. Whether you're trailing trends, detecting reversals, or entering on explosive breakouts — this tool keeps you anchored in structure and sentiment.
It projects adaptive trailing stop levels and calculates Fibonacci extensions from swing-based extremes. These levels are then colored by a market heatmap engine that tracks price interaction intensity — showing where the market is "hot" and likely to respond.
On top of that, it includes breakout signals powered by HTF momentum conditions, trend direction, and heatmap validation — giving you signals only when the context is strong.
█ How It Works
⚪ Trailing Stop Engine
At its core, the script uses an ATR-based trailing stop with trend detection:
ATR Length – Defines volatility smoothing using EMA MA of true range.
Multiplier – Expands/retracts the trailing offset depending on market aggression.
Real-Time Extremum Tracking – Uses local highs/lows to define Fibonacci anchors.
⚪ Fibonacci Projection + Heatmap
With each trend shift, Fibonacci levels are projected from the new swing to the current trailing stop. These include:
Fib 61.8, 78.6, 88.6, and 100% (trailing stop) lines
Heatmap Coloring – Each level'slevel's color is determined by how frequently price has interacted with that level in the recent range (defined by ATR).
Strength Score (1–10) – The number of touches per level is normalized and averaged to create a heatmap ""score"" displayed as a colored bar on the chart.
⚪ Breakout Signal System
This engine detects high-confidence breakout signals using a higher timeframe candle structure:
Bullish Breakout – Strong bullish candle + momentum + trend confirmation + heatmap score threshold.
Bearish Breakout – Strong bearish candle + momentum + trend confirmation + heatmap score threshold.
Cooldown Logic – Prevents signals from clustering too frequently during volatile periods.
█ How to Use
⚪ Trend Following & Trail Stops
Use the Trailing Stop line to manage positions or time entries in line with trend direction. Trailing stop flips are highlighted with dot markers.
⚪ Fibonacci Heat Zones
The projected Fibonacci levels serve as price magnets or support/resistance zones. Watch how price reacts at Fib 61.8/78.6/88.6 levels — especially when they're glowing with high heatmap scores (more glow = more historical touches = stronger significance).
⚪ Breakout Signals
Enable breakout signals when you want to trade breakouts only under strong context. Use the "Heatmap Strength Threshold" to require a minimum score (1–10).
█ Settings
Stop Distance ATR Length – ATR period for volatility smoothing
Stop Distance Multiplier – Adjusts the trailing stop'sstop's distance from price
Heatmap Range ATR Length – Defines how far back the heatmap scans for touches
Number of Heat Levels – Total levels used in the heatmap (more = finer resolution)
Minimum Touches per Level – Defines what counts as a ""hot"" level
Heatmap Strength Threshold – Minimum average heat score (1–10) required for breakouts
Timeframe – HTF source used to evaluate breakout momentum structure
-----------------
Disclaimer
The content provided in my scripts, indicators, ideas, algorithms, and systems is for educational and informational purposes only. It does not constitute financial advice, investment recommendations, or a solicitation to buy or sell any financial instruments. I will not accept liability for any loss or damage, including without limitation any loss of profit, which may arise directly or indirectly from the use of or reliance on such information.
All investments involve risk, and the past performance of a security, industry, sector, market, financial product, trading strategy, backtest, or individual's trading does not guarantee future results or returns. Investors are fully responsible for any investment decisions they make. Such decisions should be based solely on an evaluation of their financial circumstances, investment objectives, risk tolerance, and liquidity needs.

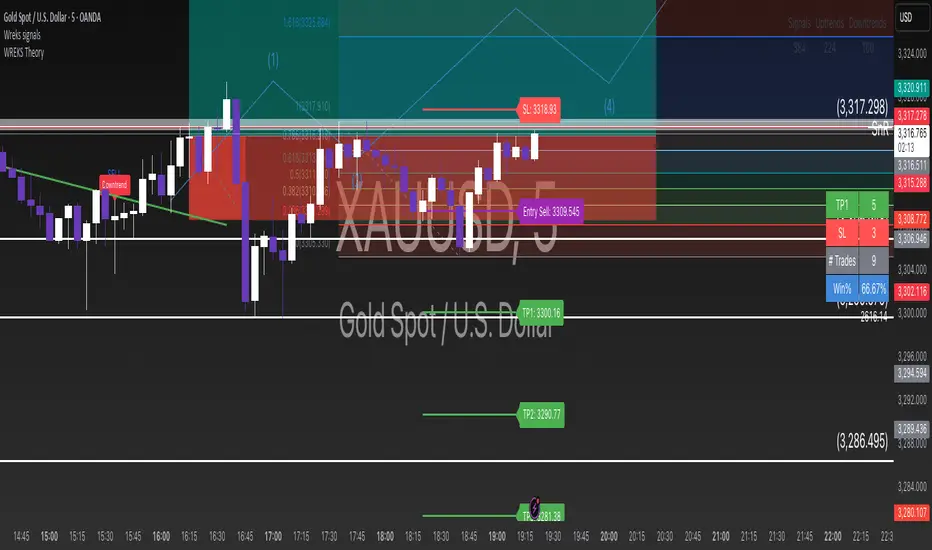
Fibonacci Optimal Entry Zone [OTE] (Zeiierman)█ Overview
Fibonacci Optimal Entry Zone (Zeiierman) is a high-precision market structure tool designed to help traders identify ideal entry zones during trending markets. Built on the principles of Smart Money Concepts (SMC) and Fibonacci retracements, this indicator highlights key areas where price is most likely to react — specifically within the "Golden Zone" (between the 50% and 61.8% retracement).
It tracks structural pivot shifts (CHoCH) and dynamically adjusts Fibonacci levels based on real-time swing tracking. Whether you're trading breakouts, pullbacks, or optimal entries, this tool brings unparalleled clarity to structure-based strategies.
Ideal for traders who rely on confluence, this indicator visually synchronizes swing highs/lows, market structure shifts, Fibonacci retracement levels, and trend alignment — all without clutter or lag.
⚪ The Structural Assumption
Price moves in waves, but key retracements often lead to continuation or reversal — especially when aligned with structure breaks and trend shifts.
The Optimal Entry Zone captures this behavior by anchoring Fibonacci levels between recent swing extremes. The most powerful area — the Golden Zone — marks where institutional re-entry is likely, providing traders with a sniper-like roadmap to structure-based entries.
█ How It Works
⚪ Structure Tracking Engine
At its core, the indicator detects pivots and classifies trend direction:
Structure Period – Determines the depth of pivots used to detect swing highs/lows.
CHoCH – Break of structure logic identifies where the trend shifts or continues, marked visually on the chart.
Bullish & Bearish Modes – Independently toggle uptrend and downtrend detection and styling.
⚪ Fibonacci Engine
Upon each confirmed structural shift, Fibonacci retracement levels are projected between swing extremes:
Custom Levels – Choose which retracements (0.50, 0.618, etc.) are shown.
Real-Time Adjustments – When "Swing Tracker" is enabled, levels and labels update dynamically as price forms new swings.
Example:
If you disable the Swing Tracker, the Golden Level is calculated using the most recent confirmed swing high and low.
If you enable the Swing Tracker, the Golden Level is calculated from the latest swing high or low, making it more adaptive as the trend evolves in real time.
█ How to Use
⚪ Structure-Based Entry
Wait for CHoCH events and use the resulting Fibonacci projection to identify entry points. Enter trades as price taps into the Golden Zone, especially when confluence forms with swing structure or order blocks.
⚪ Real-Time Reaction Tracking
Enable Swing Tracker to keep the tool live — constantly updating zones as price shifts. This is especially useful for scalpers or intraday traders who rely on fresh swing zones.
█ Settings
Structure Period – Number of bars used to define swing pivots. Larger values = stronger structure.
Swing Tracker – Auto-updates fib levels as new highs/lows form.
Show Previous Levels – Keep older fib zones on chart or reset with each structure shift.
-----------------
Disclaimer
The content provided in my scripts, indicators, ideas, algorithms, and systems is for educational and informational purposes only. It does not constitute financial advice, investment recommendations, or a solicitation to buy or sell any financial instruments. I will not accept liability for any loss or damage, including without limitation any loss of profit, which may arise directly or indirectly from the use of or reliance on such information.
All investments involve risk, and the past performance of a security, industry, sector, market, financial product, trading strategy, backtest, or individual's trading does not guarantee future results or returns. Investors are fully responsible for any investment decisions they make. Such decisions should be based solely on an evaluation of their financial circumstances, investment objectives, risk tolerance, and liquidity needs.

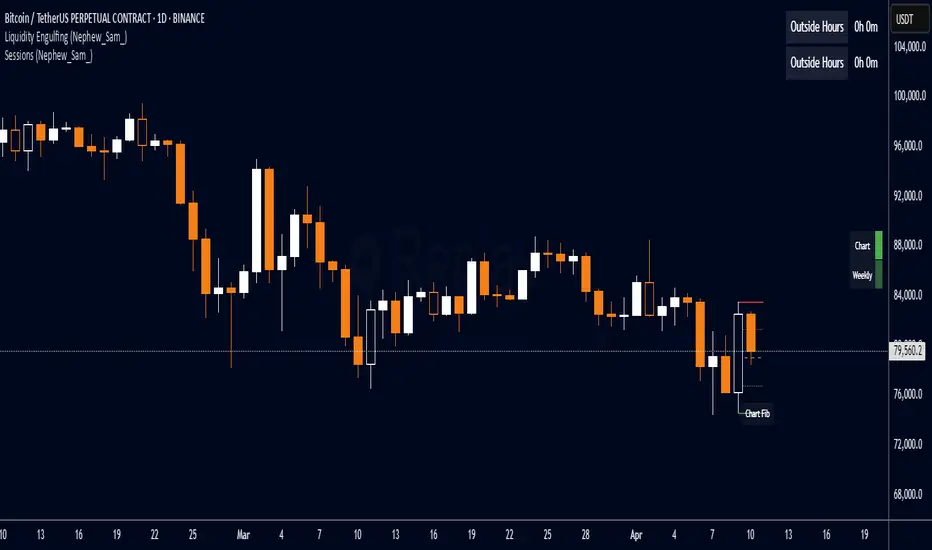
Liquidity Engulfing (Nephew_Sam_)🔥 Liquidity Engulfing Multi-Timeframe Detector
This indicator finds engulfing bars which have swept liquidity from its previous candle. You can use it across 6 timeframes with fibonacci entries.
⚡ Key Features
6 Customizable Timeframes - Complete market structure analysis
Smart Liquidity Detection - Finds patterns that sweep liquidity then reverse
Real-Time Status Table - Confirmed vs unconfirmed patterns with color coding
Fibonacci Integration - 5 customizable fib levels for precise entries
HTF → LTF Strategy - Spot reversals on higher timeframes, enter on lower timeframe fibs
📈 Engulfing Rules
Bullish: Current candle bullish + previous bearish + current low < previous low + current close > previous open
Bearish: Current candle bearish + previous bullish + current high > previous high + current close < previous open
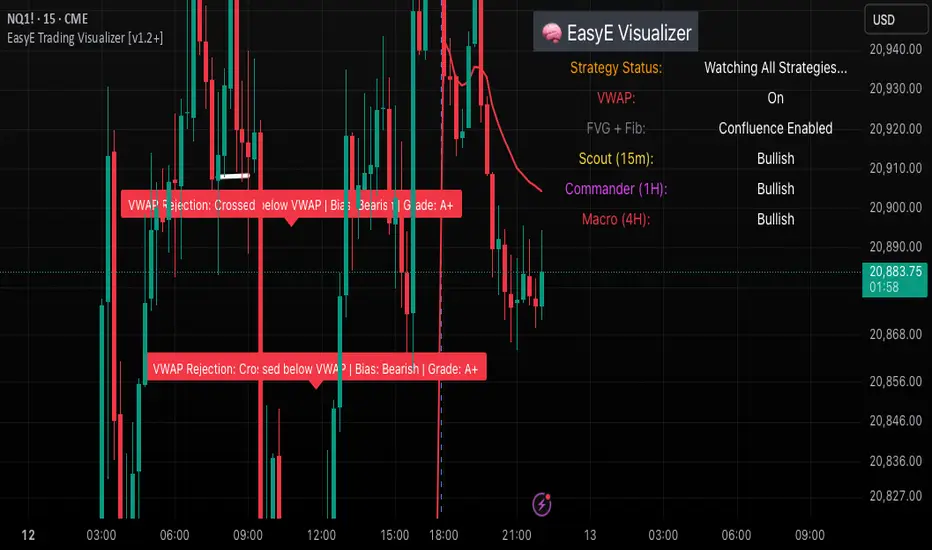
EasyE Trading Visualizer [v1.2+]This indicator is a comprehensive trading assistant designed for scalpers and intraday traders who prioritize structure, liquidity, and real-time narrative detection. It combines multi-confirmation logic into a clean visual system that helps traders anticipate price behavior before major moves.
The system evaluates several strategic concepts, including:
Commander Collapse / Reclaim: Detects structural breaks using higher-timeframe logic to identify failed or confirmed directional momentum.
Trap Rejection: Identifies potential reversal setups based on liquidity grabs followed by engulfing confirmations.
VWAP Reject Reload: Flags potential fade setups against volume-weighted average price, especially during retests.
Liquidity Sweeps: Differentiates between high and low liquidity grabs (sweeps), helping spot traps or continuation patterns.
FVG + Fib Confluence: Integrates smart fib zones (based on large candles) with fair value logic to confirm high-quality zones.
Flip Zones: Detects support/resistance flips and auto-clears broken levels while leaving label trails to track behavior.
Entry signals (Buy/Sell) are accompanied by a dynamic grading system:
Grade A: Strong institutional-quality moves (confluence + structural break).
Grade B: Confluence without full structure shift.
Grade C: Weak setups that lack follow-through or require confirmation.
All logic is toggleable. Users can choose compact display, emoji-only labeling, left/right justification, or predictive label plotting for next-bar anticipation.
The logic does not repaint and is built to help traders read the tape clearly and act with confidence—not just react.
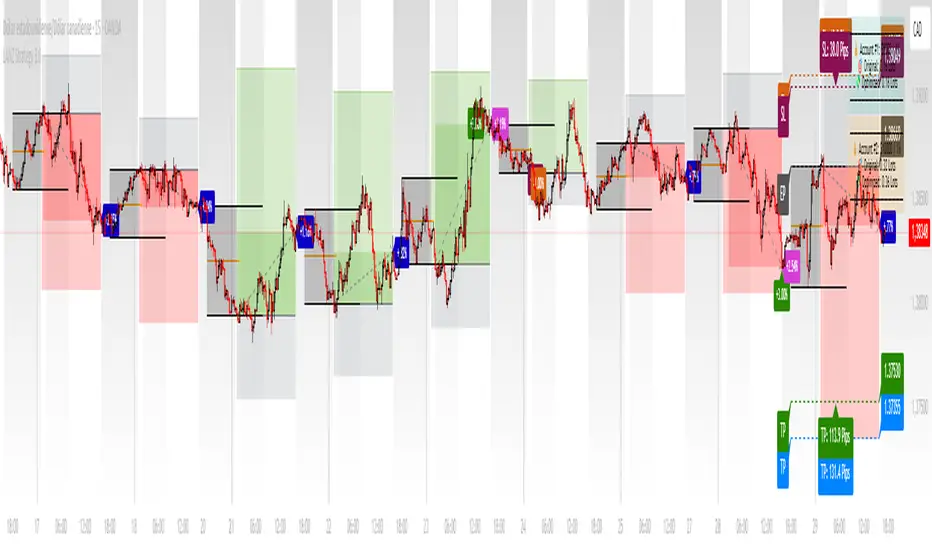
LANZ Strategy 3.0🔷 LANZ Strategy 3.0 — Asian Range Fibonacci Strategy with Execution Window Logic
LANZ Strategy 3.0 is a rule-based trading system that utilizes the Asian session range to project Fibonacci levels and manage entries during a defined execution window. Designed for Forex and index traders, this strategy focuses on structured price behavior around key levels before the New York session.
🧠 Core Components:
Asian Session Range Mapping: Automatically detects the high, low, and midpoint during the Asian session.
Fibonacci Level Projection: Projects configurable Fibonacci retracement and extension levels based on the Asian range.
Execution Window Logic: Uses the 01:15 NY candle as a reference to validate potential reversals or continuation setups.
Conditional Entry System: Includes logic for limit order entries (buy or sell) at specific Fib levels, with reversal logic if price breaks structure before execution.
Risk Management: Entry orders are paired with dynamic SL and TP based on Fibonacci-based distances, maintaining a risk-reward ratio consistent with intraday strategies.
📊 Visual Features:
Asian session high/low/mid lines.
Fibonacci levels: Original (based on raw range) and Optimized (user-adjustable).
Session background coloring for Asia, Execution Window, and NY session.
Labels and lines for entry, SL, and TP targets.
Dynamic deletion of untriggered orders after execution window expires.
⚙️ How It Works:
The script calculates the Asian session range.
Projects Fibonacci levels from the range.
Waits for the 01:15 NY candle to close to validate a signal.
If valid, a limit entry order (BUY or SELL) is plotted at the selected level.
If price structure changes (e.g., breaks the high/low), reversal logic may activate.
If no trade is triggered, orders are cleared before the NY session.
🔔 Alerts:
Alerts trigger when a valid setup appears after 01:15 NY candle.
Optional alerts for order activation, SL/TP hit, or trade cancellation.
📝 Notes:
Intended for semi-automated or discretionary trading.
Best used on highly liquid markets like Forex majors or indices.
Script parameters include session times, Fib ratios, SL/TP settings, and reversal logic toggle.
Credits:
Developed by LANZ, this script merges traditional session-based analysis with Fibonacci tools and structured execution timing, offering a unique framework for morning volatility plays.
Smart Range DetectorSmart Range Detector
What It Does
This indicator automatically detects and validates significant trading ranges using pivot point analysis combined with logarithmic fibonacci relationships. It operates by identifying specific pivot patterns (High-Low-High and Low-High-Low) that meet fibonacci validation criteria to filter out noise and highlight only the most reliable trading ranges. Each range is continuously monitored for potential mitigation (breakout) events.
Key Features
Identifies both High-Low-High and Low-High-Low range patterns
Validates each range using logarithmic fibonacci relationships (more accurate than linear fibs)
Detects range mitigations (breakouts) and visually differentiates them
Shows fibonacci levels within ranges (25%, 50%, 75%) for potential reversal points
Visualizes extension levels beyond ranges for breakout targets
Analyzes volume profile with customizable price divisions (default: 60)
Displays Point of Control (POC) and Value Area for traded volume analysis
Implements performance optimization with configurable range limits
Includes user-adjustable safety checks to prevent Pine Script limitations
Offers fully customizable colors, line widths, and transparency settings
How To Use It
Identify Valid Ranges : The indicator automatically detects and highlights trading ranges that meet fibonacci validation criteria
Monitor Fibonacci Levels : Watch for price reactions at internal fib levels (25%, 50%, 75%) for potential reversal opportunities
Track Extension Targets : Use the extension lines as potential targets when price breaks out of a range
Analyze Volume Structure : Enable the volume profile mode to see where most volume was traded within mitigated ranges
Trade Range Boundaries : Look for reactions at range highs/lows combined with volume POC for higher probability entries
Manage Performance : Adjust the maximum displayed ranges and history bars settings for optimal chart performance
Settings Guide
Left/Right Bars Look Back : Controls how far back the indicator looks to identify pivot points (higher values find more ranges but may reduce sensitivity)
Max History Bars : Limits how far back in history the indicator will analyze (stays within Pine Script's 10,000 bar limitation)
Max Ranges to Display : Restricts the total number of ranges kept in memory for improved performance (1-50)
Volume Profile : When enabled, shows volume distribution analysis for mitigated ranges
Volume Profile Divisions : Controls the granularity of the volume analysis (higher values show more detail)
Display Options : Toggle visibility of range lines, fibonacci levels, extension lines, and volume analysis elements
Transparency & Color Settings : Fully customize the visual appearance of all indicator elements
Line Width Settings : Adjust the thickness of lines for better visibility on different timeframes
Technical Details
The indicator uses logarithmic fibonacci calculations for more accurate price relationships
Volume profile analysis creates 60 price divisions by default (adjustable) for detailed volume distribution
All timestamps are properly converted to work with Pine Script's bar limitations
Safety checks prevent "array index out of bounds" errors that plague many complex indicators
Time-based coordinates are used instead of bar indices to prevent "bar index too far" errors
This indicator works well on all timeframes and instruments, but performs best on 5-minute to daily charts. Perfect for swing traders, range traders, and breakout strategists.
What Makes It Different
Most range indicators simply draw boxes based on recent highs and lows. Smart Range Detector validates each potential range using proven fibonacci relationships to filter out noise. It then adds sophisticated volume analysis to help traders identify the most significant price levels within each range. The performance optimization features ensure smooth operation even on lower timeframes and extended history analysis.

WREKS Theory📊 WREKS Theory – Advanced Market Structure & Auto-Fibonacci Indicator
By WREKS Trading Community
📊 WREKS Theory – Advanced Market Structure & Auto-Fibonacci Indicator
By WREKS Trading Community
✅ Overview
The WREKS Theory indicator is a robust, all-in-one technical analysis tool designed to identify trend direction, generate buy/sell signals, and project key Fibonacci levels for precision trading. It merges the logic of Dow Theory (Higher Highs & Higher Lows), SMA filtering, and automated Fibonacci clusters based on ZigZag pivots to highlight optimal price zones for entry, reversal, and take-profit.
🧠 Built-in Logic
Dow Theory Engine: Detects confirmed uptrends and downtrends based on recent pivot highs and lows.
SMA-144 Filter: Confirms signal strength by filtering trades aligned with the dominant trend.
ZigZag-based Auto-Fibonacci: Dynamically maps Fibonacci retracement and extension levels from the most recent swing, with color-coded visual lines and labels.
Signal Dashboard: Displays trend change counts (Uptrends / Downtrends) and real-time status in a clean table on the chart.
Smart Alerts: Triggers when buy/sell signals occur or when price crosses Fibonacci levels.
📌 Key Features
🔺 Buy / Sell Markers: Auto-labeled on the chart using real-time trend shift confirmation.
📈 Fibonacci Cluster Map: Automatically draws up to 22 customizable Fib levels including negative retracements and advanced extensions (0.236 to 4.618+).
🎯 Trend Labels: Clearly marks “Uptrend” and “Downtrend” zones.
💡 Visual Table: Quick reference for signal frequency and trend transitions.
🔔 Alerts: Built-in alerts for trade signals and price interactions with Fib levels.
⚙️ Fully Customizable: Modify SMA, pivot length, depth, deviation multiplier, line extension style, color themes, and more.
📈 Benefits for Traders
✅ Enhanced Trend Confirmation using Dow Theory logic with SMA filtering.
✅ Precision Entry & Exit Zones through auto-drawn Fibonacci retracement and extension levels.
✅ Reduces False Signals by requiring both market structure and trend alignment.
✅ Saves Time with automated drawing and real-time alerts.
✅ Ideal for All Assets & Timeframes: Works seamlessly across Forex, Crypto, Stocks, and Commodities.
💼 Best Use Cases
Intraday & swing trading using market structure.
Identifying major retracement zones for pullback entries.
Recognizing Fibonacci confluence zones to set stop-loss and take-profit levels.
Trend-following strategies validated by SMA and Dow confirmation.
GCM Supreme Trading System Pro (With Golden Zone)Okay, bro! Here are some notes on your "GCM Supreme Trading System Pro (Dashboard + RSI)" indicator based on the Pine Script code you provided. Think of this as a breakdown of its components, logic, and how you might use it, along with some things to consider.
GCM Supreme Trading System Pro (Dashboard + RSI) - Notes
Overall Concept:
This indicator aims to provide an "all-in-one" visual dashboard and signal system by combining several technical analysis concepts:
Short-Term Trend: Using a fast EMA.
Volatility/Channel: High/Low plot with fill.
Sentiment: Background color based on price vs. EMA.
Price Structure/Pattern: Highlighting potential AMD phases.
Key Price Level: Previous day's specific Fibonacci zone (Golden Zone).
Momentum: RSI Overbought/Oversold status.
Volume Analysis: Identifying volume spikes.
Risk Assessment: Based on ATR volatility.
Signal Generation: Based on EMA direction change confirmed by candle color.
Centralized Summary: A dashboard showing the status of key components.
Key Components & How They Work:
Trend EMA (Length: 3 by default):
What: A very fast Exponential Moving Average of the specified source (close by default).
How: Plots the EMA line. Colors the line green if the EMA is moving up, red if moving down, gray if flat.
Usage: Provides a very quick view of the immediate price direction and momentum.
High/Low Channel Lines & Fill:
What: Plots the current bar's high and low.
How: The area between the high and low is filled. The fill color changes based on whether the Trend EMA is moving up (green fill), down (red fill), or is neutral (gray fill).
Usage: Visualizes the recent price range/volatility and ties it to the immediate trend direction.
Sentiment Background:
What: Colors the chart background.
How: Background is lightly colored green if the close is above the Trend EMA, and red if the close is below the Trend EMA.
Usage: Reinforces the current short-term bias based on price's position relative to the fast EMA.
AMD Pattern Candles:
What: Highlights specific candle patterns often associated with Accumulation, Manipulation, and Distribution phases.
How:
Accumulation (Aqua): Previous candle was Red, current candle is Green (Red -> Green).
Manipulation (Yellow): Previous candle was Green, current candle is Red (Green -> Red).
Distribution (Fuchsia): Two consecutive Red candles where the candle before the first Red was Not Red (Not Red -> Red -> Red).
Usage: Helps visually spot potential shifts in market behavior according to the AMD concept.
Previous Day's Fib Golden Zone (0.55-0.66):
What: Calculates a specific Fibonacci zone (between 55% and 66%) based on the previous day's range (High-Low).
How: Plots a horizontal box on the chart covering the calculated zone level. Uses the previous day's range direction (Green/Red candle) to determine if the zone is calculated up from the low (Green day) or down from the high (Red day).
Usage: Identifies a potential key retracement or support/resistance zone from the previous day's price action that may be relevant for the current day.
RSI (Relative Strength Index):
What: A classic momentum oscillator.
How: Calculates the RSI value based on the specified length and source. The dashboard shows the current value and flags it as Overbought (> OB level), Oversold (< OS level), or Neutral.
Usage: Provides context on momentum extremes. High RSI suggests strong upward momentum (potentially overextended), low RSI suggests strong downward momentum (potentially oversold).
Volume Spike Confirmation:
What: Compares current volume to its Moving Average.
How: Calculates a simple moving average of volume. Identifies a "Spike" if the current volume is significantly higher (multiplied by a factor) than the MA.
Usage: Provides a contextual check for increased activity accompanying price moves. (Note: In the current script, this is calculated and shown on the dashboard but not directly used in the signal label logic, though it could be added).
Risk Assessment (ATR):
What: Uses the Average True Range.
How: Calculates the ATR for the specified length. Compares the current ATR to a longer-term average ATR. Flags "High Risk" if the current ATR is significantly higher than the average.
Usage: Gives an indication of current volatility relative to recent history, which can inform stop-loss placement or position sizing.
Signals (Buy/Sell Labels):
What: Plots "BUY" or "SELL" labels on the chart.
How:
BUY Signal: Triggers when the Trend EMA starts moving Up on the previous bar AND the current bar is Green (close > open).
SELL Signal: Triggers when the Trend EMA starts moving Down on the previous bar AND the current bar is Red (close < open).
Usage: These are your potential entry triggers. They indicate that the fast EMA trend has just changed direction and the current candle is confirming that move with its color.
Dashboard:
What: A 2x5 table displayed on the chart (bottom right by default).
How: Shows the current status of:
Trend (Bull/Bear/Neutral)
Volume (Spike/Normal)
Last Signal (🟢 BUY, 🔴 SELL, or None)
Risk (High/Normal based on ATR)
RSI (Overbought/Oversold/Neutral + Current Value)
Usage: Provides a quick, centralized summary of multiple indicator components without having to visually check every detail on the chart or separate panes.
How to Potentially Use It (Example Interpretation):
Look for a BUY signal (Green label) when:
The dashboard shows "🟢 BUY" as the Last Signal.
Consider additional confirmation: Is Volume status "Spike"? Is Risk "Normal"? Is RSI not "Overbought" (or perhaps just coming out of "Oversold" territory)? Is the price above/interacting positively with the Golden Zone?
Look for a SELL signal (Red label) when:
The dashboard shows "🔴 SELL" as the Last Signal.
Consider additional confirmation: Is Volume status "Spike"? Is Risk "Normal"? Is RSI not "Oversold" (or perhaps just coming out of "Overbought" territory)? Is the price below/interacting negatively with the Golden Zone?
Use the Sentiment Background and High/Low Channel Fill to quickly see the immediate trend and volatility context.
Watch AMD candles around key levels (like the Golden Zone or signal triggers) for potential pattern confirmation.
Check the Dashboard frequently for a summary of all these factors, even without a specific signal.
Strengths & Potential Benefits:
Comprehensive View: Integrates multiple popular trading concepts into a single indicator.
Visual Clarity: Uses colors, fills, labels, and a dashboard for easy interpretation.
Customizable: Inputs allow tuning the sensitivity of the EMA, Volume, ATR, and RSI to different assets/timeframes.
Dashboard Efficiency: Saves time by consolidating key status points.
Non-Repainting Signals: The buy/sell labels trigger and stay based on closed bar data.
Important Considerations & Limitations:
Fast EMA Sensitivity: An EMA length of 3 is very fast and prone to whipsaws, especially in choppy or ranging markets. Signals based solely on this could be frequent and unreliable in non-trending conditions.
Signal Logic: The core signal is only based on EMA direction change + candle color. While simple, it might miss opportunities or generate signals without broader market confirmation (like strong volume, favorable RSI position, or reaction at key levels). The dashboard provides these other factors as context, but they aren't required for the signal label in the current code.
Golden Zone Reliance: The previous day's Fib zone is just one potential level. It won't always be respected, and its relevance might vary significantly across different markets and timeframes.
AMD Patterns: The defined AMD patterns are specific. The market's "real" accumulation/manipulation/distribution might manifest in more complex ways.
Dashboard as Summary, Not Signal: Remember the dashboard shows the current status of all components on the last bar, but the BUY/SELL signal labels are based on a specific historical event (previous bar's EMA turn). You need to look at both: the label for the trigger, and the dashboard for the confluence of other factors right now.
Not a Standalone System: While called a "Trading System," no single indicator guarantees profitability. This tool provides signals and context, but requires a robust trading plan including stop losses, profit targets, position sizing, and potentially confluence with other analysis methods.
Timeframe Dependency: The ideal settings (EMA length, RSI length, etc.) will likely differ significantly between timeframes (e.g., 1-minute vs. 4-hour). Testing and optimization are crucial.
In Summary:
The "GCM Supreme Trading System Pro (Dashboard + RSI)" is a well-designed indicator that consolidates several useful analysis tools into a single view. Its strength lies in providing quick visual context and a clear signal trigger based on short-term trend shifts. However, like any indicator, it's not perfect. Its effectiveness will largely depend on the market conditions, the chosen settings, and how it's integrated into a comprehensive trading strategy, using the dashboard components as essential confirmation and risk assessment tools alongside the primary signal labels.

Wyckoff Schematic - Accumulation [TrendX_]Wyckoff Schematic 1 - Accumulation is an advanced Wyckoff method tool on TradingView, designed to automate the identification of critical phases and price structures within the Wyckoff Accumulation Schematic. By detecting key events such as SC (Selling Climax), AR (Automatic Rally), Spring, and SOS (Sign of Strength), this tool helps traders visualize institutional accumulation patterns, anticipate trend reversals, and identify potential entry points aligned with the Wyckoff model—all without requiring hours of manual monitoring. The indicator dynamically labels key points, draws accumulation zones, and triggers alerts upon phase confirmations, reducing manual analysis and emotional bias.
💎 FEATURES
▶ Phase A: Bottom Identification
Auto-detects Selling Climax (SC), Automatic Rally (AR), and Secondary Test (ST).
Customizable initial trend detection: FTD (Follow-Through Day), Market Structure Shift, Triple MA Crossover, or Ichimoku Cloud.
▶ Phase B: Accumulation Range Formation
Identifies SOS(b) and ST(b) in Phase B
Customizable sweep levels for ST detection: previous SC / ST(a) / Fibonacci retracement levels of AR & SC.
▶ Phase C: Accumulation Confirmation
Flags Spring (false breakdown) and Test (confirmation of false breakdown).
▶ Phase D: Breakout Preparation
Detects SOS and BU/LPS for breakout confirmation.
▶ Visual Tools
Auto-draws accumulation range SC, AR, SOS(b) with real-time extensions.
Labels all critical events (SC, AR, ST, SOS, Spring, LPS) with text and markers.
Draws colored boxes for confirmed phases A, B and C, and triggers alerts for start of Markup with SOS and BU/LPS.
🔎 BREAKOUT
Phase A: Halting the Downtrend
▶ Key Events: SC, AR, ST(a).
▶ Functions:
SC: Marks panic selling, often with high volume.
AR: Sharp rebound after SC, reflecting short-term demand.
ST(a): Retest of SC lows to confirm weakening supply.
▶ Importance:
Phase A signals the end of a downtrend. The SC shows exhaustion, while the AR and ST confirm that sellers are losing control. Customizable trend detection (e.g., Ichimoku Cloud or FTD) ensures alignment with broader market context or your preference.
Phase B: Building the Accumulation Range
▶ Key events: SOS (Pha B), ST (Pha B).
▶ Functions:
SOS(b): A rally breaking above the AR, indicating strong demand.
ST(b): Retests of SC / ST(a) / Fib level to sweep liquidity (trap late sellers).
▶ Importance:
Phase B confirms the sideways range. SOS reflects institutional buying, while ST(b) traps sellers. Sweeping SC / ST(a) / Fib level would help identify false breakdowns.
Phase C: Spring & Test
▶ Key events: Spring (false breakdown), Test (confirmation).
▶ Functions:
Spring: A deliberate drop below Phase B support to eliminate weak traders.
Test: Retest of the Spring low to confirm sustained demand.
▶ Importance:
Phase C is the final "shakeout" to confirm accumulation. The Spring traps weak hands, while the Test validates support, confirming the institution has bought enough, signaling readiness for Markup.
Phase D: Breakout / Start of Markup
▶ Key events: SOS, BU/LPS.
▶ Functions:
SOS: A strong rally breaking above the accumulation range.
BU/LPS: Pullback after SOS to retest the breakout level.
▶ Importance:
Phase D confirms the start of a Markup. SOS shows demand overpowering supply, while BU/LPS offers low-risk entry points.
Accumulation Range & Visual Tools
▶ Accumulation Range: Drawn between SC (low) and AR (high), reflecting institutional buying activity.
▶ Labels/Boxes: Clear labels (SC, AR, ST, SOS, Spring, …) track each phase.
▶ Alerts: Notifies users when SOS or BU/LPS appears.
🛠️ USAGE
▶ Configuration
Phase A: Select trend detection method based on your preference and trading style (FTD, Market Structure, Triple MA, Mây Ichimoku).
Phase B: Adjust sweep levels (SC, ST(a), Fibonacci 61.8% của AR & SC).
▶ Interpretation
Bullish Trend: Confirmed Phase C (Spring + Test) followed by SOS in Phase D.
▶ Trading Strategy
Enter long positions at BU/LPS (Phase D) with volume or momentum confirmation.
Uses other Break-out strategy after SOS appear for Long Entry.
DISCLAIMER
This indicator is not financial advice, it can only help traders make better decisions. There are many factors and uncertainties that can affect the outcome of any endeavor, and no one can guarantee or predict with certainty what will occur. Therefore, one should always exercise caution and judgment when making decisions based on past performance.

Multi-Fibonacci Trend Average[FibonacciFlux]Multi-Fibonacci Trend Average (MFTA): An Institutional-Grade Trend Confluence Indicator for Discerning Market Participants
My original indicator/Strategy:
Engineered for the sophisticated demands of institutional and advanced traders, the Multi-Fibonacci Trend Average (MFTA) indicator represents a paradigm shift in technical analysis. This meticulously crafted tool is designed to furnish high-definition trend signals within the complexities of modern financial markets. Anchored in the rigorous principles of Fibonacci ratios and augmented by advanced averaging methodologies, MFTA delivers a granular perspective on trend dynamics. Its integration of Multi-Timeframe (MTF) filters provides unparalleled signal robustness, empowering strategic decision-making with a heightened degree of confidence.
MFTA indicator on BTCUSDT 15min chart with 1min RSI and MACD filters enabled. Note the refined signal generation with reduced noise.
MFTA indicator on BTCUSDT 15min chart without MTF filters. While capturing more potential trading opportunities, it also generates a higher frequency of signals, including potential false positives.
Core Innovation: Proprietary Fibonacci-Enhanced Supertrend Averaging Engine
The MFTA indicator’s core innovation lies in its proprietary implementation of Supertrend analysis, strategically fortified by Fibonacci ratios to construct a truly dynamic volatility envelope. Departing from conventional Supertrend methodologies, MFTA autonomously computes not one, but three distinct Supertrend lines. Each of these lines is uniquely parameterized by a specific Fibonacci factor: 0.618 (Weak), 1.618 (Medium/Golden Ratio), and 2.618 (Strong/Extended Fibonacci).
// Fibonacci-based factors for multiple Supertrend calculations
factor1 = input.float(0.618, 'Factor 1 (Weak/Fibonacci)', minval=0.01, step=0.01, tooltip='Factor 1 (Weak/Fibonacci)', group="Fibonacci Supertrend")
factor2 = input.float(1.618, 'Factor 2 (Medium/Golden Ratio)', minval=0.01, step=0.01, tooltip='Factor 2 (Medium/Golden Ratio)', group="Fibonacci Supertrend")
factor3 = input.float(2.618, 'Factor 3 (Strong/Extended Fib)', minval=0.01, step=0.01, tooltip='Factor 3 (Strong/Extended Fib)', group="Fibonacci Supertrend")
This multi-faceted architecture adeptly captures a spectrum of market volatility sensitivities, ensuring a comprehensive assessment of prevailing conditions. Subsequently, the indicator algorithmically synthesizes these disparate Supertrend lines through arithmetic averaging. To achieve optimal signal fidelity and mitigate inherent market noise, this composite average is further refined utilizing an Exponential Moving Average (EMA).
// Calculate average of the three supertends and a smoothed version
superlength = input.int(21, 'Smoothing Length', tooltip='Smoothing Length for Average Supertrend', group="Fibonacci Supertrend")
average_trend = (supertrend1 + supertrend2 + supertrend3) / 3
smoothed_trend = ta.ema(average_trend, superlength)
The resultant ‘Smoothed Trend’ line emerges as a remarkably responsive yet stable trend demarcation, offering demonstrably superior clarity and precision compared to singular Supertrend implementations, particularly within the turbulent dynamics of high-volatility markets.
Elevated Signal Confluence: Integrated Multi-Timeframe (MTF) Validation Suite
MFTA transcends the limitations of conventional trend indicators by incorporating an advanced suite of three independent MTF filters: RSI, MACD, and Volume. These filters function as sophisticated validation protocols, rigorously ensuring that only signals exhibiting a confluence of high-probability factors are brought to the forefront.
1. Granular Lower Timeframe RSI Momentum Filter
The Relative Strength Index (RSI) filter, computed from a user-defined lower timeframe, furnishes critical momentum-based signal validation. By meticulously monitoring RSI dynamics on an accelerated timeframe, traders gain the capacity to evaluate underlying momentum strength with precision, prior to committing to signal execution on the primary chart timeframe.
// --- Lower Timeframe RSI Filter ---
ltf_rsi_filter_enable = input.bool(false, title="Enable RSI Filter", group="MTF Filters", tooltip="Use RSI from lower timeframe as a filter")
ltf_rsi_timeframe = input.timeframe("1", title="RSI Timeframe", group="MTF Filters", tooltip="Timeframe for RSI calculation")
ltf_rsi_length = input.int(14, title="RSI Length", minval=1, group="MTF Filters", tooltip="Length for RSI calculation")
ltf_rsi_threshold = input.int(30, title="RSI Threshold", minval=0, maxval=100, group="MTF Filters", tooltip="RSI value threshold for filtering signals")
2. Convergent Lower Timeframe MACD Trend-Momentum Filter
The Moving Average Convergence Divergence (MACD) filter, also calculated on a lower timeframe basis, introduces a critical layer of trend-momentum convergence confirmation. The bullish signal configuration rigorously mandates that the MACD line be definitively positioned above the Signal line on the designated lower timeframe. This stringent condition ensures a robust indication of converging momentum that aligns synergistically with the prevailing trend identified on the primary timeframe.
// --- Lower Timeframe MACD Filter ---
ltf_macd_filter_enable = input.bool(false, title="Enable MACD Filter", group="MTF Filters", tooltip="Use MACD from lower timeframe as a filter")
ltf_macd_timeframe = input.timeframe("1", title="MACD Timeframe", group="MTF Filters", tooltip="Timeframe for MACD calculation")
ltf_macd_fast_length = input.int(12, title="MACD Fast Length", minval=1, group="MTF Filters", tooltip="Fast EMA length for MACD")
ltf_macd_slow_length = input.int(26, title="MACD Slow Length", minval=1, group="MTF Filters", tooltip="Slow EMA length for MACD")
ltf_macd_signal_length = input.int(9, title="MACD Signal Length", minval=1, group="MTF Filters", tooltip="Signal SMA length for MACD")
3. Definitive Volume Confirmation Filter
The Volume Filter functions as an indispensable arbiter of trade conviction. By establishing a dynamic volume threshold, defined as a percentage relative to the average volume over a user-specified lookback period, traders can effectively ensure that all generated signals are rigorously validated by demonstrably increased trading activity. This pivotal validation step signifies robust market participation, substantially diminishing the potential for spurious or false breakout signals.
// --- Volume Filter ---
volume_filter_enable = input.bool(false, title="Enable Volume Filter", group="MTF Filters", tooltip="Use volume level as a filter")
volume_threshold_percent = input.int(title="Volume Threshold (%)", defval=150, minval=100, group="MTF Filters", tooltip="Minimum volume percentage compared to average volume to allow signal (100% = average)")
These meticulously engineered filters operate in synergistic confluence, requiring all enabled filters to definitively satisfy their pre-defined conditions before a Buy or Sell signal is generated. This stringent multi-layered validation process drastically minimizes the incidence of false positive signals, thereby significantly enhancing entry precision and overall signal reliability.
Intuitive Visual Architecture & Actionable Intelligence
MFTA provides a demonstrably intuitive and visually rich charting environment, meticulously delineating trend direction and momentum through precisely color-coded plots:
Average Supertrend: Thin line, green/red for uptrend/downtrend, immediate directional bias.
Smoothed Supertrend: Bold line, teal/purple for uptrend/downtrend, cleaner, institutionally robust trend.
Dynamic Trend Fill: Green/red fill between Supertrends quantifies trend strength and momentum.
Adaptive Background Coloring: Light green/red background mirrors Smoothed Supertrend direction, holistic trend perspective.
Precision Buy/Sell Signals: ‘BUY’/‘SELL’ labels appear on chart when trend touch and MTF filter confluence are satisfied, facilitating high-conviction trade action.
MFTA indicator applied to BTCUSDT 4-hour chart, showcasing its effectiveness on higher timeframes. The Smoothed Length parameter is increased to 200 for enhanced smoothness on this timeframe, coupled with 1min RSI and Volume filters for signal refinement. This illustrates the indicator's adaptability across different timeframes and market conditions.
Strategic Applications for Institutional Mandates
MFTA’s sophisticated design provides distinct advantages for advanced trading operations and institutional investment mandates. Key strategic applications include:
High-Probability Trend Identification: Fibonacci-averaged Supertrend with MTF filters robustly identifies high-probability trend continuations and reversals, enhancing alpha generation.
Precision Entry/Exit Signals: Volume and momentum-filtered signals enable institutional-grade precision for optimized risk-adjusted returns.
Algorithmic Trading Integration: Clear signal logic facilitates seamless integration into automated trading systems for scalable strategy deployment.
Multi-Asset/Timeframe Versatility: Adaptable parameters ensure applicability across diverse asset classes and timeframes, catering to varied trading mandates.
Enhanced Risk Management: Superior signal fidelity from MTF filters inherently reduces false signals, supporting robust risk management protocols.
Granular Customization and Parameterized Control
MFTA offers unparalleled customization, empowering users to fine-tune parameters for precise alignment with specific trading styles and market conditions. Key adjustable parameters include:
Fibonacci Factors: Adjust Supertrend sensitivity to volatility regimes.
ATR Length: Control volatility responsiveness in Supertrend calculations.
Smoothing Length: Refine Smoothed Trend line responsiveness and noise reduction.
MTF Filter Parameters: Independently configure timeframes, lookback periods, and thresholds for RSI, MACD, and Volume filters for optimal signal filtering.
Disclaimer
MFTA is meticulously engineered for high-quality trend signals; however, no indicator guarantees profit. Market conditions are unpredictable, and trading involves substantial risk. Rigorous backtesting and forward testing across diverse datasets, alongside a comprehensive understanding of the indicator's logic, are essential before live deployment. Past performance is not indicative of future results. MFTA is for informational and analytical purposes only and is not financial or investment advice.

AutoFibGauge (TechnoBlooms) AutoFibGauge help users to understand Fibonacci retracement with auto-drawn levels from previous candes, dual moving average crossover for trend confirmation, and a thermometer for quick Fib level identification.
This indicator is designed to streamline your trading decisions. By automatically plotting the Fibonacci levels based on previous candles, it aids in identifying key support and resistance zones. User can choose the number of previous candles for which the Fibonacci is calculated.
Paired with a dual moving average crossover system for robust trend confirmation, this tools helps in aligning with the market's direction.
A dynamic thermometer display that instantly highlights critical Fib levels, making it easier than ever to spot opportunities at a glance.

FibLevel Size CalculatorThis skript calculates position sizes and new take profits for sizing into an long or short position with 3 entrys defined at custom fibonacci retracement levels.
TP: -0,272
Entry1: 0.382
Entry2: 0.618
Entry3: 0.83
SL: 1.05
Expected RR per trade is 0.2 with a High Win rate definitly profitable.
Search for an established trend on the higher timeframe, drop to the smaller ones and look for correction waves. Once they break to the trenddirection of the higher timeframe take the fib from lowest to highes point. Draw a fib level on the chart and use the Indicator to define these Levels above. The calculator gives you the Margin to use in each position, and will check that you will not get liquidated an that you have enough margin. It tells you the new TP for Limit2 and Limit3 if they get hit so you can get out of the trade full TP with a small bounce.
Inputs:
Account Balance, Risk Percentage, and Leverage: These inputs are used to calculate the position size and risk.
Entry 1, Entry 2, Entry 3, Take Profit (TP), and Stop Loss (SL): These prices are used for calculating position sizes, risk, and profit for up to three entry points.
Calculations:
Risk Amount: Calculated based on the account balance and risk percentage.
Position Sizes (Qty): For each entry point, the position size is determined. The second and third entries have a multiplier (3x for Entry 2, 5x for Entry 3) compared to the first.
Stop Loss and Profit Calculation: The script calculates the potential profit and adjusts the TP levels based on the average entries for Limit 2 and Limit 3.
Margin Calculation: Margin requirements for each position are calculated based on leverage.
Output:
Table Display: A table shows key values like entry prices, position sizes, TP levels, potential profit, and margin requirements for each limit.
Warnings: It includes a liquidation warning and a check for whether the account is at risk of liquidation based on leverage.
Position Type: It automatically detects if the trade is a long or short based on the relationship between TP and SL.
Visualization:
Lines: It draws horizontal lines on the chart to visually represent the entry, TP, and SL levels.
Overall, this script is designed to help traders manage risk and calculate position sizes for multi-level entries using leverage.
Pls drop feedback in the comments.

Mxwll Price Action Suite [Mxwll]Introducing the Mxwll Price Action Suite!
The Mxwll Price Action Suite is an all-in-one analysis indicator incorporating elements of SMC and also ideas extending beyond the trading methodology!
Features
Internal structures
External structures
Customizable Sensitivities
BoS/CHoCH
Order Blocks
HH/LH/LL/LH Areas
Rolling TF highs/lows
Rolling Volume Comparisons
Auto Fibs
And more!
The image above shows the indicator's market structure identification capabilities. Internal BoS and CHoCH structures in addition to overarching market structures are available with customizable sensitivities.
The image above shows the indicator identifying order blocks! Additionally, HH/LH/LL/LH areas are also identified.
The image above shows a rolling area of interest. These areas can be compared to supply/demand zones, where traders might consider a bargain long/short/sell area.
The indicator displays a rolling 4hr high/low and 1D high/low, alongside auto fibonacci levels with a customizable sensitivity.
Finally, the Mxwll Price Action Suite shows relevant session information.
Table information
Current Session
Countdown to session close
Next Session
Countdown to next session open
Rolling 4-Hr volume intensity
Rolling 24-Hr volume intensity
Introducing the Mxwll SMC Suite!
The Mxwll SMC Suite is an all-in-one analysis indicator incorporating elements of SMC and also ideas extending beyond the trading methodology!
Features
Internal structures
External structures
Customizable Sensitivities
BoS/CHoCH
Order Blocks
HH/LH/LL/LH Areas
Rolling TF highs/lows
Rolling Volume Comparisons
Auto Fibs
And more!
The image above shows the indicator's market structure identification capabilities. Internal BoS and CHoCH structures in addition to overarching market structures are available with customizable sensitivities.
The image above shows the indicator identifying order blocks! Additionally, HH/LH/LL/LH areas are also identified.
The image above shows a rolling area of interest. These areas can be compared to supply/demand zones, where traders might consider a bargain long/short/sell area.
The indicator displays a rolling 4hr high/low and 1D high/low, alongside auto fibonacci levels with a customizable sensitivity.
Finally, the Mxwll Price Action Suite shows relevant session information.
Table information
Current Session
Countdown to session close
Next Session
Countdown to next session open
Rolling 4-Hr volume intensity
Rolling 24-Hr volume intensity
Expanded Features of Mxwll Price Action Suite
Internal and External Structures
Internal Structures: These elements refer to the price formations and patterns that occur within a smaller scope or a specific trading session. The suite can detect intricate details like minor support/resistance levels or short-term trend reversals.
External Structures: These involve larger, more significant market patterns and trends spanning multiple sessions or time frames. This capability helps traders understand overarching market directions.
Customizable Sensitivities
Adjusting sensitivity settings allows users to tailor the indicator's responsiveness to market changes. Higher sensitivity can catch smaller fluctuations, while lower sensitivity might focus on more significant, reliable market moves.
Break of Structure (BoS) and Change of Character (CHoCH)
BoS: This feature identifies points where the price breaks a significant structure, potentially indicating a new trend or a trend reversal.
CHoCH: Detects subtle shifts in the market's behavior, which could suggest the early stages of a trend change before they become apparent to the broader market.
Order Blocks and Market Phases
Order Blocks: These are essentially price levels or zones where significant trading activities previously occurred, likely pointing to the positions of smart money.
HH/LH/LL/LH Areas: Identifying Higher Highs (HH), Lower Highs (LH), Lower Lows (LL), and Lower Highs (LH) helps in understanding the trend and market structure, aiding in predictive analysis.
Rolling Timeframe Highs/Lows and Volume Comparisons
Tracks highs and lows over specified rolling periods, providing dynamic support and resistance levels.
Compares volume data across different timeframes to assess the strength or weakness of the current price movements.
Auto Fibonacci Levels
Automatically calculates and plots Fibonacci retracement levels, a popular tool among traders to identify potential reversal points based on past movements.
Session Data and Volume Intensity
Session Information: Displays current and upcoming trading sessions along with countdown timers, which is crucial for day traders and those trading on session overlaps.
Volume Intensity: Measures and compares the volume within the last 4 hours and 24 hours to gauge market activity and potential breakout/breakdown movements.
Visualizations and Practical Use
Dynamic Visuals: The suite provides dynamic visual aids, such as real-time updating of high/low markers and Fibonacci levels, which adjust as new data comes in. This feature is critical in fast-paced markets.
Strategic Entry/Exit Points: By identifying order blocks and using Fibonacci levels, traders can pinpoint strategic entry and exit points, maximizing potential returns.
Risk Management: Enhanced features like session countdowns and volume intensity help in better risk management by providing traders with more data on market sentiment and potential volatility.

Danger Signals from The Trading MindwheelThe " Danger Signals " indicator, a collaborative creation from the minds at Amphibian Trading and MARA Wealth, serves as your vigilant lookout in the volatile world of stock trading. Drawing from the wisdom encapsulated in "The Trading Mindwheel" and the successful methodologies of legends like William O'Neil and Mark Minervini, this tool is engineered to safeguard your trading journey.
Core Features:
Real-Time Alerts: Identify critical danger signals as they emerge in the market. Whether it's a single day of heightened risk or a pattern forming, stay informed with specific danger signals and a tally of signals for comprehensive decision-making support. The indicator looks for over 30 different signals ranging from simple closing ranges to more complex signals like blow off action.
Tailored Insights with Portfolio Heat Integration: Pair with the "Portfolio Heat" indicator to customize danger signals based on your current positions, entry points, and stops. This personalized approach ensures that the insights are directly relevant to your trading strategy. Certain signals can have different meanings based on where your trade is at in its lifecycle. Blow off action at the beginning of a trend can be viewed as strength, while after an extended run could signal an opportunity to lock in profits.
Forward-Looking Analysis: Leverage the 'Potential Danger Signals' feature to assess future risks. Enter hypothetical price levels to understand potential market reactions before they unfold, enabling proactive trade management.
The indicator offers two different modes of 'Potential Danger Signals', Worst Case or Immediate. Worst Case allows the user to input any price and see what signals would fire based on price reaching that level, while the Immediate mode looks for potential Danger Signals that could happen on the next bar.
This is achieved by adding and subtracting the average daily range to the current bars close while also forecasting the next values of moving averages, vwaps, risk multiples and the relative strength line to see if a Danger Signal would trigger.
User Customization: Flexibility is at your fingertips with toggle options for each danger signal. Tailor the indicator to match your unique trading style and risk tolerance. No two traders are the same, that is why each signal is able to be turned on or off to match your trading personality.
Versatile Application: Ideal for growth stock traders, momentum swing traders, and adherents of the CANSLIM methodology. Whether you're a novice or a seasoned investor, this tool aligns with strategies influenced by trading giants.
Validation and Utility:
Inspired by the trade management principles of Michael Lamothe, the " Danger Signals " indicator is more than just a tool; it's a reflection of tested strategies that highlight the importance of risk management. Through rigorous validation, including the insights from "The Trading Mindwheel," this indicator helps traders navigate the complexities of the market with an informed, strategic approach.
Whether you're contemplating a new position or evaluating an existing one, the " Danger Signals " indicator is designed to provide the clarity needed to avoid potential pitfalls and capitalize on opportunities with confidence. Embrace a smarter way to trade, where awareness and preparation open the door to success.
Let's dive into each of the components of this indicator.
Volume: Volume refers to the number of shares or contracts traded in a security or an entire market during a given period. It is a measure of the total trading activity and liquidity, indicating the overall interest in a stock or market.
Price Action: the analysis of historical prices to inform trading decisions, without the use of technical indicators. It focuses on the movement of prices to identify patterns, trends, and potential reversal points in the market.
Relative Strength Line: The RS line is a popular tool used to compare the performance of a stock, typically calculated as the ratio of the stock's price to a benchmark index's price. It helps identify outperformers and underperformers relative to the market or a specific sector. The RS value is calculated by dividing the close price of the chosen stock by the close price of the comparative symbol (SPX by default).
Average True Range (ATR): ATR is a market volatility indicator used to show the average range prices swing over a specified period. It is calculated by taking the moving average of the true ranges of a stock for a specific period. The true range for a period is the greatest of the following three values:
The difference between the current high and the current low.
The absolute value of the current high minus the previous close.
The absolute value of the current low minus the previous close.
Average Daily Range (ADR): ADR is a measure used in trading to capture the average range between the high and low prices of an asset over a specified number of past trading days. Unlike the Average True Range (ATR), which accounts for gaps in the price from one day to the next, the Average Daily Range focuses solely on the trading range within each day and averages it out.
Anchored VWAP: AVWAP gives the average price of an asset, weighted by volume, starting from a specific anchor point. This provides traders with a dynamic average price considering both price and volume from a specific start point, offering insights into the market's direction and potential support or resistance levels.
Moving Averages: Moving Averages smooth out price data by creating a constantly updated average price over a specific period of time. It helps traders identify trends by flattening out the fluctuations in price data.
Stochastic: A stochastic oscillator is a momentum indicator used in technical analysis that compares a particular closing price of an asset to a range of its prices over a certain period of time. The theory behind the stochastic oscillator is that in a market trending upwards, prices will tend to close near their high, and in a market trending downwards, prices close near their low.
While each of these components offer unique insights into market behavior, providing sell signals under specific conditions, the power of combining these different signals lies in their ability to confirm each other's signals. This in turn reduces false positives and provides a more reliable basis for trading decisions
These signals can be recognized at any time, however the indicators power is in it's ability to take into account where a trade is in terms of your entry price and stop.
If a trade just started, it hasn’t earned much leeway. Kind of like a new employee that shows up late on the first day of work. It’s less forgivable than say the person who has been there for a while, has done well, is on time, and then one day comes in late.
Contextual Sensitivity:
For instance, a high volume sell-off coupled with a bearish price action pattern significantly strengthens the sell signal. When the price closes below an Anchored VWAP or a critical moving average in this context, it reaffirms the bearish sentiment, suggesting that the momentum is likely to continue downwards.
By considering the relative strength line (RS) alongside volume and price action, the indicator can differentiate between a normal retracement in a strong uptrend and a when a stock starts to become a laggard.
The integration of ATR and ADR provides a dynamic framework that adjusts to the market's volatility. A sudden increase in ATR or a character change detected through comparing short-term and long-term ADR can alert traders to emerging trends or reversals.
The "Danger Signals" indicator exemplifies the power of integrating diverse technical indicators to create a more sophisticated, responsive, and adaptable trading tool. This approach not only amplifies the individual strengths of each indicator but also mitigates their weaknesses.
Portfolio Heat Indicator can be found by clicking on the image below
Danger Signals Included
Price Closes Near Low - Daily Closing Range of 30% or Less
Price Closes Near Weekly Low - Weekly Closing Range of 30% or Less
Price Closes Near Daily Low on Heavy Volume - Daily Closing Range of 30% or Less on Heaviest Volume of the Last 5 Days
Price Closes Near Weekly Low on Heavy Volume - Weekly Closing Range of 30% or Less on Heaviest Volume of the Last 5 Weeks
Price Closes Below Moving Average - Price Closes Below One of 5 Selected Moving Averages
Price Closes Below Swing Low - Price Closes Below Most Recent Swing Low
Price Closes Below 1.5 ATR - Price Closes Below Trailing ATR Stop Based on Highest High of Last 10 Days
Price Closes Below AVWAP - Price Closes Below Selected Anchored VWAP (Anchors include: High of base, Low of base, Highest volume of base, Custom date)
Price Shows Aggressive Selling - Current Bars High is Greater Than Previous Day's High and Closes Near the Lows on Heaviest Volume of the Last 5 Days
Outside Reversal Bar - Price Makes a New High and Closes Near the Lows, Lower Than the Previous Bar's Low
Price Shows Signs of Stalling - Heavy Volume with a Close of Less than 1%
3 Consecutive Days of Lower Lows - 3 Days of Lower Lows
Close Lower than 3 Previous Lows - Close is Less than 3 Previous Lows
Character Change - ADR of Last Shorter Length is Larger than ADR of Longer Length
Fast Stochastic Crosses Below Slow Stochastic - Fast Stochastic Crosses Below Slow Stochastic
Fast & Slow Stochastic Curved Down - Both Stochastic Lines Close Lower than Previous Day for 2 Consecutive Days
Lower Lows & Lower Highs Intraday - Lower High and Lower Low on 30 Minute Timeframe
Moving Average Crossunder - Selected MA Crosses Below Other Selected MA
RS Starts Curving Down - Relative Strength Line Closes Lower than Previous Day for 2 Consecutive Days
RS Turns Negative Short Term - RS Closes Below RS of 7 Days Ago
RS Underperforms Price - Relative Strength Line Not at Highs, While Price Is
Moving Average Begins to Flatten Out - First Day MA Doesn't Close Higher
Price Moves Higher on Lighter Volume - Price Makes a New High on Light Volume and 15 Day Average Volume is Less than 50 Day Average
Price Hits % Target - Price Moves Set % Higher from Entry Price
Price Hits R Multiple - Price hits (Entry - Stop Multiplied by Setting) and Added to Entry
Price Hits Overhead Resistance - Price Crosses a Swing High from a Monthly Timeframe Chart from at Least 1 Year Ago
Price Hits Fib Level - Price Crosses a Fib Extension Drawn From Base High to Low
Price Hits a Psychological Level - Price Crosses a Multiple of 0 or 5
Heavy Volume After Significant Move - Above Average and Heaviest Volume of the Last 5 Days 35 Bars or More from Breakout
Moving Averages Begin to Slope Downward - Moving Averages Fall for 2 Consecutive Days
Blow Off Action - Highest Volume, Largest Spread, Multiple Gaps in a Row 35 Bars or More Post Breakout
Late Buying Frenzy - ANTS 35 Bars or More Post Breakout
Exhaustion Gap - Gap Up 5% or Higher with Price 125% or More Above 200sma

Fibonacci Averages Trend OscillatorOverview:
The Fibonacci Averages Trend Oscillator is a unique technical indicator that leverages Fibonacci numbers to analyze market trends. It calculates the average trend sentiment over periods determined by Fibonacci numbers and smooths the result to create an oscillator.
Key Features:
Uses Fibonacci sequences for trend analysis.
Smooths the trend data to create a clear oscillator.
Offers adjustable oversold and overbought levels for customized analysis.
Inputs:
Max Fib Number: Select the highest Fibonacci number for trend calculation.
Smooth: Adjust the smoothness of the oscillator line.
Using the Oscillator:
A rising oscillator indicates a bullish trend, while a falling oscillator suggests bearish sentiment.
Oversold and overbought levels help identify potential reversal points.
Use the oscillator in conjunction with other indicators for comprehensive market analysis.
Tips for Effective Use:
Adjusting Fibonacci Levels: Experiment with different 'Max Fib Number' settings to find the one that best matches your trading style and the asset's characteristics. Higher Fibonacci numbers consider longer periods, which might be more suitable for long-term trend analysis.
Smoothing Level: The 'Smooth' input helps in reducing noise. A higher smooth level results in a less responsive but smoother line, which can be useful for identifying the overall trend direction.
Interpreting Overbought/Oversold: Watch for the oscillator reaching overbought or oversold levels. These points could signal potential trend reversals or consolidation phases.
Combination with Other Tools: For best results, combine the Fibonacci Averages Trend Oscillator with other technical tools like moving averages, RSI, or MACD to validate the signals and develop a robust trading strategy.
Conclusion:
The Fibonacci Averages Trend Oscillator offers a unique approach to trend analysis by incorporating Fibonacci numbers into its calculation. Its adjustable settings allow for customization to fit various trading styles and market conditions, making it a versatile tool for traders seeking to enhance their technical analysis capabilities.

Volume Profile - BearJust another Volume Profile but you can fit into your chart better by moving back and forth horizontally. also note you can fix the number of bars to show the volume by that way you can use a fib retracment to line up high/low volume nodes with fib levels... see where price as bad structure. or just play with the colors to make a cool gradient?
Volume Profile is a technical analysis tool used by traders to analyze the distribution of trading volume at different price levels within a specified time frame. It helps traders identify key support and resistance levels, potential areas of price reversals, and areas of high trading interest. Here's how to read Volume Profile on a trading chart:
1. **Choose a Time Frame**: Decide on the time frame you want to analyze. Volume Profile can be applied to various time frames, such as daily, hourly, or even minute charts. The choice depends on your trading style and goals.
2. **Plot the Volume Profile**: Once you have your chart open, add the Volume Profile indicator. Most trading platforms offer this tool. It typically appears as a histogram or a series of horizontal bars alongside the price chart.
3. **Identify Key Elements**:
a. **Value Area**: The Value Area represents the price range where the majority of trading volume occurred. It is often divided into three parts: the Point of Control (POC) and the upper and lower value areas. The POC is the price level where the most trading activity occurred and is considered a significant support or resistance level.
b. **High-Volume Nodes**: High-volume nodes are price levels where there was a significant amount of trading volume. These nodes can act as support or resistance levels because they represent areas where many traders had their positions.
c. **Low-Volume Areas**: Conversely, low-volume areas are price levels with little trading activity. These areas may not provide strong support or resistance because they lack significant trader interest.
4. **Interpretation**:
- If the price is trading above the POC and the upper value area, it suggests bullish sentiment, and these levels may act as support.
- If the price is trading below the POC and the lower value area, it suggests bearish sentiment, and these levels may act as resistance.
- High-volume nodes can also act as support or resistance, depending on the price's current position relative to them.
5. **Confirmation**: Volume Profile should be used in conjunction with other technical analysis tools and indicators to confirm trading decisions. Consider using trendlines, moving averages, or other price patterns to validate your trading strategy.
6. **Adjust for Different Time Frames**: Keep in mind that Volume Profile analysis can yield different results on different time frames. For example, a support level on a daily chart may not hold on a shorter time frame due to intraday volatility.
7. **Practice and Experience**: Like any trading tool, reading Volume Profile requires practice and experience. Analyze historical charts, paper trade, and refine your strategies over time to gain proficiency.
8. **Stay Informed**: Stay updated with market news and events that can impact trading volume. Sudden news can change the significance of volume levels.

Apeiron Fair Value Bands ProWHAT IS IT
The Apeiron Fair Value Bands Pro is an indicator that estimates the fair value area of an asset and provides levels of interest and likely reaction. It was created to determine fair value. Knowing fair value allows traders and investors to determine when an asset is at a premium or at a discount, which allows them to make more informed decisions about when to buy or sell. Fair value is constantly changing, and sometimes waiting for it to develop each session or month can lead to missed opportunities. Therefore, it is useful to have an estimate of fair value at all times.
HOW DOES IT WORK?
The simplest way to have a constant estimation of fair value could probably be a Moving Average. By averaging previous prices, we get the average price which ideally reflects where most traders have been interested in participating in the market. This isn’t necessarily the most accurate fair value estimation you can get, however using different types of moving averages and combining them allows for a better estimation of the FV. It is also important to consider that price is always moving away and back into the MA, so in order to determine FV, we must allow an area for price to move within which we can consider the FVA. By taking into account volatility, previous relevant levels and the MA, the Apeiron Bands determine a FVA, where in theory price should stay most of the time.
According to the normal distribution, the price should stay within 1 standard deviation (SD) around 68% of the time and within 2 SD around 95% of the time during range periods (when data is most symmetrical). In the case of the Apeiron Bands, based on backtest data, the price tends to stay within 1 FVA around 75% of the time, within 2 FVA around 90% of the time during strong trends, around 80% and 95% correspondingly during weak trends, and >85% and >95% during ranges.
Additionally, based on backtesting data, pivots occur on average at around 1 FVA ±0.05 (This does not necessarily mean that most pivots occur at 1 FVA, however, the fact the average is 1±0.05 implies there is relevance to this level).
Finally, in order to account for volatility and the slight differences between symbols, a customizable tolerance ribbon is added to the moving average (MA) and each plotted band.
This data remains the same throughout all timeframes and types of market (tested on cryptocurrencies, forex pairs, stocks, indices and futures)
Examples of the time spent within the FVAs:
Examples of average pivot FVA :
HOW TO USE IT?
Identify potential reversal levels at premium and discount prices:
Knowing that price stays within 1 FVA the majority of time and inside 2 FVA most of the time, as well that in average pivots occur around 1 FVA, it can be inferred that both the Bands representing 1 & 2 FVA (B1 & B2) work as potential reversal levels as shown in the examples. This can be very good in confluence with other strategies to spot trade entries. If this is done taking into account if the asset is at a premium or discount allows for a higher probability of being on the right side of the market.
For example, during an uptrend price sometimes goes below it’s MA only to then continue up. In this particular case, the bands would provide an ideal entry at a discount to ride the uptrend.
During ranges, the bands can be used to identify potential pivots for each move up and down, and because of their adaptive nature they can be a great confluence to which horizontal levels are more likely to act as support and resistance.
For intraday traders, the bands can help them identify assets at one of the extremes and potentially even inside one of the bands, indicating that price is likely to reverse from there. Then they can use LTF to find ideal entries or catch the trend with the bands.
For swing traders and investors, using the bands can be a good way to scan different assets to find extended prices to either side and potential entry levels
Identify emerging trends:
Sometimes price will have a minimum reaction to the bands or no reaction at all. Knowing that price spends most of the time inside the bands, the fact that it breaks out of the FVA indicates that a new trend is likely to begin on that particular TF and price will try to establish a new FVA. Once there is a sustained PA outside the bands, a new trend can be assumed (Deviations happen as well, so it is very important to be aware of higher TF as well).
Other times, price will start sliding between B1 and B2, slowly displacing the MA. This can also be an indication for the start of a trend.
Identify exhaustions (potential tops & bottoms):
I call exhaustions to scenarios when price keeps going up/down but it fails to keep pushing the FVA with it. This indicates weakness in the trend and that a new FVA is being established. This often leads to a potential reversal or correction that marks the top or bottom of a move. Not only that, but when the new FVA is established price tends to go and test the other side of the FVA. Identifying exhaustions and being patient for them to form can potentially provide a great entry and RR ratio.
Exhaustions also happen after strong rallies or crashes, and in these cases it is advised to wait for price to re-enter its FVA, providing more clarity and often even better entries.
Exhaustions appear in all timeframes and symbols, however they can take some time to develop and it is important to be patient with them. And as always, it is highly recommended to also check for confluence on different TF.
8H Bands:
4H Bands:
Additional Features:
- Additional Bands:
The Apeiron Fair Value Bands can plot up to 4 Bands. Each fully customizable. The preset and suggested use is to have B1 & B2 and add thinner aid bands B0.5 & B1.5 which represent the middle of 1 & 2 FVA. These are not the main levels of interest but they can prove useful as support and resistance many times. Besides using mid levels, using fib values (0.618 & 1.618) can work even better on some assets and give better reactions.
NATGAS 1H Bands - Fib Mids:
The extra bands can also be used for FVA 3 and FVA 4, which can be useful during extremely volatile periods or on very LTF
- Multi Timeframe & precision:
The bands work on very low TF as well as High TF. Sometimes data can be limited on HTF and the bands will not have enough to be calculated and many LTF are very volatile and don’t work as well. In these scenarios, the bands have a setting called “Precision” under the preferences section that allows the user to decrease or increase the amount of data taken into account. This allows for optimization on any TF and even on any symbol.
GOLD 1min Bands:
EURUSD 5D Bands:
VIX 1H Bands:
- Multi Bands Confluence:
Combining 2 different length FV bands can be very useful to find confluence levels and spot trends and reversals earlier. For example, on the 15 min TF, using a 50 MA with only 1 FVA at the same time as a 200 MA with all Band can be ideal to keep track of short term moves and their micro-trends while always considering the longer trend which might be different that the short term one. As well, having MTF band confluence can indicate that a level is more likely to signal a reversal if reached.
- Multi Timeframe Confluence:
One of the best ways to use the bands is by using it in confluence with itself in other TFs, when price moves sharply into a confluent level given by multiple TFs’ Bands, it is more likely for price to find support and resistance and/or reverse there. Ex. 5 Min B2, 15 Min B1.5 & 30 Min B1, if price reaches this confluent level and shows weakness, this is likely a short term reversal level.
NATGAS MTF Bands:
How to set it up and customize it: (Explain how they are important)
- The MA Lab:
The Apeiron Bands utilizes a MA Lab to generate the most customizable MAs possible. It allows combining up to 3 different MAs, where each MA can be single, double or triple (same process as creating a DEMA or TEMA). As well each MA can be given more or less weight in the calculation of the final MA. Besides it’s features, the MA Lab allows the user to select only one MA and stick to basic settings and MA types if preferred.
When to use the MA Lab:
If you wanted a reactive MA (EMA) which was also volume weighted, you can then combine it with a VWMA and get a VW-EMA.
If you want a more reactive VWMA you can double or triple it. Then in order to make it smoother you combine it with a SMMA. Finally maybe you want to use it to follow trends closely so you also combine it with a HMA to take momentum into consideration.
- Presets:
The multiplier for each band, the width of each tolerance ribbon and the individual colors of each band can all be individually selected. However, to make the user's experience as smooth as possible, FVA multipliers, Ribbon width and colors can be preset and modified all at the same time with the most basic and ideal settings. This allows for quick customization options as well as personalized detailed custom settings.
- Show only Lower or Upper bands:
This setting is meant for scouting for discounts and premiums across the board. By only showing bands on one side it cleans up the chart and makes it easier to spot important levels on only one side of the price. This can be very useful when looking for swing opportunities or when following a particular trend to only focus on potential entries for it.
MATIC 4H Bands showing only bottom bands:
AMZN 1D Bands showing only bottom bands:
Settings used in indicator preview:
- Custom MA: 200 EMA/200 WMA/200 SMMA (200 EWSMMA)
- Band 1: 0.5 - Ribbon Width: 5 - Color: Blue
- Band 2: 1 - Ribbon Width: 10 - Color: Green
- Band 3: 1.5 - Ribbon Width: 5 - Color: Blue
- Band 4: 2 - Ribbon Width: 10 - Color: Red
Disclaimer:
The bands CAN but are NOT meant to be used as a standalone indicator. Previous performance does not guarantee future performance. The bands are an analytical tool, not a signal indicator. While certain scenarios can be interpreted as a signal, never follow them blindly and always use them in confluence with other analysis, systems or indicators.
HTF FVG D/W/M 25%/50%/75% [MK]Do you use HTF FVG (fair value gaps) in your trading strategy? Do you monitor price on the 25%/50%/75% levels within the FVG on a lower timeframe?
This script will allow the user to display either Daily, Weekly or Monthly FVGs on a lower timeframe chart. The script will then also show the 25%/50%/75% levels within the HTF FVG so traders can see how price reacts in the FVG.
For example, a Weekly FVG may be chosen by the trader as a possible reversal point, or somewhere to add to an existing position. The trader might want to see the FVG almost fully filled, then watch price climb up/down out of the Weekly FVG
before taking the trade.
Previously traders would draw the FVG to the chart, then use maybe the tradingview fib tool to display the 25%/50%/75% levels. The problem with this is that its easy to accidently move the fib while dragging the chart around.
Chart below shows example of price almost filling a D FVG, then using the 25%/50%/75% levels as it climbs out of the FVG and reverses to the upside.
Planetary Tunings Moving AveragesThe Pine Script "Planetary Tunings Moving Averages" is a unique tool that plots moving averages (MAs) on a chart, representing the wavelengths of different planets as derived from the book Quadrivium. These wavelengths, also referred to as 'planetary tunings', are related to the orbital resonance of each planet.
Each planetary tuning value is first transformed into a whole number by multiplying it by 1000 and removing the decimal. This whole number is then used as the length parameter for a Simple Moving Average (SMA) function. This function calculates the average of the closing prices over the defined number of periods, thereby creating a moving average line on the chart.
The moving average lines are color-coded according to the planet they represent, allowing for quick and easy interpretation. For example, Mercury's moving average line is blue, Venus's line is orange, and so forth. These colors can be adjusted directly in the Pine Script code if desired.
Additionally, the script computes the mean of all these moving averages and plots it on the chart. This line provides an overall trend line, summarizing the collective behavior of all the planetary tuning moving averages.
The drawings in the chart are fib channels and fib circles that I use to capture liquidity in time.
Please note that this script is written for Pine Script Version 4. It's crucial to ensure your TradingView platform is compatible with this version. For any issues or further clarification, consider referring to TradingView's Pine Script documentation or its community forums.

RSI Exponential Smoothing (Expo)█ Background information
The Relative Strength Index (RSI) and the Exponential Moving Average (EMA) are two popular indicators. Traders use these indicators to understand market trends and predict future price changes. However, traders often wonder which indicator is better: RSI or EMA.
What if these indicators give similar results? To find out, we wanted to study the relationship between RSI and EMA. We focused on a hypothesis: when the RSI goes above 50, it might be similar to the price crossing above a certain length of EMA. Similarly, when the RSI goes below 50, it might be similar to the price crossing below a certain length of EMA.
Our goal was simple: to figure out if there is any connection between RSI and EMA.
Conclusion: Yes, it seems that there is a correlation between RSI and EMA, and this indicator clearly displays that relationship. Read more about the study here:
█ Overview of the indicator
The RSI Exponential Smoothing indicator displays RSI levels with clear overbought and oversold zones, shown as easy-to-understand moving averages, and the RSI 50 line as an EMA. Another excellent feature is the added FIB levels. To activate, open the settings and click on "FIB Bands." These levels act as short-term support and resistance levels which can be used for scalping.
█ Benefits of using this indicator instead of regular RSI
The findings about the Relative Strength Index (RSI) and the Exponential Moving Average (EMA) highlight that both indicators are equally accurate (when it comes to crossings), meaning traders can choose either one without compromising accuracy. This empowers traders to pick the indicator that suits their personal preferences and trading style.
█ How it works
Crossings over/under the value of 50
The EMA line in the indicator acts as the corresponding 50 line in the RSI. When the RSI crosses the value 50 equals when Close crosses the EMA line.
Bouncess from the value 50
In this example, we can see that the EMA line on the chart acts as support/resistance equals when RSI rejects the 50 level.
Overbought and Oversold
The indicator comes with overbought and oversold bands equal when RSI becomes overbought or oversold.
█ How to use
This visual representation helps traders to apply RSI strategies directly on the price chart, potentially making RSI trading easier for traders.
-----------------
Disclaimer
The information contained in my Scripts/Indicators/Ideas/Algos/Systems does not constitute financial advice or a solicitation to buy or sell any securities of any type. I will not accept liability for any loss or damage, including without limitation any loss of profit, which may arise directly or indirectly from the use of or reliance on such information.
All investments involve risk, and the past performance of a security, industry, sector, market, financial product, trading strategy, backtest, or individual's trading does not guarantee future results or returns. Investors are fully responsible for any investment decisions they make. Such decisions should be based solely on an evaluation of their financial circumstances, investment objectives, risk tolerance, and liquidity needs.
My Scripts/Indicators/Ideas/Algos/Systems are only for educational purposes!
