Reversal Entries [akshaykiriti1443]Reversal Entries : An In-Depth Guide
This indicator is designed to identify high-probability trend reversal points. Its primary goal is to pinpoint moments where the price attempts to break a key level, fails, and then snaps back with force. These "fakeouts" or "liquidity grabs" are often powerful signals that the market is about to reverse course.
The indicator provides two clear signals:
* 🟢 **A Bullish "Bounce Point"**: A potential buy signal after price dips below support and recovers.
* 🔴 **A Bearish "Rejection Point"**: A potential sell signal after price spikes above resistance and is pushed back down.
---
## The Core Logic: What Makes a Signal?
The indicator doesn't just look at one factor. Instead, it requires **three key conditions** to be met simultaneously before it generates a signal. This multi-layered approach helps filter out noise and identify only the most promising setups.
### 1. The Price Action "Fakeout" 🕵️♂️
This is the foundation of the signal. The indicator first identifies a short-term support or resistance level.
* **Support:** The lowest price over the `Lookback` period.
* **Resistance:** The highest price over the `Lookback` period.
It then waits for a specific pattern:
* For a **Bullish Bounce**, the current candle's low must dip **below** the support level, but its closing price must be **above** that same support level. This shows that sellers tried to push the price down but buyers stepped in with overwhelming force.
* For a **Bearish Rejection**, the current candle's high must poke **above** the resistance level, but its closing price must be **below** that same resistance level. This shows that buyers tried to break out, but sellers took control and slammed the price back down.
### 2. Volume Confirmation 🔊
A true reversal is almost always accompanied by a surge in trading activity. The indicator confirms the price action by checking for a **volume spike**.
It calculates the recent average volume and only accepts the signal if the volume on the reversal candle is significantly higher than that average (the default is 1.5 times higher). This confirms that there is real conviction and money behind the move, making it much more reliable.
### 3. Recovery Strength & Probability Score 💯
This is the indicator's "secret sauce." It doesn't just see a reversal; it measures *how strong* that reversal is.
* **Measuring the Recovery:** It uses the Average True Range (ATR) to measure the size of the price's recovery. For a bullish bounce, it measures the distance from the candle's low to its close. For a bearish rejection, it measures the distance from the high to the close. A long wick in the direction of the reversal signifies a powerful rejection of lower or higher prices.
* **Calculating a Probability Score:** The indicator takes the volume spike confirmation and the recovery strength and feeds them into a mathematical formula (a sigmoid function) to generate a "probability score" between 0 and 1. Think of this as a confidence score.
* **Applying the Threshold:** A signal is only plotted on your chart if this confidence score is above the `Probability Threshold` (default is 0.7, or 70%). This is the final filter that ensures only high-conviction setups are shown.
---
## How to Use the Indicator in Your Trading
This indicator provides entry signals, but it should be used as part of a complete trading plan.
### Understanding the Signals
* **Green `+` (Bounce Point):** When you see this signal below a candle, it's a potential **BUY entry**. It suggests that the downward momentum has been rejected and the price may be ready to move higher.
* **Red `-` (Rejection Point):** When you see this signal above a candle, it's a potential **SELL entry**. It suggests that the upward momentum has failed and the price may be ready to fall.
### Example Trading Strategy
1. **Entry:** Enter a trade when a signal appears. For a green `+`, place a buy order. For a red `-`, place a sell order.
2. **Stop Loss:** A logical stop loss is crucial.
* For a **buy trade**, place your stop loss just below the low of the signal candle. If the price breaks this low, the reversal idea is invalidated.
* For a **sell trade**, place your stop loss just above the high of the signal candle. If the price breaks this high, the setup has failed.
3. **Take Profit:** Your take profit should be based on your own strategy. A common approach is to target the next significant support or resistance level or use a fixed risk-to-reward ratio (e.g., 1:1.5 or 1:2).
**Important:** Always consider the overall market context. These signals tend to be more powerful when they align with the broader trend or occur at major, higher-timeframe support and resistance zones.
---
## Customizing the Settings
You can fine-tune the indicator's sensitivity in the settings menu to match your trading style and the asset you are trading.
* **`Support/Resistance Lookback`**: Controls how far back the indicator looks to find support and resistance. A **smaller number** makes it more sensitive to very recent price action. A **larger number** will focus on more significant, longer-term levels.
* **`Volume Spike Multiplier`**: Defines what counts as a "spike." Increasing this value (e.g., to 2.0) will demand a much larger volume surge, leading to fewer but potentially more reliable signals.
* **`ATR for Recovery`**: This sets the period for the ATR calculation, which is used to measure the recovery strength. It's generally best to leave this at its default unless you are an advanced user.
* **`Probability Threshold`**: This is the most important sensitivity setting.
* **Increase it** (e.g., to 0.85) for fewer, very high-quality signals.
* **Decrease it** (e.g., to 0.60) to see more potential setups, though some may be less reliable.
"entry" için komut dosyalarını ara

TrendViz - Smart Money ConceptsTrendViz – Smart Money Concepts
See structure, liquidity, and institutional footprints in real time.
Overview
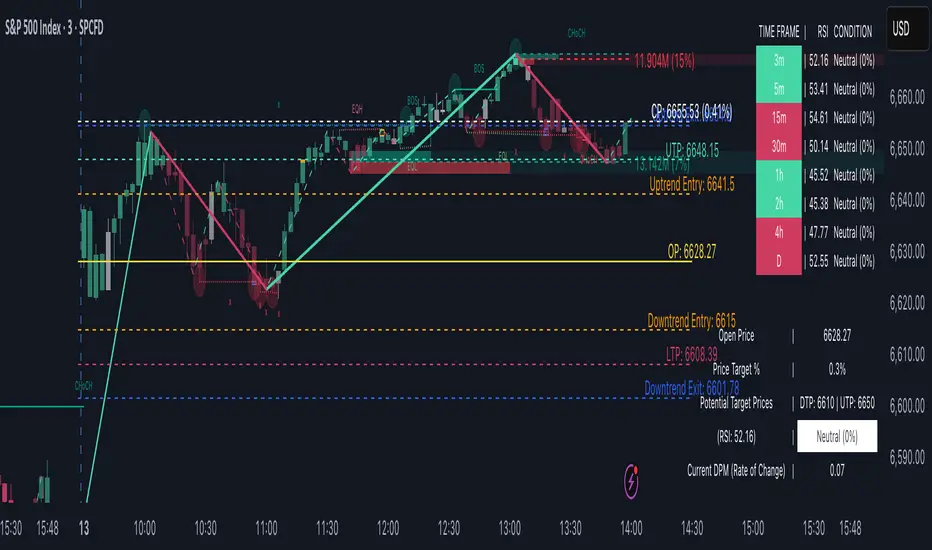
Trend Viz – Smart Money Concepts is a comprehensive SMC toolkit that fuses market-structure (BOS / CHoCH), volumetric order blocks, fair-value gaps (FVG / Breakers), Swing Failure Patterns (SFP), equal highs / lows, and liquidity zones into one clean, on-chart visualization.
It’s designed for intraday precision (0DTE / indices) and swing confluence, with windowed processing for performance on large histories.
Key Capabilities
Market Structure Engine – Detects BOS / CHoCH with adjustable swing length, “Extreme vs Adjusted Points” logic, optional trend-based candle coloring, sweep marks, and labeled lines / bubbles.
Volumetric Order Blocks – Builds bullish / bearish OBs (including breaker blocks), mitigation methods (Close / Wick / Avg), overlap control, mid-line, and activity split (buy vs sell) with per-OB volume metrics.
Fair Value Gaps (FVG & Breakers) – Auto-detects FVGs, mitigations, optional extension, mid-lines, overlap filtering, and raid marking.
Swing Failure Pattern (SFP) – Volume-aware SFPs, directional filters (Trend-Following / Counter-Trade), deviation projections (levels + optional fill).
Equal Highs / Lows & Liquidity Concepts – Marks EQH / EQL across multiple horizons, buyside / sellside zones (area or line), liquidity prints on candles, and sweep zones after BOS / CHoCH.
Performance-First Design – Window size limits structure computations; configurable max objects; overlap suppression reduces clutter.
Inputs & Settings
Market Structure – Window size, Swing limit, Candle coloring, Text size, Algorithmic mode, Swing length, Strong/Weak HL, Sweeps, Bubbles, Mapping.
Volumetric Order Blocks – Show Last N blocks, Breakers, Construction mode, ATR length, Mitigation method, Metrics + Mid-line, Hide Overlap.
Fair Value Gap / Breakers – Enable mode, Show Last N, Threshold, Mid-line + Extension, Hide Overlap, Raid Display.
Swing Failure Pattern (SFP) – Count, Deviation Area, Colors, Filtering mode (Trend / Counter), Volume threshold, Label size.
Liquidity Concepts – Equal H&L scope, Liquidity prints, Buyside/Sellside zones (area or line), Sweep Area threshold.
How to Use It
Quick Start
Add the indicator to your chart → leave defaults.
For 0DTE / intraday use 1 – 5 min timeframes; for swing use 1H – 4H.
Turn on Color Candles to see bullish / bearish bias.
Enable Order Blocks (Show Last 5 – 10) and FVG (3 – 5) with Mitigation = Wick.
Activate SFP with Volume Threshold ≈ 0.5 – 1.0 and Trend-Following filter.
Core Workflows
Trend-Continuation Entry – Wait for CHoCH → BOS alignment → FVG mitigation or OB mid-line retest.
Reversal Entry – Opposing CHoCH + sweep (x) + fresh OB confirmation.
Liquidity Sweep Fade – Raid EQH/EQL + SFP (Counter-Trade) → target prior FVG or opposite OB.
0DTE / Index Checklist
Timeframe 1–5 min · Adjusted Points · mslen = 3–5.
OB Show Last = 5–10 · Mitigation = Wick · Hide Overlap = Recent.
FVG Show = 3–5 · Threshold = 0.1–0.3.
SFP Trend-Following for momentum, Counter-Trade for range.
Trade only after CHoCH → BOS alignment near OB / FVG.
Tips & Behavior
Confirmation / Repainting – Structure anchors confirm after right bars; no repaint once locked.
Performance – Reduce Window size, counts, and overlaps for speed.
Clutter Control – Hide Overlap, limit count, prefer mid-lines over fills.
Mitigation Choice – Wick (strict), Close (lenient), Avg (balanced).
Alerts – Not included by default (visual tool only).
Example Setups
Momentum Pullback – After BOS up, FVG fill + OB reclaim = entry.
Liquidity Sweep Fade – EQH raid + bear SFP = fade to prior FVG.
Breaker Flip – Mitigated OB turns breaker; trade retest.
Disclaimer
This indicator is for educational and analytical purposes only.
Not financial advice. Backtest and apply proper risk management before using live.
Tags
#SmartMoneyConcepts #OrderBlocks #BOS #CHoCH #FVG #Breakers #SFP #Liquidity #EQH #EQL #0DTE #SPX #MarketStructure #TrendViz #TradingView
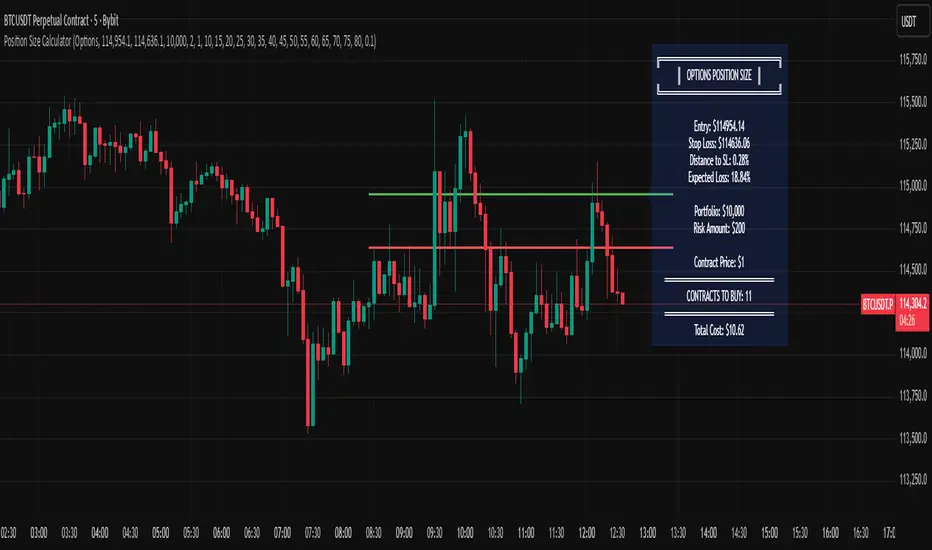
Options Position Size CalculatorOptions Position Size Calculator
Automate your options position sizing directly on the chart.
This indicator calculates the optimal number of options contracts to buy based on your risk management parameters, entry price, stop loss, and expected options decay.
📋 What It Does
Eliminates the need for external calculators by computing your position size directly on TradingView. Simply set your entry and stop loss prices, configure your risk parameters, and the indicator instantly shows you how many contracts to buy.
✨ Key Features
Visual Price Lines: Set entry and stop loss prices with draggable horizontal lines
Custom Loss Table: Input your own options loss percentages for distances from 0.1% to 1.5% (with interpolation between values)
Automatic Calculations: Calculates distance to stop loss, expected options loss, dollar risk, and final contract quantity
Live Display: All calculations shown in a clean info box on your chart
Accounts for Contract Multiplier: Correctly factors in the standard 100x options multiplier
🎯 How to Use
1. Configure Settings First
Add the indicator to your chart (set any initial prices when prompted)
Open indicator Settings (gear icon)
Enter your Portfolio Size (e.g., $10,000)
Set Risk Percentage (e.g., 2%)
Enter the Contract Price (the premium per contract, e.g., $1.50)
2. Fill Your Options Loss Table
This is crucial - you must input your own data
For each distance (0.1%, 0.2%, up to 1.5%), enter the expected % loss your options will suffer
Base this on your strategy (calls/puts), strike selection, and expiration
Use historical data from your trades or an options calculator
Example: If underlying moves 0.5% to your stop, your option might lose 30%
3. Set Entry & Stop Loss on Chart
Go back to indicator settings
Adjust Entry Price and Stop Loss Price to match your trade setup
The indicator calculates your position size instantly
4. Read Results
The indicator displays:
Distance to stop loss (%)
Expected options loss (%)
Dollar risk amount
CONTRACTS TO BUY - your position size
📊 Example
Portfolio: $10,000 | Risk: 2% | Entry: $150 | Stop: $149 (0.67% distance)
Expected loss: 38% | Contract price: $2.00
→ Buy 2 contracts
⚠️ Important
Your loss table values depend on your specific options strategy, strike, DTE, and IV
Different strategies require different loss tables
This is for educational purposes - always verify calculations
Never risk more than you can afford to lose
Made by traders, for traders. Trade safe, size smart.
aEMA Cross - Long EditionaEMA Cross – Long Edition
Smart, Automated, and Rule-Based Trading Framework
Overview:
The aEMA Cross – Long Edition is an advanced automated trading system that intelligently identifies trends, filters weak signals, and manages trades with precision. It integrates EMA crossover logic, breakout candle confirmation, and time-based exits to help traders capture consistent opportunities while minimizing risk and manual intervention.
Designed and developed with algorithmic trading platforms in mind, the indicator can be seamlessly integrated with most Algo platforms through TradingView alerts for automated execution.
Note: The default setup is optimized for the ETHUSD chart.
Core Concept:
The strategy is built around two Exponential Moving Averages (EMAs):
- Short EMA – Responds quickly to short-term market changes.
- Long EMA (default 200) – Represents the overall market trend.
When the Short EMA crosses specific buffer zones around the Long EMA, it confirms genuine momentum before generating Buy or Sell signals. This ensures cleaner and more reliable trade entries.
Key Features:
1. Signal Generation
• Dual logic modes: Candle-based or EMA-based signal detection.
• Breakout Candle System to confirm strong price movements before entries.
• Integrated RSI and ADX filters to ensure trades occur only in favorable market conditions.
2. Smart Trade Management
• Automated Target and Stoploss management.
• Trailing Stop Loss (TSL) dynamically locks in profits as prices move favorably.
• Sequential Signal Logic ensures no repeated or conflicting trade signals.
3. Universal Exit (Time-Based Auto Exit)
• Automatically exits all positions at a specified time (e.g., 23:40).
• Works consistently across all timeframes (1m, 3m, 5m, etc.).
• Can be configured for selected weekdays or every trading day.
• Prevents overnight exposure and resets trading cleanly for the next session.
4. Safety and Control
• EMA buffer zones help avoid false breakouts and choppy market signals.
• Blocks new entries after a Universal Exit until a fresh crossover occurs.
• Automatically resets breakout levels and internal logic daily for consistency.
5. Visualization and Alerts
• Plots EMAs, buffer zones, breakout levels, and entry/exit markers directly on the chart.
• Highlights the Universal Exit visually with background shading.
• Sends real-time alerts for Buy, Sell, Exit, and Universal Exit events.
Why It Stands Out:
• Works reliably across multiple timeframes.
• Fully rule-based with no emotional bias.
• Highly customizable – adjust filters, targets, buffers, and exit rules as needed.
• Complete framework – handles entry, management, and exit automatically.
• Engineered for compatibility – can be integrated with most Algo trading platforms.
How It Works:
1. The Short EMA and Long EMA define the primary market direction.
2. A breakout or EMA crossover triggers a potential signal.
3. RSI and ADX filters confirm market strength before allowing entry.
4. Target, Stoploss, and TSL manage trades automatically.
5. Universal Exit closes all trades at a defined time, resetting the logic for the next session.
How to Use:
1. Apply the aEMA Cross – Long Edition indicator to your chart.
2. Choose your primary logic: Candle-based or Short EMA-based.
3. Adjust RSI, ADX, Buffer, and Target/SL settings according to your trading style.
4. Configure Universal Exit time and alert options.
5. Use the “Once Per Bar Close” alert type for confirmed signals.
6. Always backtest your configuration before enabling automation or live execution.
Important Note on Alert Setup:
- When using the RSI filter, signals may fluctuate if RSI hovers near the trigger level. To avoid this, use “Once Per Bar Close” for stable and confirmed alerts.
- If RSI is disabled, “Once Per Bar” alerts can be safely used, even when the Breakout Candle High/Low Crossover option is enabled.
Disclaimer:
• This strategy is intended for educational and research purposes only.
• It does not guarantee profits. Always perform proper backtesting and apply sound risk management before live trading.
• The author is not responsible for any financial losses resulting from its use.
Developer Information:
Developer: ikunalsingh
Built using AI + the best of human logic.

TTM Squeeze Range Lines (with Forward Extension) By Gautam KumarThis TTM Squeeze Range Lines script helps visualize breakout levels by marking the recent squeeze’s high and low, making it easier to identify potential trade setups. Each signal line is extended for visibility, showing possible entry levels after a squeeze.
Interpreting the LinesLight blue background marks periods when the TTM squeeze is active (tight volatility).
Green line is drawn at the highest price during the squeeze, extended forward—this is commonly used as the breakout level for long entries.
Red line shows the lowest price during the squeeze, indicating the bottom of the range—potential stop loss positioning or an invalidation level.
When the squeeze background disappears, the horizontal lines will have just appeared and extended forward for several bars after the squeeze ends.
If the price breaks above the green line (the squeeze high), it signals a possible momentum breakout, which traders often use as a long entry.
The red line can be used for placing stop losses or monitoring failed breakouts if price falls below this level.
Best Practices
Combine these levels with volume and momentum confirmation for strong entries.
Adjust the extension length (number of bars forward) from the settings menu to fit your preference.
For systematic trading, use these breakout signals alongside chart pattern or histogram confirmation.
This makes it easy to visualize strong entry zones based on the end of squeeze compression, supporting both discretionary and automated swing trading approaches

Breaout and followthroughThis indicator is designed to identify and highlight a single, powerful entry signal at the beginning of a new trend. It filters for high-volatility breakout bars that show strong directional conviction, helping traders catch the initial momentum of a potential move. It will only paint one bullish or bearish signal after a trend change is detected, preventing repeat signals during a sustained move.
Core Concept
The indicator combines four key concepts to generate high-probability signals:
Trend Direction: It first establishes the overall trend (bullish or bearish) using a configurable Exponential or Simple Moving Average (EMA/SMA).
Volatility Expansion: It looks for bars with a larger-than-average range by comparing the bar's size to the Average True Range (ATR). This helps identify moments of increased market interest.
Closing Strength (IBS): It uses the Internal Bar Strength (IBS) to measure directional conviction. A high IBS (closing near the top) suggests bullish strength, while a low IBS (closing near the bottom) suggests bearish pressure.
Breakout Confirmation: As an optional but powerful filter, it can confirm the signal by ensuring the bar is breaking above the high or below the low of a user-defined number of previous bars.
A signal is only generated on the first bar that meets all these criteria after the price crosses the trend-defining moving average, making it ideal for capturing the start of a new swing.
Features
Bullish Signals (Green): Highlights the first bar in an uptrend that is larger than the ATR, closes with a high IBS (>70), and optionally breaks out above the recent highs.
Bearish Signals (Red): Highlights the first bar in a downtrend that is larger than the ATR, closes with a low IBS (<30), and optionally breaks out below the recent lows.
"First Signal Only" Logic: The script is hard-coded to show only the initial signal in a new trend, filtering out noise and redundant signals.
Fully Customizable Trend Filter:
Choose between EMA or SMA for trend definition.
Set the MA length (default is a short-term 7-period MA).
Option to show or hide the moving average on the chart.
Optional Breakout Filter:
Enable or disable the requirement for the signal bar to break the high/low of previous bars.
Customize the lookback period for the breakout confirmation.
How to Use
This indicator can be used as a primary signal for a trend-following or momentum-based trading system.
Look for a Green Bar (Bullish Signal): This suggests the start of a potential uptrend. Consider it a signal for a long entry. A logical stop-loss could be placed below the low of the highlighted signal bar.
Look for a Red Bar (Bearish Signal): This suggests the start of a potential downtrend. Consider it a signal for a short entry. A logical stop-loss could be placed above the high of the highlighted signal bar.
Adjust Settings: Use the settings menu to configure the indicator to your preferred market and timeframe. A longer Trend MA Length will result in fewer, more long-term signals, while a shorter length will be more responsive.
As with any tool, this indicator is best used in conjunction with other forms of analysis, such as market structure, support/resistance levels, and proper risk management.

Bullish Breakout - SBStep 1 – Chart Setup
Timeframe: 5-minute
Studies to add:
VWAP (Session VWAP)
EMA 9 & EMA 20 (trend filter)
Bullish Breakout – Clean v6.1
⚙️ Step 2 – Indicator Settings (scalping mode)
Resistance lookback: 15
Volume confirmation: ON, multiplier = 1.2–1.3 (lighter requirement, more signals).
RSI filter: ON, threshold = 55 (looser than intraday swing).
MACD filter: ON
HTF filter: ON → timeframe = 15m, EMA = 50 (so trades align with short-term trend).
Retest check: ON (safer signals).
ATR stop/targets: ON → ATR length 14, Stop = 1.0×ATR, T1 = 0.7×ATR, T2 = 1.4×ATR.
Visuals: Stealth Mode ON (just arrows + compact label).
🎯 Step 3 – Entry Rules
Wait for a green breakout arrow under a 5m bar.
Confirm conditions:
Price is above VWAP.
EMA 9 > EMA 20 (micro trend bullish).
Optional: RSI > 55 and volume above SMA×1.2.
Enter at close of breakout bar.
Aggressive: enter right on arrow.
Conservative: enter only if teal retest dot confirms.
🛡️ Step 4 – Risk/Exit Plan
Stop loss: red ATR line (~1×ATR below entry).
Target 1 (T1): yellow ATR line (~0.7×ATR above entry).
Target 2 (T2): green ATR line (~1.4×ATR above entry).
Management:
Sell 70% at T1, move stop to entry.
Let 30% run to T2 or trail with EMA 9.
🔔 Step 5 – Alerts
Set TradingView alerts for:
Bullish Breakout (green arrow)
Breakout Retest Confirmed (teal dot)
So you don’t miss quick setups during the session.
⚡ Extra Scalping Tips
Focus on liquid tickers (ORCL, MSFT, AAPL, NVDA, etc.) — tight spreads, good volume.
Trade first 2–3 hours after market open for best volatility.
Avoid scalping right before big news (FOMC, earnings).
Don’t overstay: average 10–30 minutes per trade.

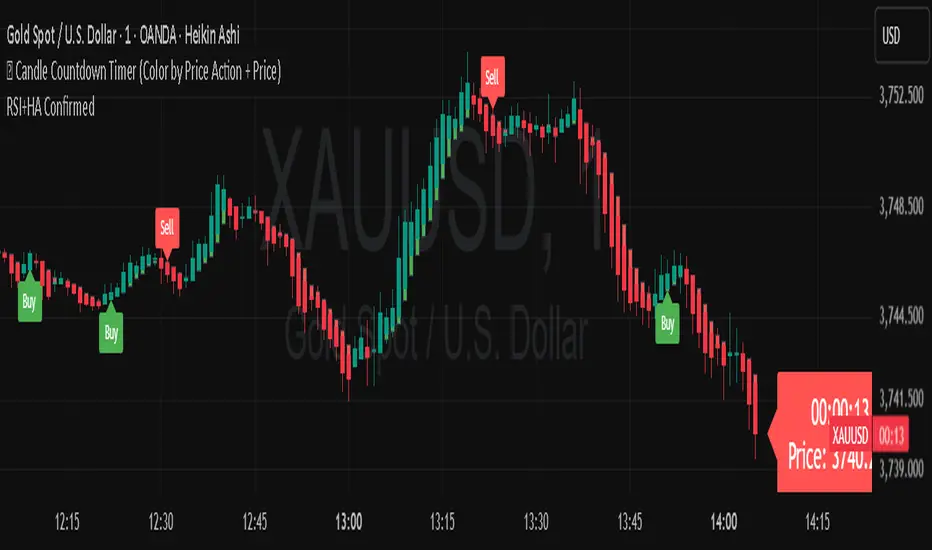
TOP-RSI Double Confirm + Heiken Ashi + Buy/Sell Labels v01📊 RSI Double Confirm + Heiken Ashi + Labels
🔎 Concept
This indicator combines a Zero-based RSI filter with strict candle close confirmation, overlays Heiken Ashi candles for clearer trend visualization, and adds Buy/Sell labels directly on the chart for easier interpretation.
⚙️ Components
1. RSI Double Confirm
RSI is calculated from OHLC4 (open+high+low+close)/4.
The RSI value is shifted by -50 to center it around zero (above 0 = bullish, below 0 = bearish).
Uses user-defined thresholds: Overbought (OB) and Oversold (OS).
📌 Entry conditions:
Buy Signal → RSI crosses upward through OS and the last closed candle is higher than the previous candle.
Sell Signal → RSI crosses downward through OB and the last closed candle is lower than the previous candle.
2. Heiken Ashi Candles
Custom Heiken Ashi values are calculated: haOpen, haClose, haHigh, haLow.
Candles are colored green (if haClose > haOpen) or red (if haClose < haOpen).
Helps smooth price action and highlight trend direction.
3. Alerts
alertcondition is set for both Buy and Sell signals.
Users can create TradingView alerts that trigger whenever a new signal appears.
4. Signals & Labels
A green up arrow is plotted under the candle when a Buy signal is triggered.
A red down arrow is plotted above the candle when a Sell signal is triggered.
Additionally, labels ("Buy" or "Sell") are added at the respective candle to make signals more visible.
📝 How to Use
Add the indicator to your chart (it overlays directly on price).
Adjust inputs:
OB (Overbought) → e.g. 20
OS (Oversold) → e.g. -20
RSI Length → e.g. 7
Watch for signals:
Buy Signal → Green arrow + "Buy" label → potential bullish entry.
Sell Signal → Red arrow + "Sell" label → potential bearish entry.
Set up alerts in TradingView to be notified when new signals appear.
✅ Benefits
Combines RSI confirmation + Heiken Ashi trend filter + Clear chart labels.
Reduces false signals by requiring both RSI cross and strict close confirmation.
Easy to interpret visually with arrows and text labels.
⚠️ Notes
This indicator is meant as a signal confirmation tool, not a standalone strategy.
Best used alongside support/resistance analysis, price action, or volume.
Does not provide automatic stop loss / take profit levels → risk management must be applied by the trader.
Monday's Range Superpowerkyu🔔 Settings
You can customize the colors and toggle ON/OFF in the indicator settings.
Works on daily, hourly, and minute charts.
Easily visualize Monday’s high, low, and mid-line range.
📌 1. Support & Resistance with Monday’s Range
Monday High: Acts as the first resistance of the week.
◽ Example: If price breaks above Monday’s high after Tuesday, it signals potential bullish continuation → long setup.
Monday Low: Acts as the first support of the week.
◽ Example: If price breaks below Monday’s low, it signals bearish continuation → short setup.
📌 2. Mid-Line Trend Confirmation
Monday Mid-Line = average price of Monday.
Price above mid-line → bullish bias.
Price below mid-line → bearish bias.
Use mid-line breaks as entry confirmation for long/short positions.
📌 3. Breakout Strategy
Break of Monday’s High = bullish breakout → long entry.
Break of Monday’s Low = bearish breakout → short entry.
Place stop-loss inside Monday’s range for a conservative approach.
📌 4. False Breakout Strategy
If price breaks Monday’s high/low but then falls back inside Monday’s range, it is a False Breakout.
Strategy: Trade in the opposite direction.
◽ False Breakout at High → short.
◽ False Breakout at Low → long.
Stop-loss at the wick (extreme point) of the failed breakout.
📌 5. Range-Based Scalping
Use Monday’s high and low as a trading range.
Sell near Monday’s High, buy near Monday’s Low, repeat until breakout occurs.
📌 6. Weekly Volatility Forecast
Narrow Monday range → higher chance of strong trend later in the week.
Wide Monday range → lower volatility expected during the week.
📌 7. Pattern & Trend Analysis within Monday Range
Look for candlestick patterns around Monday’s High/Low/Mid-Line.
◽ Example: Double Top near Monday’s High = short setup.
◽ Repeated bounce at Mid-Line = strong long opportunity.
✅ Summary
The Monday’s Range (Superpowerkyu) Indicator helps traders:
Identify weekly support & resistance
Confirm trend direction with Mid-Line
Trade breakouts & false breakouts
Apply range scalping strategies
Forecast weekly volatility
⚡ Especially, the False Breakout strategy is powerful as it captures failed moves and sudden sentiment reversals.

Rejection Zones with FVG ConfirmationOverview
This indicator is designed to identify high-probability Rejection Zones by detecting a specific and powerful price action pattern. The core logic combines the concepts of price rejection , indicated by overlapping wicks, with a Fair Value Gap (FVG) that confirms a strong market imbalance.
These zones are automatically drawn on your chart and can serve as critical levels of potential support (demand) or resistance (supply) for future price movements. The indicator is fully equipped with multi-timeframe (MTF) capabilities, advanced zone management, and customizable alerts to enhance your trading analysis.
Key Features
Dual Timeframe Analysis : Simultaneously displays Rejection Zones from your current timeframe (CTF) and a selected higher timeframe (HTF). HTF zones often represent more significant price levels.
Advanced Zone Management : Zones are dynamically tracked and their status updates as price interacts with them (e.g., Touch, Covered). You can define conditions for when a zone should be considered invalid.
Smart Overlap Handling : Choose how to handle overlapping zones. Either Replace the old zone with the new one or Keep Both to see all areas of interest.
Performance Optimization : Includes an option to Calculate on Visible Range Only, which significantly improves script performance on charts with extensive historical data.
Customizable Alerts : Set up alerts for when a new Rejection Zone is created or when price touches an existing zone, for both CTF and HTF.
Full Visual Customization : Easily customize the colors of Bullish and Bearish zones for both timeframes to match your chart's theme.
How The Logic Works
A Rejection Zone is identified based on a sequence of candlestick patterns:
Bullish Rejection Zone (Potential Demand) :
- Imbalance Confirmation : A bullish Fair Value Gap (FVG) is detected, meaning the high of the candle two bars ago (high ) is lower than the current candle's low (low ).
- Price Rejection : The script then checks if the lower wicks of the two candles preceding the FVG (bar and bar ) overlap. This overlap signifies a concentrated area where price was aggressively rejected.
- Zone Creation : If both conditions are met, a Bullish Rejection Zone is drawn covering the area of the combined rejection wicks.
Bearish Rejection Zone (Potential Supply) :
Imbalance Confirmation: A bearish FVG is detected (the low of bar is higher than the current high ).
Price Rejection: The script checks for overlapping upper wicks on bar and bar .
Zone Creation: A Bearish Rejection Zone is drawn on the area of the combined upper wicks.
How to Use
Identify Key Levels : Use these zones as you would with traditional support/resistance or supply/demand zones. They represent areas where a significant market reaction previously occurred.
Entry Triggers : Look for price to return to a zone and show signs of reaction (e.g., reversal candlestick patterns, shift in market structure on a lower timeframe) before considering an entry.
Higher Timeframe Confluence : Pay close attention to the HTF zones. A reaction from an HTF zone is generally more significant than one from a CTF zone. When a CTF zone forms within an HTF zone, it can signal a very high-probability setup.
Settings Explained
Higher Timeframe
Show : Toggles the visibility of HTF zones.
Timeframe Mapping (e.g., 30Sec:, 1Min:) : Choose which higher timeframe to display based on your current timeframe.
Rejection Zone
Show : Toggles the visibility of all zones.
History : Sets the maximum number of recent zones to display on the chart.
Size Half : If checked, reduces the vertical size of the zone by 50%, drawing it from the wick's midpoint to its tip. This can help pinpoint more precise entry levels.
Invalidation Condition : Defines when a zone should be considered invalid and stop being monitored.
- None : Never invalidates.
- Touch : Invalidates when price touches the zone.
- Left : Invalidates after price touches and then leaves the zone.
- Covered : Invalidates when price moves completely through the zone.
- Passed : Invalidates when price has clearly passed the zone.
Do (for Invalidation) : Action to take when a zone is invalidated. Remove will delete it from the chart; Nothing will just stop tracking it.
Overlap Action :
- Replace : If a new zone overlaps an old one, the old one is removed.
- Keep Both : Allows new and old zones to overlap on the chart.
Color Settings (CTF/HTF) : Full control over the border, background, and center-line colors for Bullish and Bearish zones.
Calculate Range
Calculate on Visible Range Only :
- IMPORTANT : Check this to improve performance. The script will only process visible bars.
- NOTE : Enabling this option will disable all alerts, as alerts require the script to process all historical data.
Alert Rejection Zone
Set your desired alert conditions here. You can enable alerts for zone creation and/or when price touches a zone, for both CTF and HTF separately.
---
Disclaimer: This indicator is for educational and analytical purposes only. It is not financial advice. Always conduct your own research and backtesting before making any trading decisions.
XINIU Risk-Reward Ratio Helper Pro #1.0.0CN:
专业版描述(中文)
本指标是 TradingView 平台上的一款 实用型风险收益管理工具,专为解决交易者在 风险收益评估、资金管理和进出场决策 上的痛点而设计。
交易者常见痛点:
1. 缺乏盈亏比概念 —— 盲目开单,不清楚单笔交易的最大风险与潜在收益。
2. 人工计算低效 —— 依赖计算器手工测算,费时费力,还容易出错。
3. 错失入场时机 —— 在计算过程中往往错过市场的最佳买入/卖出机会。
核心功能:
1. 自动绘制盈亏比目标价 —— 输入止损价格与目标盈亏比,自动生成止盈价格与参考线。
2. 多组盈亏比配置 —— 支持最多 10 组自定义盈亏比,快速对比不同风险收益结构。
3. 一键切换模式 —— 提供「止损为基准」「止盈为基准」「盈亏比价为基准」三种模式,灵活适配不同策略思路。
4. 资金成本与仓位测算 —— 内置保证金与手续费计算公式,直观显示进场所需资金。
5. 可视化盈亏比结构 —— 止损价、止盈价与 1:1 平衡点清晰绘制,避免盲目下单。
6. 关键分歧点提示 —— 标记多空双方可能快速插针的位置,帮助挂单埋伏。
7. 灵活图表渲染 —— 价格线延展、颜色区分与标签标注,让盈亏比一目了然。
核心好处:
1. 科学化决策 —— 清晰掌握风险与收益,避免情绪化操作。
2. 提升执行效率 —— 摆脱手工计算,用最短时间捕捉入场机会。
3. 优化风险管理 —— 自动测算仓位与资金需求,在关键分歧位“以小博大”。
4. 策略灵活性 —— 多组盈亏比与模式切换,满足不同市场环境下的需求。
风险提示:
● 本指标仅提供 参考数据和计算辅助,不能保证交易盈利。
● 市场存在不可预测波动,投资有风险,入市需谨慎。
● 用户应根据自身风险承受能力、资金状况及交易策略独立判断,不得完全依赖指标信号操作。
● 本指标开发者不对因使用本指标而导致的任何损失承担责任。
借助本指标,交易者能在复杂多变的市场中,以更专业、更高效的方式管理风险与收益,同时明确自身风险责任。
EN:
Professional Version Description (English)
This indicator is a practical Risk-Reward Management Tool on the TradingView platform, specifically designed to address traders' pain points in risk-reward evaluation, capital management, and entry/exit decision-making.
Common trader pain points:
1. Lack of risk-reward awareness – Opening trades blindly without understanding the maximum risk or potential reward of each trade.
2. Inefficient manual calculations – Relying on calculators for manual computation, which is time-consuming, error-prone, and cumbersome.
3. Missed entry opportunities – During calculations, traders often miss the optimal buy/sell opportunities in the market.
Core Features:
1. Automatic risk-reward target plotting – Enter a stop-loss price and desired risk-reward ratio, and the indicator automatically calculates take-profit levels and reference lines.
2. Multiple risk-reward configurations – Supports up to 10 custom risk-reward ratios, allowing quick comparison of different risk-reward structures.
3. One-click mode switching – Provides three flexible modes: “Stop-loss as base”, “Take-profit as base”, and “Risk-reward price as base”, adapting to various trading strategies.
4. Capital and position size calculation – Built-in formulas for margin and fee calculation, clearly displaying the required funds for entry.
5. Visualized risk-reward structure – Clearly plots stop-loss, take-profit, and 1:1 balance levels to prevent blind trading.
6. Key divergence point alerts – Marks potential rapid spikes from both bulls and bears, aiding strategic order placement.
7. Flexible chart rendering – Extendable price lines, color coding, and labeled markers make the risk-reward structure instantly clear.
Key Benefits:
1. Data-driven decision-making – Understand risk and potential reward clearly, avoiding emotional trading.
2. Improved execution efficiency – Eliminate manual calculations and quickly capture optimal entry points.
3. Optimized risk management – Automatically calculate position size and capital needs, enabling “small risk, big reward” at key divergence points.
4. Strategy flexibility – Multiple risk-reward configurations and mode switching meet the demands of varying market conditions.
Risk Disclaimer:
● This indicator provides reference data and calculation assistance only and cannot guarantee trading profits.
● Markets are subject to unpredictable fluctuations; all investments carry risk, and trading should be approached with caution.
● Users should make independent judgments based on their own risk tolerance, capital situation, and trading strategy; the indicator should not be relied upon exclusively.
● The developers of this indicator are not responsible for any losses incurred from its use.
With this tool, traders can manage risk and reward more professionally and efficiently in complex and volatile markets while clearly understanding their own risk responsibilities.
Wickless Heikin Ashi B/S [CHE]Wickless Heikin Ashi B/S \
Purpose.
Wickless Heikin Ashi B/S \ is built to surface only the cleanest momentum turns: it prints a Buy (B) when a bullish Heikin-Ashi candle forms with virtually no lower wick, and a Sell (S) when a bearish Heikin-Ashi candle forms with no upper wick. Optional Lock mode turns these into one-shot signals that hold the regime (bull or bear) until the opposite side appears. The tool can also project dashed horizontal lines from each signal’s price level to help you manage entries, stops, and partial take-profits visually.
How it works.
The indicator computes standard Heikin-Ashi values from your chart’s OHLC. A bar qualifies as bullish if its HA close is at or above its HA open; bearish if below. Then the wick on the relevant side is compared to the bar’s HA range. If that wick is smaller than your selected percentage threshold (plus a tiny tick epsilon to avoid rounding noise), the raw condition is considered “wickless.” Only one side can fire; on the rare occasion both raw conditions would overlap, the bar is ignored to prevent false dual triggers. When Lock is enabled, the first valid signal sets the active regime (background shaded light green for bull, light red for bear) and suppresses further same-side triggers until the opposite side appears, which helps reduce overtrading in chop.
Why wickless?
A missing wick on the “wrong” side of a Heikin-Ashi candle is a strong hint of persistent directional pressure. In practice, this filters out hesitation bars and many mid-bar flips. Traders who prefer entering only when momentum is decisive will find wickless bars useful for timing entries within an established bias.
Visuals you get.
When a valid buy appears, a small triangle “B” is plotted below the bar and a green dashed line can extend to the right from the signal’s HA open price. For sells, a triangle “S” above the bar and a red dashed line do the same. These lines act like immediate, price-anchored references for stop placement and profit scaling; you can shift the anchor left by a chosen number of bars if you prefer the line to start a little earlier for visual alignment.
How to trade it
Establish context first.
Pick a timeframe that matches your style: intraday index or crypto traders often use 5–60 minutes; swing traders might prefer 2–4 hours or daily. The tool is agnostic, but the cleanest results occur when the market is already trending or attempting a fresh breakout.
Entry.
When a B prints, the simplest rule is to enter long at or just after bar close. A conservative variation is to require price to take out the high of the signal bar in the next bar(s). For S, invert the logic: enter short on or after close, or only if price breaks the signal bar’s low.
Stop-loss.
Place the stop beyond the opposite extreme of the signal HA bar (for B: under the HA low; for S: above the HA high). If you prefer a static reference, use the dashed line level (signal HA open) or an ATR buffer (e.g., 1.0–1.5× ATR(14)). The goal is to give the trade enough room that normal noise does not immediately knock you out, while staying small enough to keep the risk contained.
Take-profit and management.
Two pragmatic approaches work well:
R-multiple scaling. Define your initial risk (distance from entry to stop). Scale out at 1R, 2R, and let a runner go toward 3R+ if structure holds.
Trailing logic. Trail behind a short moving average (e.g., EMA 20) or progressive swing points. Many traders also exit on the opposite signal when Lock flips, especially on faster timeframes.
Position sizing.
Keep risk per trade modest and consistent (e.g., 0.25–1% of account). The indicator improves timing; it does not replace risk control.
Settings guidance
Max lower wick for Bull (%) / Max upper wick for Bear (%).
These control how strict “wickless” must be. Tighter values (0.3–1.0%) yield fewer but cleaner signals and are great for strong trends or low-noise instruments. Looser values (1.5–3.0%) catch more setups in volatile markets but admit more noise. If you notice too many borderline bars triggering during high-volatility sessions, increase these thresholds slightly.
Lock (one-shot until opposite).
Keep Lock ON when you want one decisive signal per leg, reducing noise and signal clusters. Turn it OFF only if your plan intentionally scales into trends with multiple entries.
Extended lines & anchor offset.
Leave lines ON to maintain a visual memory of the last trigger levels. These often behave like near-term support/resistance. The offset simply lets you start that line one or more bars earlier if you prefer the look; it does not change the math.
Colors.
Use distinct bull/bear line colors you can read easily on your theme. The default lime/red scheme is chosen for clarity.
Practical examples
Momentum continuation (long).
Price is above your baseline (e.g., EMA 200). A B prints with a tight lower wick filter. Enter on close; stop under the signal HA low. Price pushes up in the next bars; you scale at 1R, trail the rest with EMA 20, and finally exit when a distant S appears or your trail is hit.
Breakout confirmation (short).
Following a range, price breaks down and prints an S with no upper wick. Enter short as the bar closes or on a subsequent break of the signal bar’s low. If the next bar immediately rejects and prints a bullish HA bar, your stop above the signal HA high limits damage. Otherwise, ride the move, harvesting partials as the red dashed line remains unviolated.
Alerts and automation
Set alerts to “Once Per Bar Close” for stability.
Bull ONE-SHOT fires when a valid buy prints (and Lock allows it).
Bear ONE-SHOT fires for sells analogously.
With Lock enabled, you avoid multiple pings in the same direction during a single leg—useful for webhooks or mobile notifications.
Reliability and limitations
The script calculates from completed bars and does not use higher-timeframe look-ahead or repainting tricks. Heikin-Ashi smoothing can lag turns slightly, which is expected and part of the design. In narrow ranges or whipsaw conditions, signals naturally thin out; if you must trade ranges, either tighten the wick filters and keep Lock ON, or add a trend/volatility filter (e.g., trade B only above EMA 200; S only below). Remember: this is an indicator, not a strategy. If you want exact statistics, port the triggers into a strategy and backtest with your chosen entry, stop, and exit rules.
Final notes
Wickless Heikin Ashi B/S \ is a precision timing tool: it waits for decisive, wickless HA bars, provides optional regime locking to reduce noise, and leaves clear price anchors on your chart for disciplined management. Use it with a simple framework—trend bias, fixed risk, and a straightforward exit plan—and it will keep your execution consistent without cluttering the screen or your decision-making.
Disclaimer: This indicator is for educational use and trade assistance only. It is not financial advice. You alone are responsible for your risk and results.
Enhance your trading precision and confidence with Wickless Heikin Ashi B/S ! 🚀
Happy trading
Chervolino

Gabriel's Triple Impulsive Candle DetectorTriple Impulsive Candle Detector
Overview, critical for catching impulse moves in either direction.
SPX Income System is a rule-based framework designed to identify frequent, high-probability income opportunities on the S&P 500 cash index (SPX/SPY) using 0-DTE credit spreads. The core engine operates on 30-minute Impulse bars during the morning trade window and can be extended with optional modules for afternoon, overnight, and weekly swing opportunities. The methodology centers on a single, mechanical price event called a Impulse Bar (small wick to body ratio) to minimize discretion and keep execution consistent.
🔶What’s Inside
Core Strategy: SPX Daily Income
Timeframe: 3 kinds of 30-min bars.
Window: 09:30–11:30 ET (new setups only)
Instrument: SPX (cash index, XSP/SPY), executed with $5-wide credit spreads on 0-DTE SPX options
Bullish Setup
Entry on the break of setup bar high
Use an at the money put credit spread
Bearish Setup
Entry on the break of setup bar low
Use an at the money call credit spread
Intent: Enter shortly after setup; manage to >80% max profit or EOD expiration if SPX. If it's another stock, then a 1.5~2x D ATR is suggested.
Signal: An Impulse Bar that closes at/near the high (bullish) or low (bearish) of its 30-min range, verified with Volume above average.
Risk—limited to the risk of the option spread.
The spread is 5 dollars wide
The premium collected is $2.50
$5 - 2.50 = $2.50, or the breakeven point.
Which means what's left is the risk involved.
The risk is $2.50 per spread
🔶Why the 30-Minute Chart?
The 30-minute bar is the “chart of choice” because it filters noise and aligns with morning institutional flows.
On alternate timeframes, price often retraces half the candle body before following through.
On the 30m: the follow-through is more consistent, especially with 2x volume confirmation.
Adding support/resistance levels at the impulse bar hl2 strengthens execution.
This strategy has roots in MTF Crypto, and SPX/SPY TPO-Order Block logic.
🔶Bonus Examples:
🔹Afternoon SPX Income
Second chance window (typically 14:00–15:00 ET) if the morning trade has exited, 60-min bars instead.
🔹ORB 30 – Opening Range Break (first 30 min)
Classic ORB with an income twist for early action when time is limited. This can be entered on the 15 minute candle break.
🔹ORB 60 – Opening Range Break (second 30 min)
A follow-up ORB variant for traders who miss the first window, verified on a 60-min chart. Enter on the final 3 minutes of the hourly candle or wait for a pullback.
🔹B&B – Bed & Breakfast (Overnight)
Identifies income setups via the 10-minute chart in the last 30–60 minutes of the session with next-day open as the exit.
🔹JB – Just Breakfast
Uses the prior day’s end-of-day setup to enter at the opening bell, then manages into the daily income flow. I trade 0-date, and selling an ITM spread either partially or fully then gives me a head start on the daily income potential. This may work better if you either roll or the ORB 30 also meets the criteria.
🔹All-Day-Scalper
Converts income logic into 30-minute scalps using deep 75/80 delta ITM options as synthetic stock (requires >PDT). Meaning that the option will behave as if it is stock. This strategy comes with a warning: it's better if you can day trade.
🔹Tag ’n Turn—Weekly SPX Income Swing
Weekly swing overlay using 30-min Pulse Bars + Bollinger Bands (50) for 3–7 day swings and as a filter for daily income alignment. I use the TTM Squeeze and obtain similar results. Target heuristics (directional days) with a fired squeeze.
Part of my Gamma Scalping System.
🔶The Impulse Bar (10~40% Wick to Body Bar)
An Impulse Bar is a candle that:
Bullish: Closes higher than it opens and within the top ~10% of its high-low range.
Bearish: Closes lower than it opens and within the bottom ~10% of its high-low range.
Practical tip: Many traders mark 0-10-80-100% levels on the candle range (custom Fib or ruler) to quickly validate Pulse Bars. If it's accompanied by a volume spike, then it's better quality.
🔶SPX Daily Income—Rules & Execution
🔹Rules
Chart: 30 min, no indicators required. Pure PA, TPO-based strategy.
New Setups: 09:30–11:30 ET
Instrument: SPX signals, executed via SPX 0-DTE credit spreads ($5 wide, $2 for SPY)
🔹Entries
Bullish: Enter on a break of the setup bar high, use ATM put credit spread
Bearish: Enter on a break of the setup bar low, use ATM call credit spread
🔹Exits
Primary: Close at >80% of max profit (credit received)
Alternate: Hold to EOD expiration
Stop: Risk of the spread (defined by width – credit)
Target Heuristics (directional days)
Optional: 1.5–2× ATR as a reference (mirrors directional follow-through that often accelerates the >80% outcome)
Credit Guidance (typical)
OTM short strike ≈ $2.40
ITM short strike ≈ $2.50–$2.80
2× ITM short strike ≈ $2.80–$3.00
Trade Management (PDT-Aware)
If under PDT, many prefer set-and-forget with GTC buy-back (e.g., $0.20) or EOD expiration.
1:00 PM ET time check
Trending day ±$15–$20 SPX: usually no action, run to expiration
Non-trending day ±$5 SPX: consider taking 40–60% if available (optional) to avoid 50/50 end-of-day decay dynamics
Rationale: Without a favorable trend by ~1 PM, the odds of a late push decline; choosing a controlled partial outcome can improve long-run expectancy and reduce variance.
🔶Examples (Conceptual)
🔹Bullish: A green dot marks a bullish impulse bar; minor follow-through pushes the spread to >80% quickly.
🔹Bearish: A red triangle marks a bearish Impulse Bar; a modest down move is often sufficient for >80–95%.
🔹Tag ’n Turn—Weekly Swing (Filter & Stand-Alone)
Chart: 30-minute
Overlay: Bollinger Bands 50 (mean-reversion lens), or KC or TTM.
Setup: Tag of upper/lower band + Pulse Bar, enter on break of Pulse Bar in that direction
Target: Opposite Bollinger Band
Use Case: 3–7 day swings and a directional filter for Daily Income signals (trade with weekly bias)
🔹Afternoon SPX Income: Same Pulse logic, 14:00–15:00 ET window.
🔹ORB 30 / ORB 60: Uses 30/60-min opening range; can relax Pulse threshold (up to 40% bars) for early positioning when time-constrained.
🔹B&B (Overnight): Lasts 30–60 minutes; closes the next day at open or after the first 30-minute bar.
🔹JB (Just Breakfast): Enter at open using prior day’s signal; optionally roll into Daily Income if eligible.
🔹All-Day-Scalper: Deep ITM options (~0.75–0.80 delta) as synthetic stock.
Entry: Long ITM option
Stop: ~40% of option price
Target: 70–150% or 30-minute timed exit
Note: Time-intensive; for accounts above PDT.
🔹Brokerage: Must efficiently support SPX options; a <10% spread between OI and Volume is ideal. Preferences vary; Tastytrade, Thinkorswim, and Interactive Brokers are common choices. Use what’s reliable, available in your region, and cost-effective.
🔶Alerts (Check-in)
Bullish Impulse Detected (within 09:30–11:30 ET)
Bearish Impulse Detected (within 09:30–11:30 ET)
Afternoon Pulse (14:00–15:00 ET)
ORB 30/60 Trigger
B&B Window Open (last 60 mins)
JB at Open
Tag ’n Turn: Band Tag + Impulse (Bull/Bear)
🔶Inputs (Typical)
Session windows (morning, afternoon, last hour) ~5~15 Average Bar
Impulse threshold (strict 10% vs relaxed up to 40% for ORB variants)
Marker/label styles (bull/bear colors, dots vs arrows)
Filters (optional ATR TP, band touch BB(50-SMA, 2 Stdv.) for Tag ’n Turn)
Alert toggles (on-close for webhooks)
🔶Best Practices
One playbook, many Doors: Start with daily income; add afternoon or B&B/JB only after you’re consistent.
Credit discipline: Don’t chase poor pricing; stick to the credit guidance.
Time awareness: If no trend by ~1 PM ET, consider variance control.
Weekly bias: When using Tag ’n Turn, align daily trades with the weekly swing direction for added confluence.
Risk is defined as width – credit = max risk per spread. Size, accordingly, 1~2%.
🔶Disclosures & Risk
This is not financial advice. Options involve risk and are not suitable for all investors. Past performance (including backtests or theoretical studies) does not guarantee future results. Slippage, fills, assignment risk, and latency can materially impact outcomes. Trade a plan you fully understand and always size for durability. On the Daily, the Impulse bars, are often a signal that you should plan for it to return back to half of the Candle's body, and plan accordingly. Plot a horizontal support/resistance level and see how price reacts to it. Keep house-money, and use 1~2% Risk, reduce exposure when VIX is low and increase it when VIX is high.
TL;DR (Summary)
Signal: 30-min Pulse Bar (strict 10% close in range)
Window: 09:30–11:30 ET (new setups)
Execution: 0-DTE $5-wide SPX credit spreads
Exit: >80% max profit or EOD
Add-ons: Afternoon, ORB 30/60, B&B/JB overnights, All-Day-Scalper, Tag ’n Turn weekly swing/filter
Philosophy: Fully rule-based, minimal discretion, production-line consistency 0-date.

Bias + VWAP Pullback — v4 (PA + BOS/CHOCH)Simple idea: I identify the trend (bias) from the larger timeframe, and only trade pullbacks to the VWAP/EMA during liquidity (London/New York). When the trend is clear, gold moves strongly, and its pullbacks to the balance lines provide clear opportunities.
Timeframe and Sessions (Cairo Time)
Analysis: H1 to determine the trend.
Implementation: 5m (or 1m if professional).
Trading window:
London Opening: 10:00–12:30
New York Opening: 16:30–19:00
(avoid the rest of the day unless there is exceptional traffic).
Direction determination (BIAS)
On H1:
If the price is above the 200 EMA and the daily VWAP is bullish and the price is above it → uptrend (long-only).
If the price is below the 200 EMA and the daily VWAP is bearish and the price is below it → bearish trend (short-only).
Determine your levels: yesterday's high/low (PDH/PDL) + approximate Asia range (03:00–09:30).
Entry Rules (Setup A: Trend Continuation)
Asia range breakout towards Bias during liquidity window.
Wait for a withdrawal to:
Daily VWAP, or
EMA50 on 5m frame (best if both cross).
Confirmation: Confirmation low/high on 5m (HL buy/LH sell) + clear impulse candle (Body is greater than average of last 10 candles).
Entry:
Buy: When the price returns above VWAP/EMA50 with a confirmation candle close.
Sell: The exact opposite.
Stop Loss (SL): Below/above the last confirmation low/high or ATR(14, 5m) x 1.5 (largest).
Objectives:
TP1 = 1R (Close 50% and move the rest Break-even).
TP2 = 2.5R to 3R or at an important HTF level (PDH/PDL/Bid/Demand Zone).
Entry Rules (Setup B: Reversion to VWAP – “Mean Reversion”)
Use with extreme caution, once daily maximum:
Price deviation from VWAP by more than ~1.5 x ATR(14, 5m) with rejection candles appearing near PDH/PDL.
Reverse entry towards the return of VWAP.
SL small behind rejection top/bottom.
Main target: VWAP. (Don't get greedy — this scenario is for extended periods only.)
News Filtering and Risk Management
Avoid trading 15–30 minutes before/after strong US news (CPI, NFP, FOMC).
Maximum daily loss: 1.5–2% of account balance.
Risk per trade: 0.25–0.5% (if you are learning) or 0.5–1% (if you are experienced).
Do not exceed two consecutive losing trades per day.
Don't chase the market after the opportunity has passed — wait for the next pullback.
Smart Deal Management
After TP1: Move stop to entry point + trail the rest with EMA20 on 5m or ATR Trailing = ATR(14)×1.0.
If the price touches a strong daily level (PDH/PDL) and fails to break, consider taking additional profit.
If VWAP starts to flatten and breaks against the trend on H1, stop trading for the day.
Quick Checklist (Before Entry)
H1 trend is clear and consistent with 200EMA + VWAP.
Penetrating the Asia range towards Bias.
Clean pull to VWAP/EMA50 on 5m.
Confirmation candle and real push.
SL is logical (behind swing/ATR×1.5) and R :R ≥ 1:2.
No red news coming soon.
Example of "ready-made" settings
EMA: 20, 50, 200 on 5m, 200 only on H1.
VWAP: Daily (reset daily).
ATR: 14 on 5m.
Levels: PDH/PDL + Asia Band (03:00–09:30 Cairo).
Gold Notes
Gold is fast and sharp at the open; don't get in early — wait for the draw.
Fakeouts are common before news: it is best to call with the trend after the price returns above/below VWAP.
Don't expect 80% consistent wins every day — the advantage comes from discipline, filtering out bad days, and only withdrawing when you're on the right track.
تعتبر شركة الماسة الألمانية أحد المؤسسات العاملة بالمملكة العربية السعودية ولها تاريخ طويل من الخدمات الكثيرة والمتنوعة التى مازالت تقدمها للكثير من العملاء داخل جميع مدن وأحياء المملكة حيث نقدم أفضل ما لدينا من خلال مجموعة الشركات التالية والتي من خلالها ستتلقي كل ما تحتاج إلية في كل المجال المختلفة فنحن نعمل منذ عام 2015 ولنا سابقات اعمال فى مختلف المجالات الحيوية التى نخدم من خلالها عملائنا ونوفر لهم أرخص الأسعار وبأعلى جودة من الممكن توفرها فى المجالات التالية :-
خدمات تنظيف المنازل والفلل والشقق
خدمات عزل الخزانات تنظيف غسيل صيانة اصلاح
خدمات جلي البلاط والرخام والسيراميك
خدمات نقل العفش عمالة فلبينية مدربة
خدمات مكافحة الحشرات بجدة
كل هذة الخدمات وأكثر نوفرها لكل المتعاقدين بأفضل الطرق مع توفير خطط وبرامج متنوعة لأتمام العمل المسنود إلينا بأفضل وأحدث الطرق الحديثة والعصرية سواء فى شركات النظافة بجدة ومكة المكرمة أو شركات نقل العفش بجدة عمالة فلبينية وباقى الخدمات مثل جلي وتلميع الرخام بمكة وجدة ولا ننسي شركة مكافحة حشرات بجدة التى ساعدت آلاف المواطنين على تنظيف منازلهم من الحشرات بأفضل مبيدات حشرية.

Triple-EMA Cloud (3× configurable EMAs + timeframe + fill)About This Script
Name: Triple-EMA Cloud (3× configurable EMAs + timeframe + fill)
What it does:
The script plots three Exponential Moving Averages (EMAs) on your chart.
You can set each EMA’s length (how many bars or days it averages over), source (for example, closing price, opening price, or the midpoint of high + low), and timeframe (you can have one EMA use daily data, another hourly data, etc.).
The indicator draws a “cloud” or channel by shading the area between the outermost two EMAs of the three. This lets you see a band or zone that the price is moving in, defined by those EMAs.
You also get full control over how each of the three EMA‐lines looks: color, thickness, transparency, and plot style (solid line, steps, circles, etc.).
How to Use It (for Beginners)
Here’s how a trader who’s new to charts can use this tool, especially when looking for pullbacks or undercut price action.
Key Concepts
Trend: Imagine the market price is generally going up or down. EMAs are a way to smooth out price movements so you can see the trend more clearly.
Pullback: When a price has been going up (an uptrend), sometimes it dips down a little before going up again. That dip is the pullback. It’s a chance to enter or add to a position at a “better price.”
Undercut: This is when price drops below an important level (for example an EMA) and then comes back up. It looks like it broke below, but then it recovers. That may show reverse pressure or strength building.
How the Script Helps With Pullbacks & Undercuts
Marking Trend Zones with the Cloud
The cloud between the outer EMA lines gives you a zone of expected support/resistance. If the price is above the cloud, that zone can act like a “floor” in uptrends; if it is below, the cloud might act like a “ceiling” in downtrends.
Watching Price vs the EMAs
If the price pulls back toward the cloud (or toward one of the EMAs) and then bounces back up, that’s a signal that the uptrend might continue.
If the price undercuts (goes a bit below) one of the EMAs or the cloud and then returns above it, that can also be a signal. It suggests that even though there was a temporary drop, buyers stepped in.
Using the Three EMAs for Confirmation
Because the script uses three EMAs, you can see how tightly or loosely they are spaced.
If all three EMAs are broadly aligned (for example, in an uptrend: shorter length above longer length, each pulling from reliable price source), that gives more confidence in trend strength.
If the middle EMA (or different source/timeframe) is holding up as support while others are above, it strengthens signal.
Entry & Exit Points
Entry: For example, after a pullback toward the cloud or “mid‐EMA”, wait for price to show a bounce up. That could be a better entry than buying at the top.
Stop Loss / Risk: You might place a stop loss just below the cloud or the lowest of your selected EMAs so that if price breaks through, the idea is invalidated.
Profit Target: Could be a recent high, resistance level, or a fixed reward-risk multiple (for example aiming to make twice what you risked).
Practical Steps for New Traders
Set up the EMAs
Choose simple lengths like 10, 21, 50.
For example, EMA #1 = length 10, source Close, timeframe “current chart”; EMA #2 = length 21, source (H+L)/2; EMA #3 = length 50, maybe timeframe daily.
Observe the Price Action
When price moves up, then dips, see if it comes back near the shaded cloud or one of the EMAs.
See if the dip touches the EMAs lightly (not a big drop) and then price starts climbing again.
Look for undercuts
If price briefly goes below a line (or below cloud) and then closes back above, that’s undercut + recovery. That bounce back is often meaningful.
Manage risk
Only put in money you can afford to lose.
Use small position size until you get comfortable.
Use stop-loss (as mentioned) in case the price doesn’t bounce as expected.
Practice
Put this indicator on charts (stocks you follow) in past time periods. See how price behaved with pullbacks / undercuts relative to the EMAs & cloud. This helps you learn to see signals.
What It Doesn’t Do (and What to Be Careful Of)
It doesn’t predict the future — it simply shows zones and trends. Price can still break down through the cloud.
In a “choppy” market (i.e. when price is going up and down without a clear trend), signals from EMAs / clouds are less reliable. You’ll get more “false bounces.”
Under / overshoots & big news events can break through clean levels, so always watch for confirmation (volume, price behavior) before putting big money in.

ATR Take Profit (T-Maker)A dead-simple take-profit helper based on ATR.
This script calculates a 14-period Average True Range (ATR) and multiplies it by a user-defined factor, then shows that single number on your chart in a small table (bottom-left). Use it as a quick, volatility-aware distance for setting take-profit levels, scaling out, or gauging whether a move has “room” to breathe.
What it does
Computes ATR(14) × Multiplier every bar.
Displays the result (rounded to 2 decimals) in a clean on-chart label.
Updates only on the last bar to avoid visual noise and keep performance snappy.
Why it’s useful
Volatility-adjusted targets: ATR adapts to changing market conditions, so your TP distance scales with current volatility.
Instrument & timeframe agnostic: Works on any symbol and timeframe supported by TradingView.
Minimalist workflow: No lines or clutter—just the exact distance to add/subtract from your entry.
How to use it
Choose your ATR Multiplier (default = 4).
Example: If ATR(14) = 1.52 and Multiplier = 4 → displayed value = 6.08.
For a long, a simple TP idea is: TP = Entry + xATR.
For a short: TP = Entry − xATR.
Optionally draw a manual horizontal line at your calculated TP level, or use the value to feed your own rules in other scripts.
Tip: Test different multipliers per market/timeframe (e.g., 2–3 for intraday indices, 3–5 for swing on FX/crypto). Optimize in backtests before going live.
Inputs
ATR Multiplier (int): Scales ATR(14) to your preferred TP distance.
Text Color (color): Customize the display color to match your theme.
Notes & Limitations
Uses ATR(14) (fixed) for consistency in this original version.
Displays a single number only—it does not plot levels, draw lines, or place orders.
Value is rounded to 2 decimals and shown bottom-left of the chart.
Version
v1.0 — Original release (minimal, display-only utility)
Created by T-Maker. This tool is for educational purposes only and is not financial advice. Always manage risk and verify settings before trading.