Triple EMA Scalper low lag stratHi all,
This strategy is based on the Amazing scalper for majors with risk management by SoftKill21
The change is in lines 11-20 where the sma's are replaced with Triple ema's to
lower the lag.
The original author is SoftKill21. His explanation is repeated below:
Best suited for 1M time frame and majors currency pairs.
Note that I tried it at 3M time frame.
Its made of :
Ema ( exponential moving average ) , long period 25
Ema ( exponential moving average ) Predictive, long period 50,
Ema ( exponential moving average ) Predictive, long period 100
Risk management , risking % of equity per trade using stop loss and take profits levels.
Long Entry:
When the Ema 25 cross up through the 50 Ema and 100 EMA . and we are in london or new york session( very important the session, imagine if we have only american or european currencies, its best to test it)
Short Entry:
When the Ema 25 cross down through the 50 Ema and 100 EMA , and we are in london or new york session( very important the session, imagine if we have only american or european currencies, its best to test it)
Exit:
TargetPrice: 5-10 pips
Stop loss: 9-12 pips
"entry" için komut dosyalarını ara

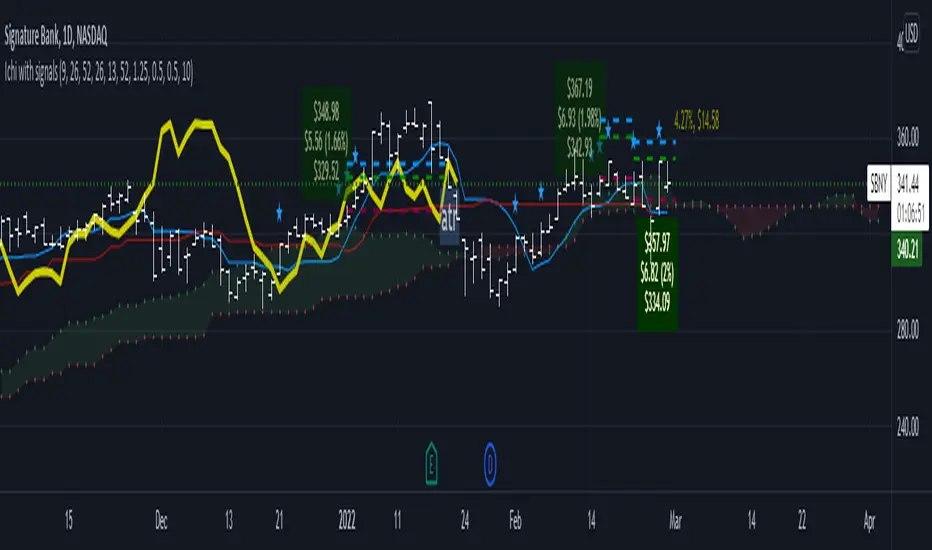
Ichimoku Cloud LONG and SHORT indicatorsThis simple script uses 4 rules from Ichimoku Cloud indicator to marks position entry points.
The idea is that by entering a long position just when these 4 criteria are met, you can capture a 2-3% plus move within the next few days:
1. The conversion line is above the base line
2. The price is above the clouds
3. The lagging span is above the clouds
4. The rightmost cloud is green
The same 4 criteria but inverted will indicate a short entry.
In order to avoid 'stale' entries which can lead to chasing, we want the price and conversion line crossovers to be recent, within the past few days. Ideally we want to enter before close on the day the entry signal is given so that we can capture any potential gap up (or down if short). Often the price will make a nice move the next day or day after. If any of the criteria become invalidated, or if after 4-5 days there hasn't been significant movement, then it was a false alarm.
This script will show the basic Ichimoku Cloud indicators, plus labels for bearish and bullish price and conversion line crossovers as well as LONG and SHOT indicators to show when the entry criteria have been met.
Amazing scalper for majors with risk managementHello,
Today I am glad to bring you an amazing simple and efficient scalper strategy.
Best suited for 1M time frame and majors currency pairs.
Its made of :
Ema (exponential moving average) , long period 25
Ema(exponential moving average) Predictive, long period 50,
Ema(exponential moving average) Predictive, long period 100
Risk management , risking % of equity per trade using stop loss and take profits levels.
Long Entry:
When the Ema 25 cross up through the 50 Ema and 100 EMA. and we are in london or new york session( very important the session, imagine if we have only american or european currencies, its best to test it)
Short Entry:
When the Ema 25 cross down through the 50 Ema and 100 EMA, and we are in london or new york session( very important the session, imagine if we have only american or european currencies, its best to test it)
Exit:
TargetPrice: 5-10 pips
Stop loss: 9-12 pips
Hope you enjoy it :)

Percent Calculator OverlayFirst and foremost: I'm inspired to publish my scripts by the other member's who publish quality, detailed scripts -a token of my appreciation and support, Thank You.
The percent calculator overlay is an extension of my Percent Calculator indicator that allows one to visualize the percent metrics they're interested in trading: it''s function is to simply output the target price from either the close or ones trade-entry based on a desired percent return on investment (R.O.I.) then plots it on top of the chart as an area plot and notes anytime in the past the desired conditions were met with a {flag "Success"}.
Say you want to profit 15% from your entry: open the settings and plug in your entry value and the number 15 into the appropriate settings and the indicator displays what the target price should be (rounded to two decimal places) right on the chart with the area as well as the horizontal line which is enabled by the "track price" setting.
The percent calculator overlay also goes one step further by finding the average percent return on investment over a desired interval of time (the default is 20 candles) as well as allows one to adjust the size of the price move the average percent return on investment is being calculated for which is displayed on the chart as circles and also displays a horizontal line for the most current value with the enabled "track price" setting.
NOTE: unlike the Percent Calculator the Percent Calculator Overlay creates a visual record of the number of success' the programmed parameters have achieved (based on the closing prices) which self adjusts when the "size of the move" is changed.
Say you want to find the average percent return on investment for a 3 candle swing over a 200 candle interval of time: open the settings and plug the number 200 into the interval setting and the number 3 into the price-move setting and the indicator displays what the average 3 candle swing returns on investment and plots what the target price would be to achieve the average return given the current close (or entry price) with the gray circles and the horizontal line enabled with the "track price" setting.
Practical Application: comparing ones desired return on investment to the average return on investment can help determine how realistic ones goals are... it's unlikely to achieve 100% return on investment if the average is only around 10% (given the parameters one is working within) but on the other hand achieving 5% return on investment is highly likely. By visualizing roughly how often the given parameters have achieved success on the chart one can become a lot more comfortable, confident, and accurate with their goals.
Forward Looking Statement: I believe in the not too distant future plug and play automated trading systems will be made available to the general public. Over the past 4 years we have seen brokers offer free charting software, commission free trading, and now fractional shares; I don't think it will be much longer before we can simply click a few buttons and tell the computer to enter when the stochastic is overbought/sold and exit with a predefined percent gain (and to repeat that process indefinitely). -Imagine the data moving 2-3-4 times a second, the liquidity flowing like Niagara falls, and 95% of the working population not only starting to invest but gains the extra cash flow they desperately need.
Beta testing: please comment or send me a message if you happen to stumble over any bugs or have any suggestions for improvement.

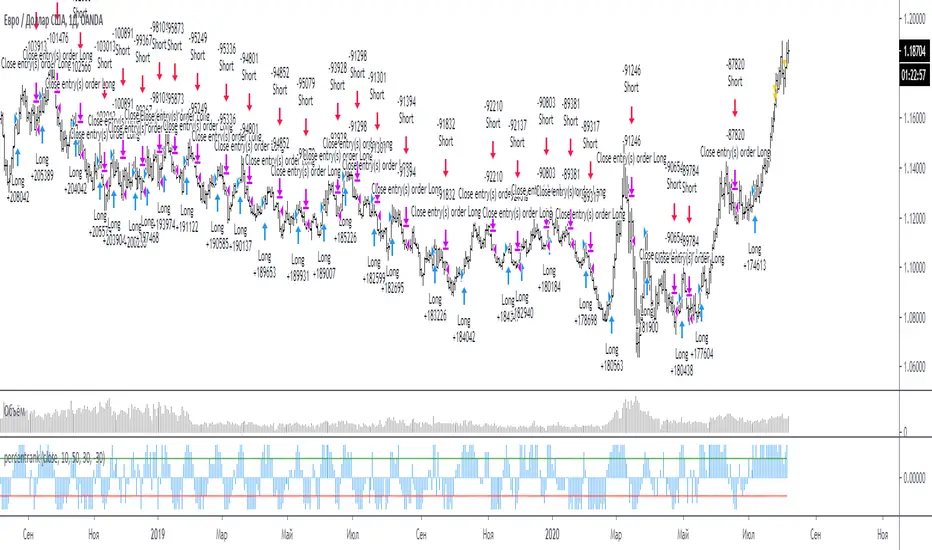
percentrank strategySrategy for percentrank
Percent rank is the percents of how many previous values was less than or equal to the current value of given series.
long entry: intersection line 1 from bottom to top
short entry: crossing line 2 from top to bottom
Стратегия для индикатора percentrank
Процентный рейтинг — это процент от количества предыдущих значений, которые были меньше или равны текущему значению данной серии.
вход в лонг: пересечение line 1 снизу вверх
вход в шорт: пересечение line 2 сверху вниз
Short in Bollinger Band Down trend (Weekly and Daily) // © PlanTradePlanMM
// 6/14/2020
// ---------------------------------------------------
// Name: Short in Bollinger Band Down trend (Weekly and Daily)
// ---------------------------------------------------
// Key Points in this study:
// 1. Short in BB Lower band, probability of price going down is more than 50%
// 2. Short at the top 1/4 of Lower band (EMA - Lower line), Stop is EMA, tartget is Lower line; it matches risk:/reward=1:3 naturally
//
// Draw Lines:
// BB Lower : is the Target (Black line)
// BB EMA : is the initial Stop (Black line)
// ShortLine : EMA - 1/4 of (Stop-target), which matches risk:/reward=1:3
// Prepare Zone : between EMA and ShortLine
// shortPrice : Blue dot line only showing when has Short position, Which shows entry price.
// StopPrice : Black dot line only showing when has Short position, Which shows updated stop price.
//
// Add SMA50 to filter the trend. Price <= SMA, allow to short
//
// What (Condition): in BB down trend band
// When (Price action): Price cross below ShortLine;
// How (Trading Plan): Short at ShortLine;
// Initial Stop is EMA;
// Initial Target is BB Lower Line;
// FollowUp: if price moves down first, and EMA is below Short Price. Move stop to EMA, At least "make even" in this trade;
// if Price touched Short Line again and goes down, new EMA will be the updated stop
//
// Exit: 1. Initial stop -- "Stop" when down first, Close above stop
// 2. Target reached -- "TR" when down quickly, Target reached
// 3. make even -- "ME" when small down and up, Exit at Entry Price
// 4. Small Winner -- "SM" when EMA below Entry price, Exit when Close above EMA
//
// --------------
// Because there are too many flags in up trend study already, I created this down trend script separately.
// Uptrend study is good for SPY, QQQ, and strong stocks.
// Downtrend Study is good for weak ETF, stock, and (-2x, -3x) ETFs, such as FAZ, UVXY, USO, XOP, AAL, CCL
// -----------------------------------------------------------------------------------------------------------------
// Back test Weekly and daily chart for SPY, QQQ, XOP, AAL, BA, MMM, FAZ, UVXY
// The best sample is FAZ Weekly chart.
// When SPY and QQQ are good in long term up trend, these (-2x, -3x) ETFs are always going down in long term.
// Some of them are not allowed to short. I used option Put/Put spread for the short entry.
//

SSL Crossover + MA choiceThis indicator builds on the SSL channel code by ErwinBeckers @
I have added options for diff MA's to be used in the SSL channel and crossover indicators for buy/sell signals
default MA is set to Arnaud Legaux, but you can set it to whatever you like - original was a Simple Moving Average by ErwinBeckers
The indicator will not repaint as the signals are drawn after close of crossover candles
Let me know if you have any suggestions - happy to add more functionality

Mirror MACD by Trader JayThis is my take on the metatrader indicator, the mirror macd. Works pretty good on Forex, haven't tested on anything else
Enter long after the Blue Line Cross Up the Red Line and EXIT after the Green line Cross Up the Red Line (above the Blue Line).
For the opposite position : ENTER SELL after the Red Line Cross Down.

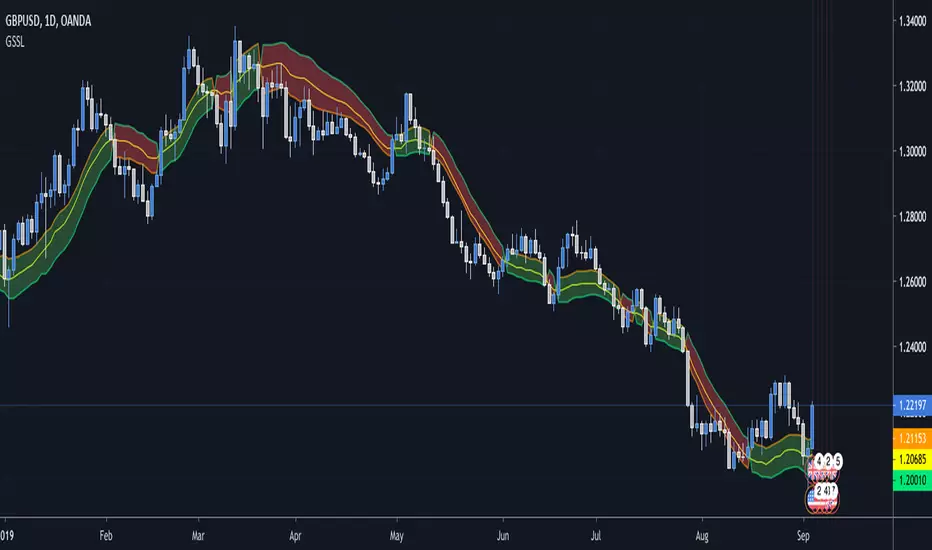
Generalized SSL by Vts// Generalized SSL:
// This is the very first time the SSL indicator, whose acronym I ignore, is on Tradingview.
// It is based on moving averages of the highs and lows.
// Similar channel indicators can be found, whereas
// this one implements the persistency inside the channel, which is rather tricky.
// The green line is the base line which decides entries and exits, possibly with trailing stops.
// With respect to the original version, here one can play with different moving averages.
// The default settings are (10,SMA)
//
// Vitelot/Yanez/Vts March 2019
Trend is your friendThis indicator evaluates the trend based on crosses of two McGinley moving averages. It paints candles accordingly (it does not repaint), so you can see what the indicator is saying more clearly and stay in your trade until you see a period of consolidation or a reversal. You can control how far away those moving averages need to be for you to consider it a trend. If this distance is not met candles color is not changed and it shows you that the market is in a period of consolidation. I also added visualization of RSI, so you can have an easier time finding appropriate profit targets. For stop loss I would recommend placing it a couple points above or below the previous high / low that is located above / below you final target for entry. You can also use a certain percentage that works for you. I tried adding a stop loss based on ATR, but I did not like the results. Using market structure is a better choice in my opinion.
Here is a basic trading strategy for the default settings:
Wait for the indicator to start printing a series of green or red candles. After that you can enter a long or a short around moving averages. Another valid place to entry is the specific RSI zone. If we are in an uptrend buying when RSI is oversold can be beneficial as you expect market to recover. I do not recommend changing RSI from 14. Vice versa for the downtrend. It gives you an edge as you know at what price RSI will be oversold and allows you to place trades in advance. Pretty neat! You need to realize that no indicator or strategy can give you an exact entry. There will always be some margin of error. What I wanted to say is that if there is a strong trend up and you buy around your key moving averages and when RSI is oversold you entered in good places and there is a pretty good chance you will make money.
Time frame settings:
If you want to use tighter stop losses I would recommend sticking to 15m. Do not go lower. It is not worth the stress. 1h and 4h seems to be very good as well, but expect your stop losses to be wider. What I personally tend to do is display 15m, 30m and 1h and compare it. Think of it as a short, mid and long term. That way you can see things little bit better.
Examples:
1H chart BTC
4h chart EUR / USD
1D chart NASDAQ
15m chart BTC (Daytrading)
That last chart shows that even if you were longing while the trend was about to change you still had a good chance to close it with a little profit and switch to short easily. The default settings is what has worked the best for me. Feel free to change them as you see fit and do not forget to let me know if you find something that works better :)
Notes:
Either disable wick display or change it to a neutral color like gray for both green and red candles. Unfortunately pine script does not allow wick painting, so if you have red / green wicks it will look terrible. If RSI visualization makes your candles look too small you can go to settings and disable the display of individual RSI levels. You will still be able to see the zones, but the scale won't be affected.

Daily ATR%If You are using a percentage of the Daily Average True Range in determining your stop placement,
this quick indicator is for You.
excerpt from investopedia.com/articles/trading/06/stopplacement.asp
ATR % Stop Method
The ATR% stop method can be used by any type of trader because the width of the stop is determined by the percentage of average true range (ATR). ATR is a measure of volatility over a specified period of time. The most common length is 14, which is also a common length for oscillators such as the relative strength index (RSI) and stochastics. A higher ATR indicates a more volatile market, while a lower ATR indicates a less volatile market. By using a certain percentage of ATR, you ensure that your stop is dynamic and changes appropriately with market conditions.
For example, for the first four months of 2006, the GBP/USD average daily range was around 110 to 140 pips. A day trader may want to use a 10% ATR stop - meaning that the stop is placed 10% x ATR pips from the entry price.In this instance, the stop would be anywhere from 11 to 14 pips from your entry price. A swing trader might use 50% or 100% of ATR as a stop. In May and June of 2006, daily ATR was anywhere from 150 to 180 pips. As such, the day trader with the 10% stop would have stops from entry of 15 to 18 pips while the swing trader with 50% stops would have stops of 75 to 90 pips from entry.

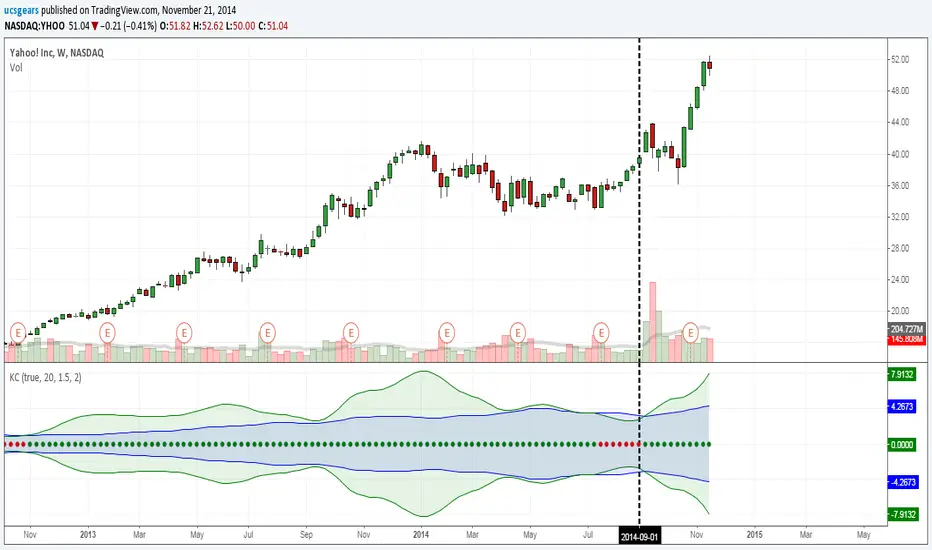
UCS_Squeeze_Timing-V1There is an important information the Squeeze indicator is missing, which is the Pre Squeeze entry. While the Bollinger band begins to curves out of the KC, The breakout usually happens. There are many instances that the Squeeze indicator will fire, after the Major move, I cant blame the indicator, thats the nature (lagging) of all indicators, and we have to live with it.
Therefore pre-squeeze-fire Entry can be critical in timing your entry. Timing it too early could result in stoploss if it turns against you, ( or serious burn on options premium), because we never know when the squeeze will fire with the TTM squeeze, But now We know. Its a little timing tool. Managing position is critical when playing options.
I will code the timing signal when I get some time.
Updated Versions -
Vegas Triple Tunnel (CGYJ Pro)维加斯三通道(Vegas Tunnel)
指标简介
维加斯三通道是由职业交易员Vegas开发的经典趋势跟踪系统,通过三组EMA均线构建短期、中期、长期三层通道,帮助交易者识别趋势方向和最佳入场时机。
通道结构
通道均线用途短期EMA 21 / 26短线趋势、快速入场中期EMA 144 / 169核心趋势判断、标准入场长期EMA 576 / 676大趋势方向、重要支撑阻力
使用方法
多头排列:短期通道 > 中期通道 > 长期通道,逢回调做多
空头排列:短期通道 < 中期通道 < 长期通道,逢反弹做空
回调入场:价格回踩通道后反弹是最佳入场点
适用范围
适用于所有品种和周期,H1、H4、日线效果最佳。
Vegas Triple Tunnel
Overview
The Vegas Triple Tunnel is a classic trend-following system developed by professional trader Vegas. It uses three pairs of EMA lines to construct short-term, medium-term, and long-term channels, helping traders identify trend direction and optimal entry points.
Channel Structure
Short-term Channel: EMA 21 / 26 - For quick trend identification and short-term entries
Medium-term Channel: EMA 144 / 169 - Core trend judgment and standard entries
Long-term Channel: EMA 576 / 676 - Major trend direction and key support/resistance levels
How to Use
Bullish Alignment: Short > Medium > Long channel, look for pullback entries to go long
Bearish Alignment: Short < Medium < Long channel, look for bounce entries to go short
Best Entry: Price pullback to channel and bounce provides optimal entry opportunities
Applicable Markets
Works on all instruments and timeframes. Best results on H1, H4, and Daily charts.

Pattern Multi-TF Dashboardesigned to identify the three primary phases of price action: Contraction, Expansion, and Trend. By combining technical momentum (ADX) with price range volatility, this script provides a "top-down" view of the market, allowing traders to see how lower-timeframe price action fits into the broader market cycle.
Core Logic & Market Phases
The indicator classifies market conditions based on a proprietary blend of ADX (Average Directional Index) and price deviation from the Fair Market Value (FMV).
🟦 Contraction (Blue): Identified when ADX is low and price is consolidating within a narrow range relative to the FMV. This represents "market value" where orders are being accumulated.
🟧 Expansion (Orange): Triggered when ADX begins to rise and price pushes away from the FMV. This represents the initial breakout phase where the market is seeking a new value area.
🟩 Trend (Green): Confirmed when ADX remains high and price maintains direction. This is the "momentum" phase of the cycle.
⬜ Neutral (Gray): Default state when neither contraction nor strong momentum is detected.
Key Features
Multi-TF Dashboard: A dynamic, real-time table displaying the Phase, Bias (Bullish/Bearish), and FMV price for eight different timeframes (1m through Monthly).
Visual Bias Tracking: The "Bias" column is color-coded (Green for Bullish, Red for Bearish) based on whether price is trading above or below the Fair Market Value (Mid-point of the range).
On-Chart Inefficiencies (FVG): Automatically plots Green/Red triangles to highlight Fair Value Gaps, identifying areas of price imbalance where liquidity may be resting.
HTF FMV Overlay: Plots the Fair Market Value (Mid-line) of a user-defined Higher Timeframe (e.g., 4H) directly onto your current chart for easy trend reference.
Optimized Performance: Built specifically for Pine Script® v6, the dashboard is designed to update only on the most recent bar to ensure zero chart lag during manual scrolling.
How to Use
Identify the HTF Phase: Look at the background color of your chart to see the 4H or Daily phase.
Check for Alignment: Use the Dashboard to see if the 1m and 5m biases match the HTF bias.
Find Entry: Look for Inefficiencies (FVGs) that align with the Expansion or Trend phases for high-probability entry points.

Pattern Multi-TF DashboardPattern indicator is a comprehensive market analysis tool designed to identify the three primary phases of price action: Contraction, Expansion, and Trend. By combining technical momentum (ADX) with price range volatility, this script provides a "top-down" view of the market, allowing traders to see how lower-timeframe price action fits into the broader market cycle.
Core Logic & Market Phases
The indicator classifies market conditions based on a proprietary blend of ADX (Average Directional Index) and price deviation from the Fair Market Value (FMV).
🟦 Contraction (Blue): Identified when ADX is low and price is consolidating within a narrow range relative to the FMV. This represents "market value" where orders are being accumulated.
🟧 Expansion (Orange): Triggered when ADX begins to rise and price pushes away from the FMV. This represents the initial breakout phase where the market is seeking a new value area.
🟩 Trend (Green): Confirmed when ADX remains high and price maintains direction. This is the "momentum" phase of the cycle.
⬜ Neutral (Gray): Default state when neither contraction nor strong momentum is detected.
Key Features
Multi-TF Dashboard: A dynamic, real-time table displaying the Phase, Bias (Bullish/Bearish), and FMV price for eight different timeframes (1m through Monthly).
Visual Bias Tracking: The "Bias" column is color-coded (Green for Bullish, Red for Bearish) based on whether price is trading above or below the Fair Market Value (Mid-point of the range).
On-Chart Inefficiencies (FVG): Automatically plots Green/Red triangles to highlight Fair Value Gaps, identifying areas of price imbalance where liquidity may be resting.
HTF FMV Overlay: Plots the Fair Market Value (Mid-line) of a user-defined Higher Timeframe (e.g., 4H) directly onto your current chart for easy trend reference.
Optimized Performance: Built specifically for Pine Script® v6, the dashboard is designed to update only on the most recent bar to ensure zero chart lag during manual scrolling.
How to Use
Identify the HTF Phase: Look at the background color of your chart to see the 4H or Daily phase.
Check for Alignment: Use the Dashboard to see if the 1m and 5m biases match the HTF bias.
Find Entry: Look for Inefficiencies (FVGs) that align with the Expansion or Trend phases for high-probability entry points.

Buyers & sellers Candle Control Dominance Zone @MaxMaserati 3.0Description
The Buyers & Sellers Candle Control Dominance Zone is a surgical price-action tool designed to identify and project key supply and demand zones derived from candle anatomy across multiple timeframes.
By splitting candles into "Sellers Control" (upper wick/shadow) and "Buyers Control" (lower wick/shadow) regions, this script visualizes exactly where price rejection and absorption are occurring. With the new HTF Engine, you can now view these institutional rejection zones from a Higher Timeframe (e.g., 4H) while trading on a Lower Timeframe (e.g., 15m).
How it Works
The indicator identifies specific "Control Zones" based on the battle between buyers and sellers:
Live Control (Current & HTF): Real-time monitoring of the developing candle. See a 4H wick forming live while watching the 1m chart.
Last Closed Control (Current & HTF): Projects the zones from the most recently completed candle.
Dominance Zones (BuBC & BeBC):
BuBC (Bullish Body Close): A "Dominance Zone" triggered when a candle closes above the previous candle's high. Signifies strong bullish momentum.
BeBC (Bearish Body Close): A "Dominance Zone" triggered when a candle closes below the previous candle's low. Signifies aggressive selling pressure.
Key Features
Multi-Timeframe (MTF) Overlay: Plot 4H, Daily, or Weekly control zones directly on your lower timeframe scalping charts.
Smart Labeling: HTF labels automatically update to show the zone type (e.g., "Sellers Control (Live) ") and whether the last candle was a Dominance candle (BuBC/BeBC).
Dynamic Extension: Zones are projected forward to help you catch retests of rejection levels.
Alerts Included: Built-in alerts trigger when price crosses into a Dominance Zone (BuBC/BeBC), allowing you to set it and forget it.
Can be use as:
Support & Resistance: Use Buyers Control zones (lower wicks) as demand zones for longs and Sellers Control zones (upper wicks) as supply zones for shorts.
Trend Confirmation: A BuBC zone often acts as a launchpad for continued upside. If price falls back into a BuBC zone and rejects, it is a high-probability continuation signal.
Fractal Entry: Use the HTF zones to find the "Big Picture" levels, then use the Current TF zones to refine your entry with precision.
Settings
Display Filter: Toggle Current TF zones (Live, Closed, BuBC, BeBC) independently.
Higher Timeframe Settings: Enable/Disable HTF overlay and select your preferred timeframe (e.g., 240 for 4H).
Visuals: Fully adjustable transparency, colors, and extension lengths to keep your chart clean.

TSM RSI + Supertrend (Fixed SL + 1:2 RR) 302026RSI + Supertrend Combo Strategy (Fixed SL & 1:2 Risk–Reward)
To trade only in the direction of the trend using Supertrend and enter with momentum confirmation from RSI, while strictly controlling risk with a fixed stop loss and a 1:2 target.
Supertrend – identifies market trend
RSI (14) – confirms strength of the trend
BUY CONDITIONS (Long Trade)
Supertrend changes from Red to Green
→ Market trend turns bullish
Price trades above Supertrend line
RSI is above 50
→ Buying momentum is strong
✅ Enter BUY at the next candle open.
🔴 SELL CONDITIONS (Short Trade)
Supertrend changes from Green to Red
→ Market trend turns bearish
Price trades below Supertrend line
RSI is below 50
→ Selling momentum is strong
✅ Enter SELL at the next candle open.
🛑 Risk Management (Most Important)
Stop Loss (SL): Fixed percentage from entry price
Target (TP): 2 × Stop Loss
→ Risk : Reward = 1 : 2
Example (BUY Trade)
Entry: ₹100
Stop Loss (0.5%): ₹99.50
Target (1:2): ₹101.00
⏱️ Best Timeframes
Intraday: 5 min / 15 min
Swing Trading: 1 Hour / Daily.
Why This Strategy Works
✔ Trades with the trend, not against it
✔ RSI filters false Supertrend signals
✔ Fixed SL protects capital
✔ 1:2 RR ensures profitability even with ~40% win rate
✔ Simple rules – beginner friendly
⚠️ Important Notes
Avoid sideways markets
Best results in trending stocks / indices
Always backtest before live trading.

Break & Retest 369Break & Retest 369
The Break & Retest 369 is a high-precision technical indicator designed for price action traders who specialize in market structure shifts and "S/R Flip" (Support becoming Resistance and vice versa) strategies. Unlike standard oscillators that lag behind price, this tool focuses on **horizontal price levels** that have historically acted as turning points, providing visual zones where the market is likely to offer a "second chance" entry.
Core Philosophy
The script is built on the principle of Market Memory. In a trending market, a "Breakout" signifies a change in order flow. However, smart money often returns to the point of origin (the breakout level) to fill remaining orders or test the strength of the new trend. This indicator automates the identification of these "Retest" zones, which are often the highest-probability entry points for trend continuation.
How It Works: The Logic
The indicator follows a strict, multi-step calculation process:
1. Swing Point Identification: It utilizes a Pivot High/Low** algorithm. It scans for "peaks" and "valleys" that are isolated by a specific number of bars on either side (defined by the `Lookback` input).
2. **Breakout Detection:** The script monitors these pivot levels. A **Buy Zone** is triggered only when the price achieves a clean **Close** above a previous Pivot High. Conversely, a **Sell Zone** is triggered by a **Close** below a previous Pivot Low.
3. **Zone Construction:** Once a break is confirmed, the script draws a box centered exactly at the price level of the broken pivot.
4. **Forward Projection:** These zones are projected forward in time using the `Zone Extension` parameter, creating a visual "landing strip" for future price action.
### Key Features & How to Use It
* **Dynamic Support/Resistance Flips:** Green zones represent former resistance levels that are now expected to act as support. Red zones represent former support levels now expected to act as resistance.
* **Zone Customization:** Traders can adjust the `Zone Height (Ticks)` to account for market volatility or specific asset spreads (e.g., wider zones for XAUUSD, tighter for EURUSD).
* **Scannability:** The script helps traders filter out the "noise" of mid-range price movement and focus only on significant structural levels.
### Default Configuration
To get the most out of the **369** logic, the indicator comes pre-configured with the following defaults:
* **Swing Detection Lookback (18):** Optimized for medium-term structure, avoiding "micro-pivots" that lead to false signals.
* **Zone Height (1 Tick):** Focuses on the precise price point of the pivot for maximum accuracy.
* **Zone Extension (90 Bars):** Projects levels far enough to catch "deep" retests that occur several hours or days later.
---
### Pro Tip for Traders
Wait for price to return to a **Buy Zone** and look for a bullish rejection candle (like a pin bar or engulfing candle) before entering. This combines the "Where" (the zone) with the "When" (the price action confirmation) for a robust trading system.
Would you like me to add a **"Mitigation"** feature that automatically deletes or fades the zone once the price has successfully touched it?

ORB 369 - Opening Range Breakout The ORB 369 is a professional-grade momentum indicator designed to capture the volatility of the New York market open. While many Opening Range Breakout (ORB) scripts simply draw lines, this script integrates time-segmented price action with Supply and Demand (S/D) theory to filter out "fakeouts" and identify high-probability institutional entries.
💡 The Core Concept: Why 3-6-9?
The strategy is rooted in the "Market Open Volatility" principle. The first 15 minutes (9:30–9:45 AM EST) represent the period where institutional orders are processed and "price discovery" is most aggressive.
The Range: We define the 15-minute high and low as the "Battlefield."
The 369 Logic: This script focuses on the 3rd 5-minute candle of the session (completing the 15m range) and monitors the subsequent 5m and 15m cycles for a definitive trend shift.
🛠️ How It Works
The script utilizes Pine Script v6 high-precision time-tracking and state-handling to ensure accuracy even on historical data.
1. Dynamic Session Anchoring
Unlike static indicators, this script uses America/New_York timezone anchoring. It identifies the Opening Range (OR) regardless of your local time, ensuring you are aligned with the NYSE floor traders.
2. Supply & Demand Detection
The script doesn't just look at the high/low; it analyzes the micro-structure within that 15-minute window.
It identifies unmitigated zones (areas where price moved so fast it left "imbalances").
If a breakout occurs but price immediately hits an internal S/D zone, it warns the trader of a potential "Look Above and Fail" scenario.
3. Breakout Confirmation (5m Logic)
A common mistake is entering on a "wick." This script uses Closing Logic:
Bullish Signal: A 5-minute candle must close entirely above the 15m High.
Bearish Signal: A 5-minute candle must close entirely below the 15m Low.
The script then repaints the candle body (defaulting to Blue/Red) to provide an instant visual cue that the "Breakout is Confirmed."
📈 How to Use It
Wait for the Box: At 9:45 AM EST, the script will automatically lock in the High, Low, and Midpoint (Mean) of the range.
Monitor the Midpoint: The Midpoint acts as the "Line in the Sand." If a breakout occurs but price stays near the Midpoint, the trend is weak. If price stays in the upper half of the range, the Bullish bias is stronger.
The Entry: Wait for the Candle Color Change. A blue candle above the range suggests a long entry; a red candle below suggests a short.
Supply/Demand Zones: If the script highlights a "Demand Zone" at the bottom of the range and price bounces off it before breaking the top, this provides a "double-confluence" setup.
⚙️ Technical Features
Customizable Aesthetics: Use the Settings menu to change the breakout colors (Green/Blue/Red) to match your personal chart theme.
Smart Tooltips: Hover over the inputs in the settings to see detailed explanations of what each parameter does.
Alert Ready: Built-in alerts for "Bullish Breakout" and "Bearish Breakout" that can be sent directly to your phone or desktop via TradingView.

SuperBands: Smart Pullback StrategyIndicator Name: SuperBands (Smart Pullback Strategy)
1. Core Concept (The Philosophy)
This indicator represents a smart fusion of two powerful trading methodologies: Trend Following and Mean Reversion. Instead of trying to predict market tops or bottoms, it focuses on joining an established trend at a "Discount Price."
In short: "Buy the dips in an Uptrend, and Sell the rallies in a Downtrend."
2. Technical Components
The indicator consists of two main engines working in harmony:
First: The Trend Filter (Supertrend):
Settings: (ATR 20 / Factor 6.0).
Function: Identifies the long-term market direction. The high Factor (6.0) is deliberately used to filter out noise and minor fluctuations, ensuring the trend direction only changes when there is a significant market shift.
Rule: If the line is Green, only Long trades are allowed. If Red, only Short trades are allowed.
Second: The Sniper (Bollinger Bands):
Settings: (Length 20 / StdDev 2.0).
Function: Identifies temporary Overbought and Oversold zones within the trend.
Rule: The Lower Band acts as a "Value Zone" for buying, while the Upper Band acts as a "Premium Zone" for selling.
3. Signal Logic (How it Works)
The indicator scans the market for specific, high-probability conditions:
A. Buy Signal (Green Triangle):
Appears only when both conditions are met:
Trend is Bullish: Supertrend is Green.
Price is "Cheap": Price drops to touch or break the Lower Bollinger Band.
Logic: The general trend is Up, and the price has pulled back to a dynamic support level. This is a buying opportunity.
B. Sell Signal (Red Triangle):
Appears only when both conditions are met:
Trend is Bearish: Supertrend is Red.
Price is "Expensive": Price rises to touch or break the Upper Bollinger Band.
Logic: The general trend is Down, and the price has rallied to a dynamic resistance level. This is a selling opportunity.
4. User Guide (How to Trade It)
To achieve the best results, consider the following approach when a signal appears:
A. Entry:
Enter the trade immediately upon the close of the candle where the triangle appears (or place a pending order slightly above/below the signal candle for confirmation).
B. Stop Loss (SL):
Conservative: Place the SL at the Supertrend line (if this line breaks, the trend is invalid).
Aggressive: Place the SL slightly below the signal candle's low or the most recent Swing Low.
C. Take Profit (TP):
Target 1: The Bollinger Bands Middle Line (Basis/SMA 20).
Target 2: The Opposite Band (Upper Band for Buy signals, Lower Band for Sell signals).
5. Key Strengths & Limitations
Main Advantage: This indicator prevents a common trader mistake: "FOMO" (Fear Of Missing Out). It stops you from buying at the top or selling at the bottom. It psychologically forces you to wait for the price to come to you.
Best Use Case: The wide Supertrend settings make this highly effective for Crypto and Volatile Stocks where trends are strong and pullbacks are deep.
Limitation: In tight, ranging markets (choppy markets), the price might not touch the bands often, or it might generate a signal followed by sideways movement.
Summary for the Trader:
This indicator tells you: "The trend is Up, but don't chase the price... wait for it to drop to the Lower Band, then strike."
اسم المؤشر: SuperBands (Smart Pullback Strategy)
1. الفكرة الأساسية (الفلسفة وراء المؤشر)
هذا المؤشر هو دمج ذكي بين استراتيجيتين شهيرتين: تتبع الاتجاه (Trend Following) و اقتناص الارتدادات (Mean Reversion). هو لا يحاول التنبؤ بقمة أو قاع السوق، بل يحاول الدخول مع الاتجاه العام القوي ولكن من "نقطة سعرية مخفضة" (Discount Price).
باختصار: "اشترِ الانخفاضات في الاتجاه الصاعد، وبع الارتفاعات في الاتجاه الهابط".
2. المكونات التقنية
يتكون المؤشر من جزأين رئيسيين يعملان كفريق واحد:
أولاً: الحارس (Supertrend):
الإعدادات: (ATR 20 / Factor 6.0).
الوظيفة: تحديد الاتجاه العام "طويل المدى". استخدام العامل 6.0 (وهو رقم كبير) يجعل المؤشر يتجاهل التذبذبات الصغيرة ولا يغير لونه إلا إذا تغير الاتجاه الحقيقي للسوق بقوة.
القاعدة: إذا كان الخط أخضر، يُسمح بالشراء فقط. إذا كان أحمر، يُسمح بالبيع فقط.
ثانياً: القناص (Bollinger Bands):
الإعدادات: (Length 20 / StdDev 2.0).
الوظيفة: تحديد مناطق ذروة البيع والشراء المؤقتة (Overbought/Oversold) داخل الاتجاه.
القاعدة: الحد السفلي يعتبر منطقة "رخيصة" للشراء، والحد العلوي منطقة "غالية" للبيع.
3. كيف تتكون الإشارة (آلية العمل)
يقوم المؤشر بمسح السوق بحثاً عن شروط محددة بدقة:
A. إشارة الشراء (المثلث الأخضر):
تظهر فقط عند تحقق الشرطين معاً:
الاتجاه صاعد: السوبر تريند لونه أخضر.
سعر مغري: السعر هبط ليلامس أو يكسر الحد السفلي للبولنجر باند (Lower Band).
المنطق: الاتجاه العام صاعد، والسعر قام بعمل تصحيح (Pullback) لمستوى دعم ديناميكي، إذن هي فرصة للشراء بسعر أفضل.
B. إشارة البيع (المثلث الأحمر):
تظهر فقط عند تحقق الشرطين معاً:
الاتجاه هابط: السوبر تريند لونه أحمر.
سعر مرتفع: السعر صعد ليلامس أو يخترق الحد العلوي للبولنجر باند (Upper Band).
المنطق: الاتجاه العام هابط، والسعر قام بعمل تصحيح صعودي لمقاومة ديناميكية، إذن هي فرصة للبيع من مكان مرتفع.
4. كيفية الاستفادة منه (دليل المستخدم)
لتحقيق أفضل نتائج، يُنصح باتباع الخطوات التالية عند ظهور الإشارة:
أ. نقاط الدخول (Entry):
ادخل الصفقة بمجرد إغلاق الشمعة التي ظهر عليها المثلث (أو ضع أمر معلق فوق/تحت الشمعة لتأكيد الحركة).
ب. وقف الخسارة (Stop Loss):
الخيار الآمن: ضع الوقف عند خط السوبر تريند (لأنه إذا كُسر الخط، يعني أن الاتجاه تغير).
الخيار المغامر: ضع الوقف أسفل قاع الشمعة السابقة بمسافة بسيطة، أو أسفل آخر قاع (Swing Low).
ج. جني الأرباح (Take Profit):
الهدف الأول: خط المنتصف للبولنجر باند (الخط البرتقالي الخفي أو متوسط 20).
الهدف الثاني: الحد المعاكس للبولنجر باند (الحد العلوي في حالة الشراء، والسفلي في حالة البيع).
5. مميزات وعيوب يجب الانتباه لها
الميزة القوية: يمنعك هذا المؤشر من ارتكاب خطأ شائع وهو "الشراء في القمة" أو "البيع في القاع". هو يجبرك نفسياً على انتظار السعر ليأتي إليك في مناطق التصحيح.
نقطة القوة: إعدادات السوبر تريند (6.0) تجعل الإشارات قوية جداً في العملات الرقمية (Crypto) والأسهم ذات الاتجاه الواضح (Trending Markets).
نقطة الضعف: في الأسواق العرضية المملة (Ranging Markets) ذات النطاق الضيق جداً، قد لا تلمس الأسعار حدود البولنجر كثيراً، أو قد يعطي إشارات دخول والسوق لا يتحرك بعدها بقوة.
ملخص للمتداول:
هذا المؤشر يقول لك: "السوق صاعد، لكن لا تطارد السعر.. انتظر حتى يهبط السعر إليك عند الخط السفلي ثم اشترِ".

Trend Line & Delta Montosca [English v33.7]This indicator, Trend Line & Delta Montosca , is a high-precision tool designed to identify institutional entry points by combining price action structure with real-time volume sentiment (Order Flow).
Here is a breakdown of its core logic and operational flow:
1. Market Structure & Trendline Analysis
The indicator starts by identifying "Pivot Highs" and "Pivot Lows" based on the Sensitivity settings you chose.
Pivot Connect Method: It draws trendlines connecting these key structural points. A "Long" bias is established when a trendline is broken to the upside, and a "Short" bias when broken to the downside.
BOS (Break of Structure): It monitors when the price closes above the previous high or below the previous low to confirm the current market phase (Bullish or Bearish).
2. Intermarket Synchronization (ES + NQ)
This is a unique "Institutional" filter. The script checks a secondary symbol (e.g., NQ if you are trading ES) to ensure the move is happening across the entire market.
If both instruments hit a pivot at the same time, the trendline is drawn thicker, indicating higher institutional conviction.
3. Order Flow Validation (Delta)
Breaking a trendline is not enough; it must be backed by "Smart Money" volume. The indicator uses Lower Timeframe (LTF) Intrabar Data to calculate the Delta:
Strength Filter: It checks if the buying/selling volume in a single candle exceeds a specific percentage (set to 75% by default).
Efficiency Filter: It identifies "Absorption" where the price moves aggressively with lower volume, suggesting a lack of resistance.
4. Inverted FVG (Fair Value Gap) Reaction
The final "trigger" is often the reaction to a Fair Value Gap.
The script tracks bearish and bullish FVGs.
The Inversion Logic: A "Long" signal is only validated if the price "inverts" a bearish FVG (closes above it), treating the old resistance as new institutional support.
5. Blue Sky Filter (ATH)
When the price is at an All-Time High (ATH), traditional FVG reactions might not exist. The script includes an optional "Blue Sky" logic that allows for trend-following entries even if there is no previous FVG to invert, as long as the structural breakout and Delta are present.
Visualization Summary
Labels: Clearly mark "LONG" or "SHORT" at the exact candle of entry.
Snapshots: To help you review your trades, the script leaves a "visual footprint" (the trendline and the FVG box) that caused the signal, so you can see the exact institutional context after the trade has moved.

Universe_PRMP (Universe_Professional Risk Management Panel)Description
Universe_PRMP (Universe_Professional Risk Management Panel)
This comprehensive tool is designed to bring institutional-grade risk discipline to retail traders. Managing risk is the most critical part of trading, especially in high-leverage environments. This script automates the complex calculations of position sizing and profit/loss projection.
How to Use:
Initial Setup: When you add the script to your chart, it will prompt you to select two price levels. The first click sets your Stop Loss (SL) and the second sets your Take Profit (TP).
Account Configuration: Open the script settings (the gear icon) to input your Account Balance and the Percentage of Risk you are willing to take per trade (standard is 1% or 2%).
Market Conditions: Enter your broker's current Spread in pips to ensure the lot size calculation accounts for the cost of entry.
Active Monitoring:
Suggested Lot: The dashboard will immediately show the exact lot size you should enter in your trading platform.
Real-Time Projection: As price moves, the dashboard tracks whether your trade is active, hit the target, or stopped out.
Visual Labels: Red (SL) and Green (TP) labels on the chart provide clear visual cues for your exit points.
Key Features:
Dynamic Position Sizing: Automatically adjusts lot size based on the distance between entry and SL.
Spread Integration: Protects your capital by including transaction costs in the risk calculation.
Ticker Sensitivity: The panel recognizes symbol changes to prevent calculation errors across different pairs.
Visual Status Indicators: Color-coded status alerts to keep you emotionally detached and strategically focused.
DISCLAIMER:
This script is an educational and utility tool designed for risk calculation purposes only. It does not provide trading signals or investment advice. Past performance is not indicative of future results. Use this tool at your own risk.

Mean-Reversion Strategy (RSI + ATR) v1
Entry: Wait for RSI(10) to cross 35 (bullish) or 65 (bearish)
Stop-loss: 2.5 times current ATR away from entry
Take-profit: 4 times current ATR away from entry
Risk: 2% of account per trade
Skip trades if price moved >5% recently or volume is below average
Risk/Reward: You risk $1 to make $1.60 (1:1.6 ratio)
That's the complete strategy. Simple, rules-based, volatility-adjusted for crypto.
