Commission-aware Trade LabelsCommission-aware Trade Labels
Description:
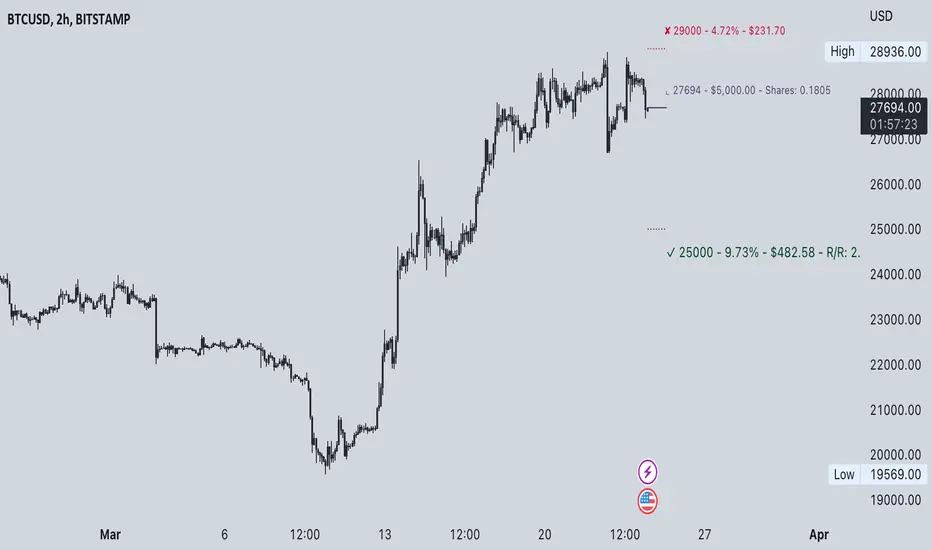
This library provides an easy way to visualize take-profit and stop-loss levels on your chart, taking into account trading commissions. The library calculates and displays the net profit or loss, along with other useful information such as risk/reward ratio, shares, and position size.
Features:
Configurable take-profit and stop-loss prices or percentages.
Set entry amount or shares.
Calculates and displays the risk/reward ratio.
Shows net profit or loss, considering trading commissions.
Customizable label appearance.
Usage:
Add the script to your chart.
Create an Order object for take-profit and stop-loss with desired configurations.
Call target_label() and stop_label() methods for each order object.
Example:
target_order = Order.new(take_profit_price=27483, stop_loss_price=28000, shares=0.2)
stop_order = Order.new(stop_loss_price=29000, shares=1)
target_order.target_label()
stop_order.stop_label()
This script is a powerful tool for visualizing your trading strategy's performance and helps you make better-informed decisions by considering trading commissions in your profit and loss calculations.
Library "tradelabels"
entry_price(this)
Parameters:
this : Order object
@return entry_price
take_profit_price(this)
Parameters:
this : Order object
@return take_profit_price
stop_loss_price(this)
Parameters:
this : Order object
@return stop_loss_price
is_long(this)
Parameters:
this : Order object
@return entry_price
is_short(this)
Parameters:
this : Order object
@return entry_price
percent_to_target(this, target)
Parameters:
this : Order object
target : Target price
@return percent
risk_reward(this)
Parameters:
this : Order object
@return risk_reward_ratio
shares(this)
Parameters:
this : Order object
@return shares
position_size(this)
Parameters:
this : Order object
@return position_size
commission_cost(this, target_price)
Parameters:
this : Order object
@return commission_cost
target_price
net_result(this, target_price)
Parameters:
this : Order object
target_price : The target price to calculate net result for (either take_profit_price or stop_loss_price)
@return net_result
create_take_profit_label(this, prefix, size, offset_x, bg_color, text_color)
Parameters:
this
prefix
size
offset_x
bg_color
text_color
create_stop_loss_label(this, prefix, size, offset_x, bg_color, text_color)
Parameters:
this
prefix
size
offset_x
bg_color
text_color
create_entry_label(this, prefix, size, offset_x, bg_color, text_color)
Parameters:
this
prefix
size
offset_x
bg_color
text_color
create_line(this, target_price, line_color, offset_x, line_style, line_width, draw_entry_line)
Parameters:
this
target_price
line_color
offset_x
line_style
line_width
draw_entry_line
Order
Order
Fields:
entry_price : Entry price
stop_loss_price : Stop loss price
stop_loss_percent : Stop loss percent, default 2%
take_profit_price : Take profit price
take_profit_percent : Take profit percent, default 6%
entry_amount : Entry amount, default 5000$
shares : Shares
commission : Commission, default 0.04%
"entry" için komut dosyalarını ara
TradingHelperLibLibrary "TradingHelperLib"
Trading Helper Library - Limit order, pip calculation and utility functions for trading bots
f_pipValue()
Calculates pip value based on symbol info
Returns: Pip value
f_pipsToPrice(pips)
Converts pip count to price difference
Parameters:
pips (float) : Number of pips
Returns: Price difference
calcExpireBarCount(minutesToExpire)
Converts minutes to bar count based on timeframe
Parameters:
minutesToExpire (float) : Duration in minutes
Returns: Bar count
calcLimitPrice(isLong, signalPrice, deviation, deviationType)
Calculates limit order price with deviation
Parameters:
isLong (bool) : True for long, false for short
signalPrice (float) : Signal price
deviation (float) : Deviation amount
deviationType (string) : Deviation type ("USDT" or "%")
Returns: Limit price
checkLimitFill(isLong, limitPrice)
Checks if limit order is filled
Parameters:
isLong (bool) : True for long, false for short
limitPrice (float) : Limit price to check
Returns: True if filled
f_multiplier(lvl, mode)
Calculates DCA multiplier based on level and mode
Parameters:
lvl (int) : DCA level
mode (string) : Multiplier mode ("Sabit", "Fibonacci", "Martingale", etc.)
Returns: Multiplier value
f_pctToPrice(pct, basePrice)
Converts percentage value to price difference
Parameters:
pct (float) : Percentage value (e.g. 2.0 = 2%)
basePrice (float) : Reference price
Returns: Price difference
f_priceChange_toPct(priceChange, basePrice)
Converts price change to percentage
Parameters:
priceChange (float) : Price difference
basePrice (float) : Reference price
Returns: Percentage value
calcMargin(notional, leverage)
Calculates margin from notional value
Parameters:
notional (float) : Trade size (e.g. $1000)
leverage (int) : Leverage value (e.g. 100)
Returns: Margin value
calcNotional(margin, leverage)
Calculates notional from margin
Parameters:
margin (float) : Collateral value
leverage (int) : Leverage value
Returns: Notional value
calcLiqPriceLongSimple(avgPrice, leverage)
Calculates simple liquidation price for Long position
Parameters:
avgPrice (float) : Average entry price
leverage (int) : Leverage value
Returns: Estimated liquidation price
calcLiqPriceShortSimple(avgPrice, leverage)
Calculates simple liquidation price for Short position
Parameters:
avgPrice (float) : Average entry price
leverage (int) : Leverage value
Returns: Estimated liquidation price
calcPnlLong(entryPrice, currentPrice, notional)
Calculates Long position PNL
Parameters:
entryPrice (float) : Entry price
currentPrice (float) : Current price
notional (float) : Position size
Returns: PNL value
calcPnlShort(entryPrice, currentPrice, notional)
Calculates Short position PNL
Parameters:
entryPrice (float) : Entry price
currentPrice (float) : Current price
notional (float) : Position size
Returns: PNL value
calcFee(notional, feeRate)
Calculates trading fee
Parameters:
notional (float) : Trade size
feeRate (float) : Fee rate in percentage (e.g. 0.1 = 0.1%)
Returns: Fee value

buy by rev//@version=5
indicator("HTF EMA Crossover → LTF Entry Alert", overlay=true)
// ───── TIMEFRAMES ─────
htf = "60" // 1 Hour
ltf = "5" // 5 Minute (apply script on this)
// ───── HTF EMAs ─────
htfEma5 = request.security(syminfo.tickerid, htf, ta.ema(close, 5))
htfEma13 = request.security(syminfo.tickerid, htf, ta.ema(close, 13))
// ───── LTF EMAs ─────
ema5 = ta.ema(close, 5)
ema13 = ta.ema(close, 13)
// ───── CONDITIONS ─────
// Hourly bullish crossover STATE
htfBullishState = htfEma5 > htfEma13
// 5-min EMA crossover
ltfCross = ta.crossover(ema5, ema13)
// 5-min EMA 5 reclaim / continuation
ltfResume = ema5 > ema13 and ema5 <= ema13
// FINAL ENTRY CONDITION
entrySignal = htfBullishState and (ltfCross or ltfResume)
// ───── PLOTS ─────
plot(ema5, color=color.green, title="EMA 5")
plot(ema13, color=color.orange, title="EMA 13")
plotshape(
entrySignal,
title="BUY Entry",
style=shape.labelup,
location=location.belowbar,
color=color.green,
text="BUY",
textcolor=color.white,
size=size.small
)
// ───── ALERT ─────
alertcondition(
entrySignal,
title="HTF EMA Bullish → LTF Entry Alert",
message="1H EMA 5>13 bullish state + 5min EMA entry trigger"
)

Katz Exploding PowerBand FilterUnderstanding the Katz Exploding PowerBand Filter (EPBF) v2.4
1. Indicator Overview
The Katz Exploding PowerBand Filter (EPBF) is an advanced technical indicator designed to identify moments of expanding bullish or bearish momentum, often referred to as "power." It operates as a standalone oscillator in a separate pane below the main price chart.
Its primary goal is to measure underlying market strength by calculating custom "Bull" and "Bear" power components. These components are then filtered through a versatile moving average and a dual signal line system to generate clear entry and exit signals. This indicator is not a simple momentum oscillator; it uses a unique calculation based on exponential envelopes of both price and squared price to derive its values.
2. On-Chart Lines and Components
The indicator pane consists of five main lines:
Bullish Component (Thick Green/Blue/Yellow/Gray Line): This is the core of the indicator. It represents the calculated bullish "power" or momentum in the market.
Bright Green: Indicates a strong, active long signal condition.
Blue: Shows the bull component is above the MA filter, but the filter itself is still pointing down—a potential sign of a reversal or weakening downtrend.
Yellow: A warning sign that bullish power is weakening and has fallen below the primary signal lines.
Gray: Represents neutral or insignificant bullish power.
Bearish Component (Thick Red/Purple/Yellow/Gray Line): This line represents the calculated bearish "power" or downward momentum.
Bright Red: Indicates a strong, active short signal condition.
Purple: Shows the bear component is above the MA filter, but the filter itself is still pointing down—a sign of potential trend continuation.
Yellow: A warning sign that bearish power is weakening.
Gray: Represents neutral or insignificant bearish power.
MA Filter (Purple Line): This is the main filter, calculated using the moving average type and length you select in the settings (e.g., HullMA, EMA). The Bull and Bear components are compared against this line to determine the underlying trend bias.
Signal Line 1 (Orange Line): A fast Exponential Moving Average (EMA) of the stronger power component. It acts as the first level of dynamic support or resistance for the power lines.
Signal Line 2 (Lime/Gray Line): A slower EMA that acts as a confirmation filter.
Lime Green: The line turns lime when it is rising and the faster Signal Line 1 is above it, indicating a confirmed bullish trend in momentum.
Gray: Indicates a neutral or bearish momentum trend.
3. On-Chart Symbols and Their Meanings
Various characters are plotted at the bottom of the indicator pane to provide clear, actionable signals.
L (Pre-Long Signal): The first sign of a potential long entry. It appears when the Bullish Component rises and crosses above both signal lines for the first time.
S (Pre-Short Signal): The first sign of a potential short entry. It appears when the Bearish Component rises and crosses above both signal lines for the first time.
▲ (Post-Long Signal): A stronger confirmation for a long entry. It appears with the 'L' signal only if the momentum trend is also confirmed bullish (i.e., the slower Signal Line 2 is lime green).
▼ (Post-Short Signal): A stronger confirmation for a short entry. It appears with the 'S' signal only if the momentum trend is confirmed bullish.
Exit / Take-Profit Symbols:
These symbols appear when a power component crosses below a line, suggesting that momentum is fading and it may be time to take profit.
⚠️ (Exit Signal 1): The Bull/Bear component has crossed below the main MA Filter. This is the first and most sensitive take-profit signal.
☣️ (Exit Signal 2): The Bull/Bear component has crossed below the faster Signal Line 1. This is a moderate take-profit signal.
🚼 (Exit Signal 3): The Bull/Bear component has crossed below the slower Signal Line 2. This is the slowest take-profit signal, suggesting the trend is more definitively exhausted.
4. Trading Strategy and Rules
Long Entry Rules:
Initial Signal: Wait for an L to appear at the bottom of the indicator. This confirms that bullish power is expanding.
Confirmation (Recommended): For a higher-probability trade, wait for a green ▲ symbol to appear. This confirms the underlying momentum trend aligns with the signal.
Entry: Enter a long (buy) position on the opening of the next candle after the signal appears.
Short Entry Rules:
Initial Signal: Wait for an S to appear at the bottom of the indicator. This confirms that bearish power is expanding.
Confirmation (Recommended): For a higher-probability trade, wait for a maroon ▼ symbol to appear. This confirms the underlying momentum trend aligns with the signal.
Entry: Enter a short (sell) position on the opening of the next candle after the signal appears.
Take Profit (TP) Rules:
The indicator provides three levels of take-profit signals. You can choose to exit your entire position or scale out at each level.
For a long trade, exit when you see ⚠️, ☣️, or 🚼 appear below the Bullish Component.
For a short trade, exit when you see ⚠️, ☣️, or 🚼 appear below the Bearish Component.
Stop Loss (SL) Rules:
The indicator does not provide an explicit stop loss. You must use your own risk management rules. Common methods include:
Swing High/Low: For a long position, place your stop loss below the most recent significant swing low on the price chart. For a short position, place it above the most recent swing high.
ATR-Based: Use an Average True Range (ATR) indicator to set a volatility-based stop loss.
Fixed Percentage: Risk a fixed percentage (e.g., 1-2%) of your account on the trade.
5. Disclaimer
This indicator is a tool for technical analysis and should not be considered financial advice. All trading involves significant risk, and past performance is not indicative of future results. The signals generated by this indicator are probabilistic and can result in losing trades. Always use proper risk management, such as setting a stop loss, and never risk more than you are willing to lose. It is recommended to backtest this indicator and use it in conjunction with other forms of analysis before trading with real capital. The indicator should only be used for educational purposes.

EAOBS by MIGVersion 1
1. Strategy Overview Objective: Capitalize on breakout movements in Ethereum (ETH) price after the Asian open pre-market session (7:00 PM–7:59 PM EST) by identifying high and low prices during the session and trading breakouts above the high or below the low.
Timeframe: Any (script is timeframe-agnostic, but align with session timing).
Session: Pre-market session (7:00 PM–7:59 PM EST, adjustable for other time zones, e.g., 12:00 AM–12:59 AM GMT).
Risk-Reward Ratios (R:R): Targets range from 1.2:1 to 5.2:1, with a fixed stop loss.
Instrument: Ethereum (ETH/USD or ETH-based pairs).
2. Market Setup Session Monitoring: Monitor ETH price action during the pre-market session (7:00 PM–7:59 PM EST), which aligns with the Asian market open (e.g., 9:00 AM–9:59 AM JST).
The script tracks the highest high and lowest low during this session.
Breakout Triggers: Buy Signal: Price breaks above the session’s high after the session ends (7:59 PM EST).
Sell Signal: Price breaks below the session’s low after the session ends.
Visualization: The session is highlighted on the chart with a white background.
Horizontal lines are drawn at the session’s high and low, extended for 30 bars, along with take-profit (TP) and stop-loss (SL) levels.
3. Entry Rules Long (Buy) Entry: Enter a long position when the price breaks above the session’s high price after 7:59 PM EST.
Entry price: Just above the session high (e.g., add a small buffer, like 0.1–0.5%, to avoid false breakouts, depending on volatility).
Short (Sell) Entry: Enter a short position when the price breaks below the session’s low price after 7:59 PM EST.
Entry price: Just below the session low (e.g., subtract a small buffer, like 0.1–0.5%).
Confirmation: Use a candlestick close above/below the breakout level to confirm the entry.
Optionally, add volume confirmation or a momentum indicator (e.g., RSI or MACD) to filter out weak breakouts.
Position Size: Calculate position size based on risk tolerance (e.g., 1–2% of account per trade).
Risk is determined by the stop-loss distance (10 points, as defined in the script).
4. Exit Rules Take-Profit Levels (in points, based on script inputs):TP1: 12 points (1.2:1 R:R).
TP2: 22 points (2.2:1 R:R).
TP3: 32 points (3.2:1 R:R).
TP4: 42 points (4.2:1 R:R).
TP5: 52 points (5.2:1 R:R).
Example for Long: If session high is 3000, TP levels are 3012, 3022, 3032, 3042, 3052.
Example for Short: If session low is 2950, TP levels are 2938, 2928, 2918, 2908, 2898.
Strategy: Scale out of the position (e.g., close 20% at TP1, 20% at TP2, etc.) or take full profit at a preferred TP level based on market conditions.
Stop-Loss: Fixed at 10 points from the entry.
Long SL: Session high - 10 points (e.g., entry at 3000, SL at 2990).
Short SL: Session low + 10 points (e.g., entry at 2950, SL at 2960).
Trailing Stop (Optional):After reaching TP2 or TP3, consider trailing the stop to lock in profits (e.g., trail by 10–15 points below the current price).
5. Risk Management per Trade: Limit risk to 1–2% of your trading account per trade.
Calculate position size: Account Size × Risk % ÷ (Stop-Loss Distance × ETH Price per Point).
Example: $10,000 account, 1% risk = $100. If SL = 10 points and 1 point = $1, position size = $100 ÷ 10 = 0.1 ETH.
Daily Risk Limit: Cap daily losses at 3–5% of the account to avoid overtrading.
Maximum Exposure: Avoid taking both long and short positions simultaneously unless using separate accounts or strategies.
Volatility Consideration: Adjust position size during high-volatility periods (e.g., major news events like Ethereum upgrades or macroeconomic announcements).
6. Trade Management Monitoring :Watch for breakouts after 7:59 PM EST.
Monitor price action near TP and SL levels using alerts or manual checks.
Trade Duration: Breakout lines extend for 30 bars (script parameter). Close trades if no TP or SL is hit within this period, or reassess based on market conditions.
Adjustments: If the market shows strong momentum, consider holding beyond TP5 with a trailing stop.
If the breakout fails (e.g., price reverses before TP1), exit early to minimize losses.
7. Additional Considerations Market Conditions: The 7:00 PM–7:59 PM EST session aligns with the Asian market open (e.g., Tokyo Stock Exchange open at 9:00 AM JST), which may introduce higher volatility due to Asian trading activity.
Avoid trading during low-liquidity periods or extreme volatility (e.g., major crypto news).
Check for upcoming events (e.g., Ethereum network upgrades, ETF decisions) that could impact price.
Backtesting: Test the strategy on historical ETH data using the session high/low breakouts for the 7:00 PM–7:59 PM EST window to validate performance.
Adjust TP/SL levels based on backtest results if needed.
Broker and Fees: Use a low-fee crypto exchange (e.g., Binance, Kraken, Coinbase Pro) to maximize R:R.
Account for trading fees and slippage in your position sizing.
Time zone Adjustment: Adjust session time input for your time zone (e.g., "0000-0059" for GMT).
Ensure your trading platform’s clock aligns with the script’s time zone (default: America/New_York).
8. Example Trade Scenario: Session (7:00 PM–7:59 PM EST) records a high of 3050 and a low of 3000.
Long Trade: Entry: Price breaks above 3050 (e.g., enter at 3051).
TP Levels: 3063 (TP1), 3073 (TP2), 3083 (TP3), 3093 (TP4), 3103 (TP5).
SL: 3040 (3050 - 10).
Position Size: For a $10,000 account, 1% risk = $100. SL = 11 points ($11). Size = $100 ÷ 11 = ~0.09 ETH.
Short Trade: Entry: Price breaks below 3000 (e.g., enter at 2999).
TP Levels: 2987 (TP1), 2977 (TP2), 2967 (TP3), 2957 (TP4), 2947 (TP5).
SL: 3010 (3000 + 10).
Position Size: Same as above, ~0.09 ETH.
Execution: Set alerts for breakouts, enter with limit orders, and monitor TPs/SL.
9. Tools and Setup Platform: Use TradingView to implement the Pine Script and visualize breakout levels.
Alerts: Set price alerts for breakouts above the session high or below the session low after 7:59 PM EST.
Set alerts for TP and SL levels.
Chart Settings: Use a 1-minute or 5-minute chart for precise session tracking.
Overlay the script to see high/low lines, TP levels, and SL levels.
Optional Indicators: Add RSI (e.g., avoid overbought/oversold breakouts) or volume to confirm breakouts.
10. Risk Warnings Crypto Volatility: ETH is highly volatile; unexpected news can cause rapid price swings.
False Breakouts: Breakouts may fail, especially in low-volume sessions. Use confirmation signals.
Leverage: Avoid high leverage (e.g., >5x) to prevent liquidation during volatile moves.
Session Accuracy: Ensure correct session timing for your time zone to avoid misaligned entries.
11. Performance Tracking Journaling :Record each trade’s entry, exit, R:R, and outcome.
Note market conditions (e.g., trending, ranging, news-driven).
Review: Weekly: Assess win rate, average R:R, and adherence to the plan.
Monthly: Adjust TP/SL or session timing based on performance.

ai quant oculusAI QUANT OCULUS
Version 1.0 | Pine Script v6
Purpose & Innovation
AI QUANT OCULUS integrates four distinct technical concepts—exponential trend filtering, adaptive smoothing, momentum oscillation, and Gaussian smoothing—into a single, cohesive system that delivers clear, objective buy and sell signals along with automatically plotted stop-loss and three profit-target levels. This mash-up goes beyond a simple EMA crossover or standalone TRIX oscillator by requiring confluence across trend, adaptive moving averages, momentum direction, and smoothed price action, reducing false triggers and focusing on high‐probability turning points.
How It Works & Why Its Components Matter
Trend Filter: EMA vs. Adaptive MA
EMA (20) measures the prevailing trend with fixed sensitivity.
Adaptive MA (also EMA-based, length 10) approximates a faster-responding moving average, standing in for a KAMA-style filter.
Bullish bias requires AMA > EMA; bearish bias requires AMA < EMA. This ensures signals align with both the underlying trend and a more nimble view of recent price action.
Momentum Confirmation: TRIX
Calculates a triple-smoothed EMA of price over TRIX Length (15), then converts it to a percentage rate-of-change oscillator.
Positive TRIX reinforces bullish entries; negative TRIX reinforces bearish entries. Using TRIX helps filter whipsaws by focusing on sustained momentum shifts.
Gaussian Price Smoother
Applies two back-to-back 5-period EMAs to the price (“gaussian” smoothing) to remove short-term noise.
Price above the smoothed line confirms strength for longs; below confirms weakness for shorts. This layer avoids entries on erratic spikes.
Confluence Signals
Buy Signal (isBull) fires only when:
AMA > EMA (trend alignment)
TRIX > 0 (momentum support)
Close > Gaussian (price strength)
Sell Signal (isBear) fires under the inverse conditions.
Requiring all three conditions simultaneously sharply reduces false triggers common to single-indicator systems.
Automatic Risk & Reward Plotting
On each new buy or sell signal (edge detection via not isBull or not isBear ), the script:
Stores entryPrice at the signal bar’s close.
Draws a stop-loss line at entry minus ATR(14) × Stop Multiplier (1.5) by default.
Plots three profit-target lines at entry plus ATR × Target Multiplier (1×, 1.5×, and 2×).
All previous labels and lines are deleted on each new signal, keeping the chart uncluttered and focusing only on the current trade.
Inputs & Customization
Input Description Default
EMA Length Period for the main trend EMA 20
Adaptive MA Length Period for the faster adaptive EM A substitute 10
TRIX Length Period for the triple-smoothed momentum oscillator 15
Dominant Cycle Length (Reserved) 40
Stop Multiplier ATR multiple for stop-loss distance 1.5
Target Multiplier ATR multiple for first profit target 1.5
Show Buy/Sell Signals Toggle on-chart labels for entry signals On
How to Use
Apply to Chart: Best on 15 m–1 h timeframes for swing entries or 5 m for agile scalps.
Wait for Full Confluence:
Look for the AMA to cross above/below the EMA and verify TRIX and Gaussian conditions on the same bar.
A bright “LONG” or “SHORT” label marks your entry.
Manage the Trade:
Place your stop where the red or green SL line appears.
Scale or exit at the three yellow TP1/TP2/TP3 lines, automatically drawn by volatility.
Repeat Cleanly: Each new signal clears prior annotations, ensuring you only track the active setup.
Why This Script Stands Out
Multi-Layer Confluence: Trend, momentum, and noise-reduction must all align, addressing the weaknesses of single-indicator strategies.
Automated Trade Management: No manual plotting—stop and target lines appear seamlessly with each signal.
Transparent & Customizable: All logic is open, adjustable, and clearly documented, allowing traders to tweak lengths and multipliers to suit different instruments.
Disclaimer
No indicator guarantees profit. Always backtest AI QUANT OCULUS extensively, combine its signals with your own analysis and risk controls, and practice sound money management before trading live.

TrailingStopLibraryLibrary "TrailingStopLibrary"
专业移动止盈库 - 为Pine Script策略提供完整的追踪止盈功能。支持做多做空双向交易,基于风险回报比智能激活,提供收盘价和高低价两种判断模式。包含完整的状态管理、调试信息和易用的API接口。适用于股票、外汇、加密货币等各种市场的风险管理。
@version 1.0
@author runto2006
new_config(enabled, activation_ratio, pullback_percent, price_type)
创建移动止盈配置对象
Parameters:
enabled (bool) : (bool) 是否启用移动止盈,默认true
activation_ratio (float) : (float) 激活盈亏比,默认4.0,表示盈利4倍止损距离时激活
pullback_percent (float) : (float) 回撤百分比,默认1.0,表示回撤1%时触发止盈
price_type (string) : (string) 价格类型,默认"close"。"close"=收盘价模式,"hl"=高低价模式
Returns: Config 配置对象
new_state()
创建移动止盈状态对象
Returns: State 初始化的状态对象
reset(state)
重置移动止盈状态
Parameters:
state (State) : (State) 要重置的状态对象
Returns: void
calc_activation_target(entry_price, stop_price, activation_ratio, is_long)
计算激活目标价格
Parameters:
entry_price (float) : (float) 入场价格
stop_price (float) : (float) 止损价格
activation_ratio (float) : (float) 激活盈亏比
is_long (bool) : (bool) 是否为多头持仓
Returns: float 激活目标价格,如果输入无效则返回na
get_check_price(price_type, is_long, for_activation)
获取用于判断的价格
Parameters:
price_type (string) : (string) 价格类型:"close"或"hl"
is_long (bool) : (bool) 是否为多头持仓
for_activation (bool) : (bool) 是否用于激活判断,影响高低价的选择方向
Returns: float 当前判断价格
check_activation(config, state, entry_price, stop_price, is_long, has_position)
检查是否应该激活移动止盈
Parameters:
config (Config) : (Config) 移动止盈配置
state (State) : (State) 移动止盈状态
entry_price (float) : (float) 入场价格
stop_price (float) : (float) 止损价格
is_long (bool) : (bool) 是否为多头持仓
has_position (bool) : (bool) 是否有持仓
Returns: bool 是否成功激活
update_tracking(config, state, is_long)
更新移动止盈的追踪价格
Parameters:
config (Config) : (Config) 移动止盈配置
state (State) : (State) 移动止盈状态
is_long (bool) : (bool) 是否为多头持仓
Returns: void
check_trigger(config, state, entry_price, is_long)
检查是否触发移动止盈
Parameters:
config (Config) : (Config) 移动止盈配置
state (State) : (State) 移动止盈状态
entry_price (float) : (float) 入场价格
is_long (bool) : (bool) 是否为多头持仓
Returns: bool 是否触发止盈
process(config, state, entry_price, stop_price, is_long, has_position)
一体化处理移动止盈逻辑
Parameters:
config (Config) : (Config) 移动止盈配置
state (State) : (State) 移动止盈状态
entry_price (float) : (float) 入场价格
stop_price (float) : (float) 止损价格
is_long (bool) : (bool) 是否为多头持仓
has_position (bool) : (bool) 是否有持仓
Returns: bool 是否触发止盈
get_trigger_price(config, state, is_long)
获取当前触发价格
Parameters:
config (Config) : (Config) 移动止盈配置
state (State) : (State) 移动止盈状态
is_long (bool) : (bool) 是否为多头持仓
Returns: float 触发价格,未激活时返回na
get_pullback_percent(config, state, entry_price, is_long)
计算当前回撤百分比
Parameters:
config (Config) : (Config) 移动止盈配置
state (State) : (State) 移动止盈状态
entry_price (float) : (float) 入场价格
is_long (bool) : (bool) 是否为多头持仓
Returns: float 当前回撤百分比,未激活时返回na
get_status_info(config, state, entry_price, is_long)
获取状态信息字符串(用于调试)
Parameters:
config (Config) : (Config) 移动止盈配置
state (State) : (State) 移动止盈状态
entry_price (float) : (float) 入场价格
is_long (bool) : (bool) 是否为多头持仓
Returns: string 详细的状态信息
Config
移动止盈配置对象
Fields:
enabled (series bool) : (bool) 是否启用移动止盈功能
activation_ratio (series float) : (float) 激活盈亏比 - 盈利达到止损距离的多少倍时激活追踪
pullback_percent (series float) : (float) 回撤百分比 - 从最优价格回撤多少百分比时触发止盈
price_type (series string) : (string) 价格判断类型 - "close"使用收盘价,"hl"使用高低价
State
移动止盈状态对象
Fields:
activated (series bool) : (bool) 是否已激活追踪止盈
highest_price (series float) : (float) 激活后记录的最高价格
lowest_price (series float) : (float) 激活后记录的最低价格
activation_target (series float) : (float) 激活目标价格

CNTLibraryLibrary "CNTLibrary"
Custom Functions To Help Code In Pinescript V5
Coded By Christian Nataliano
First Coded In 10/06/2023
Last Edited In 22/06/2023
Huge Shout Out To © ZenAndTheArtOfTrading and his ZenLibrary V5, Some Of The Custom Functions Were Heavily Inspired By Matt's Work & His Pine Script Mastery Course
Another Shout Out To The TradingView's Team Library ta V5
//====================================================================================================================================================
// Custom Indicator Functions
//====================================================================================================================================================
GetKAMA(KAMA_lenght, Fast_KAMA, Slow_KAMA)
Calculates An Adaptive Moving Average Based On Perry J Kaufman's Calculations
Parameters:
KAMA_lenght (int) : Is The KAMA Lenght
Fast_KAMA (int) : Is The KAMA's Fastes Moving Average
Slow_KAMA (int) : Is The KAMA's Slowest Moving Average
Returns: Float Of The KAMA's Current Calculations
GetMovingAverage(Source, Lenght, Type)
Get Custom Moving Averages Values
Parameters:
Source (float) : Of The Moving Average, Defval = close
Lenght (simple int) : Of The Moving Average, Defval = 50
Type (string) : Of The Moving Average, Defval = Exponential Moving Average
Returns: The Moving Average Calculation Based On Its Given Source, Lenght & Calculation Type (Please Call Function On Global Scope)
GetDecimals()
Calculates how many decimals are on the quote price of the current market © ZenAndTheArtOfTrading
Returns: The current decimal places on the market quote price
Truncate(number, decimalPlaces)
Truncates (cuts) excess decimal places © ZenAndTheArtOfTrading
Parameters:
number (float)
decimalPlaces (simple float)
Returns: The given number truncated to the given decimalPlaces
ToWhole(number)
Converts pips into whole numbers © ZenAndTheArtOfTrading
Parameters:
number (float)
Returns: The converted number
ToPips(number)
Converts whole numbers back into pips © ZenAndTheArtOfTrading
Parameters:
number (float)
Returns: The converted number
GetPctChange(value1, value2, lookback)
Gets the percentage change between 2 float values over a given lookback period © ZenAndTheArtOfTrading
Parameters:
value1 (float)
value2 (float)
lookback (int)
BarsAboveMA(lookback, ma)
Counts how many candles are above the MA © ZenAndTheArtOfTrading
Parameters:
lookback (int)
ma (float)
Returns: The bar count of how many recent bars are above the MA
BarsBelowMA(lookback, ma)
Counts how many candles are below the MA © ZenAndTheArtOfTrading
Parameters:
lookback (int)
ma (float)
Returns: The bar count of how many recent bars are below the EMA
BarsCrossedMA(lookback, ma)
Counts how many times the EMA was crossed recently © ZenAndTheArtOfTrading
Parameters:
lookback (int)
ma (float)
Returns: The bar count of how many times price recently crossed the EMA
GetPullbackBarCount(lookback, direction)
Counts how many green & red bars have printed recently (ie. pullback count) © ZenAndTheArtOfTrading
Parameters:
lookback (int)
direction (int)
Returns: The bar count of how many candles have retraced over the given lookback & direction
GetSwingHigh(Lookback, SwingType)
Check If Price Has Made A Recent Swing High
Parameters:
Lookback (int) : Is For The Swing High Lookback Period, Defval = 7
SwingType (int) : Is For The Swing High Type Of Identification, Defval = 1
Returns: A Bool - True If Price Has Made A Recent Swing High
GetSwingLow(Lookback, SwingType)
Check If Price Has Made A Recent Swing Low
Parameters:
Lookback (int) : Is For The Swing Low Lookback Period, Defval = 7
SwingType (int) : Is For The Swing Low Type Of Identification, Defval = 1
Returns: A Bool - True If Price Has Made A Recent Swing Low
//====================================================================================================================================================
// Custom Risk Management Functions
//====================================================================================================================================================
CalculateStopLossLevel(OrderType, Entry, StopLoss)
Calculate StopLoss Level
Parameters:
OrderType (int) : Is To Determine A Long / Short Position, Defval = 1
Entry (float) : Is The Entry Level Of The Order, Defval = na
StopLoss (float) : Is The Custom StopLoss Distance, Defval = 2x ATR Below Close
Returns: Float - The StopLoss Level In Actual Price As A
CalculateStopLossDistance(OrderType, Entry, StopLoss)
Calculate StopLoss Distance In Pips
Parameters:
OrderType (int) : Is To Determine A Long / Short Position, Defval = 1
Entry (float) : Is The Entry Level Of The Order, NEED TO INPUT PARAM
StopLoss (float) : Level Based On Previous Calculation, NEED TO INPUT PARAM
Returns: Float - The StopLoss Value In Pips
CalculateTakeProfitLevel(OrderType, Entry, StopLossDistance, RiskReward)
Calculate TakeProfit Level
Parameters:
OrderType (int) : Is To Determine A Long / Short Position, Defval = 1
Entry (float) : Is The Entry Level Of The Order, Defval = na
StopLossDistance (float)
RiskReward (float)
Returns: Float - The TakeProfit Level In Actual Price
CalculateTakeProfitDistance(OrderType, Entry, TakeProfit)
Get TakeProfit Distance In Pips
Parameters:
OrderType (int) : Is To Determine A Long / Short Position, Defval = 1
Entry (float) : Is The Entry Level Of The Order, NEED TO INPUT PARAM
TakeProfit (float) : Level Based On Previous Calculation, NEED TO INPUT PARAM
Returns: Float - The TakeProfit Value In Pips
CalculateConversionCurrency(AccountCurrency, SymbolCurrency, BaseCurrency)
Get The Conversion Currecny Between Current Account Currency & Current Pair's Quoted Currency (FOR FOREX ONLY)
Parameters:
AccountCurrency (simple string) : Is For The Account Currency Used
SymbolCurrency (simple string) : Is For The Current Symbol Currency (Front Symbol)
BaseCurrency (simple string) : Is For The Current Symbol Base Currency (Back Symbol)
Returns: Tuple Of A Bollean (Convert The Currency ?) And A String (Converted Currency)
CalculateConversionRate(ConvertCurrency, ConversionRate)
Get The Conversion Rate Between Current Account Currency & Current Pair's Quoted Currency (FOR FOREX ONLY)
Parameters:
ConvertCurrency (bool) : Is To Check If The Current Symbol Needs To Be Converted Or Not
ConversionRate (float) : Is The Quoted Price Of The Conversion Currency (Input The request.security Function Here)
Returns: Float Price Of Conversion Rate (If In The Same Currency Than Return Value Will Be 1.0)
LotSize(LotSizeSimple, Balance, Risk, SLDistance, ConversionRate)
Get Current Lot Size
Parameters:
LotSizeSimple (bool) : Is To Toggle Lot Sizing Calculation (Simple Is Good Enough For Stocks & Crypto, Whilst Complex Is For Forex)
Balance (float) : Is For The Current Account Balance To Calculate The Lot Sizing Based Off
Risk (float) : Is For The Current Risk Per Trade To Calculate The Lot Sizing Based Off
SLDistance (float) : Is The Current Position StopLoss Distance From Its Entry Price
ConversionRate (float) : Is The Currency Conversion Rate (Used For Complex Lot Sizing Only)
Returns: Float - Position Size In Units
ToLots(Units)
Converts Units To Lots
Parameters:
Units (float) : Is For How Many Units Need To Be Converted Into Lots (Minimun 1000 Units)
Returns: Float - Position Size In Lots
ToUnits(Lots)
Converts Lots To Units
Parameters:
Lots (float) : Is For How Many Lots Need To Be Converted Into Units (Minimun 0.01 Units)
Returns: Int - Position Size In Units
ToLotsInUnits(Units)
Converts Units To Lots Than Back To Units
Parameters:
Units (float) : Is For How Many Units Need To Be Converted Into Lots (Minimun 1000 Units)
Returns: Float - Position Size In Lots That Were Rounded To Units
ATRTrail(OrderType, SourceType, ATRPeriod, ATRMultiplyer, SwingLookback)
Calculate ATR Trailing Stop
Parameters:
OrderType (int) : Is To Determine A Long / Short Position, Defval = 1
SourceType (int) : Is To Determine Where To Calculate The ATR Trailing From, Defval = close
ATRPeriod (simple int) : Is To Change Its ATR Period, Defval = 20
ATRMultiplyer (float) : Is To Change Its ATR Trailing Distance, Defval = 1
SwingLookback (int) : Is To Change Its Swing HiLo Lookback (Only From Source Type 5), Defval = 7
Returns: Float - Number Of The Current ATR Trailing
DangerZone(WinRate, AvgRRR, Filter)
Calculate Danger Zone Of A Given Strategy
Parameters:
WinRate (float) : Is The Strategy WinRate
AvgRRR (float) : Is The Strategy Avg RRR
Filter (float) : Is The Minimum Profit It Needs To Be Out Of BE Zone, Defval = 3
Returns: Int - Value, 1 If Out Of Danger Zone, 0 If BE, -1 If In Danger Zone
IsQuestionableTrades(TradeTP, TradeSL)
Checks For Questionable Trades (Which Are Trades That Its TP & SL Level Got Hit At The Same Candle)
Parameters:
TradeTP (float) : Is The Trade In Question Take Profit Level
TradeSL (float) : Is The Trade In Question Stop Loss Level
Returns: Bool - True If The Last Trade Was A "Questionable Trade"
//====================================================================================================================================================
// Custom Strategy Functions
//====================================================================================================================================================
OpenLong(EntryID, LotSize, LimitPrice, StopPrice, Comment, CommentValue)
Open A Long Order Based On The Given Params
Parameters:
EntryID (string) : Is The Trade Entry ID, Defval = "Long"
LotSize (float) : Is The Lot Size Of The Trade, Defval = 1
LimitPrice (float) : Is The Limit Order Price To Set The Order At, Defval = Na / Market Order Execution
StopPrice (float) : Is The Stop Order Price To Set The Order At, Defval = Na / Market Order Execution
Comment (string) : Is The Order Comment, Defval = Long Entry Order
CommentValue (string) : Is For Custom Values In The Order Comment, Defval = Na
Returns: Void
OpenShort(EntryID, LotSize, LimitPrice, StopPrice, Comment, CommentValue)
Open A Short Order Based On The Given Params
Parameters:
EntryID (string) : Is The Trade Entry ID, Defval = "Short"
LotSize (float) : Is The Lot Size Of The Trade, Defval = 1
LimitPrice (float) : Is The Limit Order Price To Set The Order At, Defval = Na / Market Order Execution
StopPrice (float) : Is The Stop Order Price To Set The Order At, Defval = Na / Market Order Execution
Comment (string) : Is The Order Comment, Defval = Short Entry Order
CommentValue (string) : Is For Custom Values In The Order Comment, Defval = Na
Returns: Void
TP_SLExit(FromID, TPLevel, SLLevel, PercentageClose, Comment, CommentValue)
Exits Based On Predetermined TP & SL Levels
Parameters:
FromID (string) : Is The Trade ID That The TP & SL Levels Be Palced
TPLevel (float) : Is The Take Profit Level
SLLevel (float) : Is The StopLoss Level
PercentageClose (float) : Is The Amount To Close The Order At (In Percentage) Defval = 100
Comment (string) : Is The Order Comment, Defval = Exit Order
CommentValue (string) : Is For Custom Values In The Order Comment, Defval = Na
Returns: Void
CloseLong(ExitID, PercentageClose, Comment, CommentValue, Instant)
Exits A Long Order Based On A Specified Condition
Parameters:
ExitID (string) : Is The Trade ID That Will Be Closed, Defval = "Long"
PercentageClose (float) : Is The Amount To Close The Order At (In Percentage) Defval = 100
Comment (string) : Is The Order Comment, Defval = Exit Order
CommentValue (string) : Is For Custom Values In The Order Comment, Defval = Na
Instant (bool) : Is For Exit Execution Type, Defval = false
Returns: Void
CloseShort(ExitID, PercentageClose, Comment, CommentValue, Instant)
Exits A Short Order Based On A Specified Condition
Parameters:
ExitID (string) : Is The Trade ID That Will Be Closed, Defval = "Short"
PercentageClose (float) : Is The Amount To Close The Order At (In Percentage) Defval = 100
Comment (string) : Is The Order Comment, Defval = Exit Order
CommentValue (string) : Is For Custom Values In The Order Comment, Defval = Na
Instant (bool) : Is For Exit Execution Type, Defval = false
Returns: Void
BrokerCheck(Broker)
Checks Traded Broker With Current Loaded Chart Broker
Parameters:
Broker (string) : Is The Current Broker That Is Traded
Returns: Bool - True If Current Traded Broker Is Same As Loaded Chart Broker
OpenPC(LicenseID, OrderType, UseLimit, LimitPrice, SymbolPrefix, Symbol, SymbolSuffix, Risk, SL, TP, OrderComment, Spread)
Compiles Given Parameters Into An Alert String Format To Open Trades Using Pine Connector
Parameters:
LicenseID (string) : Is The Users PineConnector LicenseID
OrderType (int) : Is The Desired OrderType To Open
UseLimit (bool) : Is If We Want To Enter The Position At Exactly The Previous Closing Price
LimitPrice (float) : Is The Limit Price Of The Trade (Only For Pending Orders)
SymbolPrefix (string) : Is The Current Symbol Prefix (If Any)
Symbol (string) : Is The Traded Symbol
SymbolSuffix (string) : Is The Current Symbol Suffix (If Any)
Risk (float) : Is The Trade Risk Per Trade / Fixed Lot Sizing
SL (float) : Is The Trade SL In Price / In Pips
TP (float) : Is The Trade TP In Price / In Pips
OrderComment (string) : Is The Executed Trade Comment
Spread (float) : is The Maximum Spread For Execution
Returns: String - Pine Connector Order Syntax Alert Message
ClosePC(LicenseID, OrderType, SymbolPrefix, Symbol, SymbolSuffix)
Compiles Given Parameters Into An Alert String Format To Close Trades Using Pine Connector
Parameters:
LicenseID (string) : Is The Users PineConnector LicenseID
OrderType (int) : Is The Desired OrderType To Close
SymbolPrefix (string) : Is The Current Symbol Prefix (If Any)
Symbol (string) : Is The Traded Symbol
SymbolSuffix (string) : Is The Current Symbol Suffix (If Any)
Returns: String - Pine Connector Order Syntax Alert Message
//====================================================================================================================================================
// Custom Backtesting Calculation Functions
//====================================================================================================================================================
CalculatePNL(EntryPrice, ExitPrice, LotSize, ConversionRate)
Calculates Trade PNL Based On Entry, Eixt & Lot Size
Parameters:
EntryPrice (float) : Is The Trade Entry
ExitPrice (float) : Is The Trade Exit
LotSize (float) : Is The Trade Sizing
ConversionRate (float) : Is The Currency Conversion Rate (Used For Complex Lot Sizing Only)
Returns: Float - The Current Trade PNL
UpdateBalance(PrevBalance, PNL)
Updates The Previous Ginve Balance To The Next PNL
Parameters:
PrevBalance (float) : Is The Previous Balance To Be Updated
PNL (float) : Is The Current Trade PNL To Be Added
Returns: Float - The Current Updated PNL
CalculateSlpComm(PNL, MaxRate)
Calculates Random Slippage & Commisions Fees Based On The Parameters
Parameters:
PNL (float) : Is The Current Trade PNL
MaxRate (float) : Is The Upper Limit (In Percentage) Of The Randomized Fee
Returns: Float - A Percentage Fee Of The Current Trade PNL
UpdateDD(MaxBalance, Balance)
Calculates & Updates The DD Based On Its Given Parameters
Parameters:
MaxBalance (float) : Is The Maximum Balance Ever Recorded
Balance (float) : Is The Current Account Balance
Returns: Float - The Current Strategy DD
CalculateWR(TotalTrades, LongID, ShortID)
Calculate The Total, Long & Short Trades Win Rate
Parameters:
TotalTrades (int) : Are The Current Total Trades That The Strategy Has Taken
LongID (string) : Is The Order ID Of The Long Trades Of The Strategy
ShortID (string) : Is The Order ID Of The Short Trades Of The Strategy
Returns: Tuple Of Long WR%, Short WR%, Total WR%, Total Winning Trades, Total Losing Trades, Total Long Trades & Total Short Trades
CalculateAvgRRR(WinTrades, LossTrades)
Calculates The Overall Strategy Avg Risk Reward Ratio
Parameters:
WinTrades (int) : Are The Strategy Winning Trades
LossTrades (int) : Are The Strategy Losing Trades
Returns: Float - The Average RRR Values
CAGR(StartTime, StartPrice, EndTime, EndPrice)
Calculates The CAGR Over The Given Time Period © TradingView
Parameters:
StartTime (int) : Is The Starting Time Of The Calculation
StartPrice (float) : Is The Starting Price Of The Calculation
EndTime (int) : Is The Ending Time Of The Calculation
EndPrice (float) : Is The Ending Price Of The Calculation
Returns: Float - The CAGR Values
//====================================================================================================================================================
// Custom Plot Functions
//====================================================================================================================================================
EditLabels(LabelID, X1, Y1, Text, Color, TextColor, EditCondition, DeleteCondition)
Edit / Delete Labels
Parameters:
LabelID (label) : Is The ID Of The Selected Label
X1 (int) : Is The X1 Coordinate IN BARINDEX Xloc
Y1 (float) : Is The Y1 Coordinate IN PRICE Yloc
Text (string) : Is The Text Than Wants To Be Written In The Label
Color (color) : Is The Color Value Change Of The Label Text
TextColor (color)
EditCondition (int) : Is The Edit Condition of The Line (Setting Location / Color)
DeleteCondition (bool) : Is The Delete Condition Of The Line If Ture Deletes The Prev Itteration Of The Line
Returns: Void
EditLine(LineID, X1, Y1, X2, Y2, Color, EditCondition, DeleteCondition)
Edit / Delete Lines
Parameters:
LineID (line) : Is The ID Of The Selected Line
X1 (int) : Is The X1 Coordinate IN BARINDEX Xloc
Y1 (float) : Is The Y1 Coordinate IN PRICE Yloc
X2 (int) : Is The X2 Coordinate IN BARINDEX Xloc
Y2 (float) : Is The Y2 Coordinate IN PRICE Yloc
Color (color) : Is The Color Value Change Of The Line
EditCondition (int) : Is The Edit Condition of The Line (Setting Location / Color)
DeleteCondition (bool) : Is The Delete Condition Of The Line If Ture Deletes The Prev Itteration Of The Line
Returns: Void
//====================================================================================================================================================
// Custom Display Functions (Using Tables)
//====================================================================================================================================================
FillTable(TableID, Column, Row, Title, Value, BgColor, TextColor, ToolTip)
Filling The Selected Table With The Inputed Information
Parameters:
TableID (table) : Is The Table ID That Wants To Be Edited
Column (int) : Is The Current Column Of The Table That Wants To Be Edited
Row (int) : Is The Current Row Of The Table That Wants To Be Edited
Title (string) : Is The String Title Of The Current Cell Table
Value (string) : Is The String Value Of The Current Cell Table
BgColor (color) : Is The Selected Color For The Current Table
TextColor (color) : Is The Selected Color For The Current Table
ToolTip (string) : Is The ToolTip Of The Current Cell In The Table
Returns: Void
DisplayBTResults(TableID, BgColor, TextColor, StartingBalance, Balance, DollarReturn, TotalPips, MaxDD)
Filling The Selected Table With The Inputed Information
Parameters:
TableID (table) : Is The Table ID That Wants To Be Edited
BgColor (color) : Is The Selected Color For The Current Table
TextColor (color) : Is The Selected Color For The Current Table
StartingBalance (float) : Is The Account Starting Balance
Balance (float)
DollarReturn (float) : Is The Account Dollar Reture
TotalPips (float) : Is The Total Pips Gained / loss
MaxDD (float) : Is The Maximum Drawdown Over The Backtesting Period
Returns: Void
DisplayBTResultsV2(TableID, BgColor, TextColor, TotalWR, QTCount, LongWR, ShortWR, InitialCapital, CumProfit, CumFee, AvgRRR, MaxDD, CAGR, MeanDD)
Filling The Selected Table With The Inputed Information
Parameters:
TableID (table) : Is The Table ID That Wants To Be Edited
BgColor (color) : Is The Selected Color For The Current Table
TextColor (color) : Is The Selected Color For The Current Table
TotalWR (float) : Is The Strategy Total WR In %
QTCount (int) : Is The Strategy Questionable Trades Count
LongWR (float) : Is The Strategy Total WR In %
ShortWR (float) : Is The Strategy Total WR In %
InitialCapital (float) : Is The Strategy Initial Starting Capital
CumProfit (float) : Is The Strategy Ending Cumulative Profit
CumFee (float) : Is The Strategy Ending Cumulative Fee (Based On Randomized Fee Assumptions)
AvgRRR (float) : Is The Strategy Average Risk Reward Ratio
MaxDD (float) : Is The Strategy Maximum DrawDown In Its Backtesting Period
CAGR (float) : Is The Strategy Compounded Average GRowth In %
MeanDD (float) : Is The Strategy Mean / Average Drawdown In The Backtesting Period
Returns: Void
//====================================================================================================================================================
// Custom Pattern Detection Functions
//====================================================================================================================================================
BullFib(priceLow, priceHigh, fibRatio)
Calculates A Bullish Fibonacci Value (From Swing Low To High) © ZenAndTheArtOfTrading
Parameters:
priceLow (float)
priceHigh (float)
fibRatio (float)
Returns: The Fibonacci Value Of The Given Ratio Between The Two Price Points
BearFib(priceLow, priceHigh, fibRatio)
Calculates A Bearish Fibonacci Value (From Swing High To Low) © ZenAndTheArtOfTrading
Parameters:
priceLow (float)
priceHigh (float)
fibRatio (float)
Returns: The Fibonacci Value Of The Given Ratio Between The Two Price Points
GetBodySize()
Gets The Current Candle Body Size IN POINTS © ZenAndTheArtOfTrading
Returns: The Current Candle Body Size IN POINTS
GetTopWickSize()
Gets The Current Candle Top Wick Size IN POINTS © ZenAndTheArtOfTrading
Returns: The Current Candle Top Wick Size IN POINTS
GetBottomWickSize()
Gets The Current Candle Bottom Wick Size IN POINTS © ZenAndTheArtOfTrading
Returns: The Current Candle Bottom Wick Size IN POINTS
GetBodyPercent()
Gets The Current Candle Body Size As A Percentage Of Its Entire Size Including Its Wicks © ZenAndTheArtOfTrading
Returns: The Current Candle Body Size IN PERCENTAGE
GetTopWickPercent()
Gets The Current Top Wick Size As A Percentage Of Its Entire Body Size
Returns: Float - The Current Candle Top Wick Size IN PERCENTAGE
GetBottomWickPercent()
Gets The Current Bottom Wick Size As A Percentage Of Its Entire Bodu Size
Returns: Float - The Current Candle Bottom Size IN PERCENTAGE
BullishEC(Allowance, RejectionWickSize, EngulfWick, NearSwings, SwingLookBack)
Checks If The Current Bar Is A Bullish Engulfing Candle
Parameters:
Allowance (int) : To Give Flexibility Of Engulfing Pattern Detection In Markets That Have Micro Gaps, Defval = 0
RejectionWickSize (float) : To Filter Out long (Upper And Lower) Wick From The Bullsih Engulfing Pattern, Defval = na
EngulfWick (bool) : To Specify If We Want The Pattern To Also Engulf Its Upper & Lower Previous Wicks, Defval = false
NearSwings (bool) : To Specify If We Want The Pattern To Be Near A Recent Swing Low, Defval = true
SwingLookBack (int) : To Specify How Many Bars Back To Detect A Recent Swing Low, Defval = 10
Returns: Bool - True If The Current Bar Matches The Requirements of a Bullish Engulfing Candle
BearishEC(Allowance, RejectionWickSize, EngulfWick, NearSwings, SwingLookBack)
Checks If The Current Bar Is A Bearish Engulfing Candle
Parameters:
Allowance (int) : To Give Flexibility Of Engulfing Pattern Detection In Markets That Have Micro Gaps, Defval = 0
RejectionWickSize (float) : To Filter Out long (Upper And Lower) Wick From The Bearish Engulfing Pattern, Defval = na
EngulfWick (bool) : To Specify If We Want The Pattern To Also Engulf Its Upper & Lower Previous Wicks, Defval = false
NearSwings (bool) : To Specify If We Want The Pattern To Be Near A Recent Swing High, Defval = true
SwingLookBack (int) : To Specify How Many Bars Back To Detect A Recent Swing High, Defval = 10
Returns: Bool - True If The Current Bar Matches The Requirements of a Bearish Engulfing Candle
Hammer(Fib, ColorMatch, NearSwings, SwingLookBack, ATRFilterCheck, ATRPeriod)
Checks If The Current Bar Is A Hammer Candle
Parameters:
Fib (float) : To Specify Which Fibonacci Ratio To Use When Determining The Hammer Candle, Defval = 0.382 Ratio
ColorMatch (bool) : To Filter Only Bullish Closed Hammer Candle Pattern, Defval = false
NearSwings (bool) : To Specify If We Want The Doji To Be Near A Recent Swing Low, Defval = true
SwingLookBack (int) : To Specify How Many Bars Back To Detect A Recent Swing Low, Defval = 10
ATRFilterCheck (float) : To Filter Smaller Hammer Candles That Might Be Better Classified As A Doji Candle, Defval = 1
ATRPeriod (simple int) : To Change ATR Period Of The ATR Filter, Defval = 20
Returns: Bool - True If The Current Bar Matches The Requirements of a Hammer Candle
Star(Fib, ColorMatch, NearSwings, SwingLookBack, ATRFilterCheck, ATRPeriod)
Checks If The Current Bar Is A Hammer Candle
Parameters:
Fib (float) : To Specify Which Fibonacci Ratio To Use When Determining The Hammer Candle, Defval = 0.382 Ratio
ColorMatch (bool) : To Filter Only Bullish Closed Hammer Candle Pattern, Defval = false
NearSwings (bool) : To Specify If We Want The Doji To Be Near A Recent Swing Low, Defval = true
SwingLookBack (int) : To Specify How Many Bars Back To Detect A Recent Swing Low, Defval = 10
ATRFilterCheck (float) : To Filter Smaller Hammer Candles That Might Be Better Classified As A Doji Candle, Defval = 1
ATRPeriod (simple int) : To Change ATR Period Of The ATR Filter, Defval = 20
Returns: Bool - True If The Current Bar Matches The Requirements of a Hammer Candle
Doji(MaxWickSize, MaxBodySize, DojiType, NearSwings, SwingLookBack)
Checks If The Current Bar Is A Doji Candle
Parameters:
MaxWickSize (float) : To Specify The Maximum Lenght Of Its Upper & Lower Wick, Defval = 2
MaxBodySize (float) : To Specify The Maximum Lenght Of Its Candle Body IN PERCENT, Defval = 0.05
DojiType (int)
NearSwings (bool) : To Specify If We Want The Doji To Be Near A Recent Swing High / Low (Only In Dragonlyf / Gravestone Mode), Defval = true
SwingLookBack (int) : To Specify How Many Bars Back To Detect A Recent Swing High / Low (Only In Dragonlyf / Gravestone Mode), Defval = 10
Returns: Bool - True If The Current Bar Matches The Requirements of a Doji Candle
BullishIB(Allowance, RejectionWickSize, EngulfWick, NearSwings, SwingLookBack)
Checks If The Current Bar Is A Bullish Harami Candle
Parameters:
Allowance (int) : To Give Flexibility Of Harami Pattern Detection In Markets That Have Micro Gaps, Defval = 0
RejectionWickSize (float) : To Filter Out long (Upper And Lower) Wick From The Bullsih Harami Pattern, Defval = na
EngulfWick (bool) : To Specify If We Want The Pattern To Also Engulf Its Upper & Lower Previous Wicks, Defval = false
NearSwings (bool) : To Specify If We Want The Pattern To Be Near A Recent Swing Low, Defval = true
SwingLookBack (int) : To Specify How Many Bars Back To Detect A Recent Swing Low, Defval = 10
Returns: Bool - True If The Current Bar Matches The Requirements of a Bullish Harami Candle
BearishIB(Allowance, RejectionWickSize, EngulfWick, NearSwings, SwingLookBack)
Checks If The Current Bar Is A Bullish Harami Candle
Parameters:
Allowance (int) : To Give Flexibility Of Harami Pattern Detection In Markets That Have Micro Gaps, Defval = 0
RejectionWickSize (float) : To Filter Out long (Upper And Lower) Wick From The Bearish Harami Pattern, Defval = na
EngulfWick (bool) : To Specify If We Want The Pattern To Also Engulf Its Upper & Lower Previous Wicks, Defval = false
NearSwings (bool) : To Specify If We Want The Pattern To Be Near A Recent Swing High, Defval = true
SwingLookBack (int) : To Specify How Many Bars Back To Detect A Recent Swing High, Defval = 10
Returns: Bool - True If The Current Bar Matches The Requirements of a Bearish Harami Candle
//====================================================================================================================================================
// Custom Time Functions
//====================================================================================================================================================
BarInSession(sess, useFilter)
Determines if the current price bar falls inside the specified session © ZenAndTheArtOfTrading
Parameters:
sess (simple string)
useFilter (bool)
Returns: A boolean - true if the current bar falls within the given time session
BarOutSession(sess, useFilter)
Determines if the current price bar falls outside the specified session © ZenAndTheArtOfTrading
Parameters:
sess (simple string)
useFilter (bool)
Returns: A boolean - true if the current bar falls outside the given time session
DateFilter(startTime, endTime)
Determines if this bar's time falls within date filter range © ZenAndTheArtOfTrading
Parameters:
startTime (int)
endTime (int)
Returns: A boolean - true if the current bar falls within the given dates
DayFilter(monday, tuesday, wednesday, thursday, friday, saturday, sunday)
Checks if the current bar's day is in the list of given days to analyze © ZenAndTheArtOfTrading
Parameters:
monday (bool)
tuesday (bool)
wednesday (bool)
thursday (bool)
friday (bool)
saturday (bool)
sunday (bool)
Returns: A boolean - true if the current bar's day is one of the given days
AUSSess()
Checks If The Current Australian Forex Session In Running
Returns: Bool - True If Currently The Australian Session Is Running
ASIASess()
Checks If The Current Asian Forex Session In Running
Returns: Bool - True If Currently The Asian Session Is Running
EURSess()
Checks If The Current European Forex Session In Running
Returns: Bool - True If Currently The European Session Is Running
USSess()
Checks If The Current US Forex Session In Running
Returns: Bool - True If Currently The US Session Is Running
UNIXToDate(Time, ConversionType, TimeZone)
Converts UNIX Time To Datetime
Parameters:
Time (int) : Is The UNIX Time Input
ConversionType (int) : Is The Datetime Output Format, Defval = DD-MM-YYYY
TimeZone (string) : Is To Convert The Outputed Datetime Into The Specified Time Zone, Defval = Exchange Time Zone
Returns: String - String Of Datetime

Strategy█ OVERVIEW
This library is a Pine Script™ programmer’s tool containing a variety of strategy-related functions to assist in calculations like profit and loss, stop losses and limits. It also includes several useful functions one can use to convert between units in ticks, price, currency or a percentage of the position's size.
█ CONCEPTS
The library contains three types of functions:
1 — Functions beginning with `percent` take either a portion of a price, or the current position's entry price and convert it to the value outlined in the function's documentation.
Example: Converting a percent of the current position entry price to ticks, or calculating a percent profit at a given level for the position.
2 — Functions beginning with `tick` convert a tick value to another form.
These are useful for calculating a price or currency value from a specified number of ticks.
3 — Functions containing `Level` are used to calculate a stop or take profit level using an offset in ticks from the current entry price.
These functions can be used to plot stop or take profit levels on the chart, or as arguments to the `limit` and `stop` parameters in strategy.exit() function calls.
Note that these calculated levels flip automatically with the position's bias.
For example, using `ticksToStopLevel()` will calculate a stop level under the entry price for a long position, and above the entry price for a short position.
There are also two functions to assist in calculating a position size using the entry's stop and a fixed risk expressed as a percentage of the current account's equity. By varying the position size this way, you ensure that entries with different stop levels risk the same proportion of equity.
█ NOTES
Example code using some of the library's functions is included at the end of the library. To see it in action, copy the library's code to a new script in the Pine Editor, and “Add to chart”.
For each trade, the code displays:
• The entry level in orange.
• The stop level in fuchsia.
• The take profit level in green.
The stop and take profit levels automatically flip sides based on whether the current position is long or short.
Labels near the last trade's levels display the percentages used to calculate them, which can be changed in the script's inputs.
We plot markers for entries and exits because strategy code in libraries does not display the usual markers for them.
Look first. Then leap.
█ FUNCTIONS
percentToTicks(percent) Converts a percentage of the average entry price to ticks.
Parameters:
percent : (series int/float) The percentage of `strategy.position_avg_price` to convert to ticks. 50 is 50% of the entry price.
Returns: (float) A value in ticks.
percentToPrice(percent) Converts a percentage of the average entry price to a price.
Parameters:
percent : (series int/float) The percentage of `strategy.position_avg_price` to convert to price. 50 is 50% of the entry price.
Returns: (float) A value in the symbol's quote currency (USD for BTCUSD).
percentToCurrency(price, percent) Converts the percentage of a price to money.
Parameters:
price : (series int/float) The symbol's price.
percent : (series int/float) The percentage of `price` to calculate.
Returns: (float) A value in the symbol's currency.
percentProfit(exitPrice) Calculates the profit (as a percentage of the position's `strategy.position_avg_price` entry price) if the trade is closed at `exitPrice`.
Parameters:
exitPrice : (series int/float) The potential price to close the position.
Returns: (float) Percentage profit for the current position if closed at the `exitPrice`.
priceToTicks(price) Converts a price to ticks.
Parameters:
price : (series int/float) Price to convert to ticks.
Returns: (float) A quantity of ticks.
ticksToPrice(price) Converts ticks to a price offset from the average entry price.
Parameters:
price : (series int/float) Ticks to convert to a price.
Returns: (float) A price level that has a distance from the entry price equal to the specified number of ticks.
ticksToCurrency(ticks) Converts ticks to money.
Parameters:
ticks : (series int/float) Number of ticks.
Returns: (float) Money amount in the symbol's currency.
ticksToStopLevel(ticks) Calculates a stop loss level using a distance in ticks from the current `strategy.position_avg_price` entry price. This value can be plotted on the chart, or used as an argument to the `stop` parameter of a `strategy.exit()` call. NOTE: The stop level automatically flips based on whether the position is long or short.
Parameters:
ticks : (series int/float) The distance in ticks from the entry price to the stop loss level.
Returns: (float) A stop loss level for the current position.
ticksToTpLevel(ticks) Calculates a take profit level using a distance in ticks from the current `strategy.position_avg_price` entry price. This value can be plotted on the chart, or used as an argument to the `limit` parameter of a `strategy.exit()` call. NOTE: The take profit level automatically flips based on whether the position is long or short.
Parameters:
ticks : (series int/float) The distance in ticks from the entry price to the take profit level.
Returns: (float) A take profit level for the current position.
calcPositionSizeByStopLossTicks(stopLossTicks, riskPercent) Calculates the position size needed to implement a given stop loss (in ticks) corresponding to `riskPercent` of equity.
Parameters:
stopLossTicks : (series int) The stop loss (in ticks) that will be used to protect the position.
riskPercent : (series int/float) The maximum risk level as a percent of current equity (`strategy.equity`).
Returns: (int) A quantity of contracts.
calcPositionSizeByStopLossPercent(stopLossPercent, riskPercent, entryPrice) Calculates the position size needed to implement a given stop loss (%) corresponding to `riskPercent` of equity.
Parameters:
stopLossPercent : (series int/float) The stop loss in percent that will be used to protect the position.
riskPercent : (series int/float) The maximum risk level as a percent of current equity (`strategy.equity`).
entryPrice : (series int/float) The entry price of the position.
Returns: (int) A quantity of contracts.
exitPercent(id, lossPercent, profitPercent, qty, qtyPercent, comment, when, alertMessage) A wrapper of the `strategy.exit()` built-in which adds the possibility to specify loss & profit in as a value in percent. NOTE: this function may work incorrectly with pyramiding turned on due to the use of `strategy.position_avg_price` in its calculations of stop loss and take profit offsets.
Parameters:
id : (series string) The order identifier of the `strategy.exit()` call.
lossPercent : (series int/float) Stop loss as a percent of the entry price.
profitPercent : (series int/float) Take profit as a percent of the entry price.
qty : (series int/float) Number of contracts/shares/lots/units to exit a trade with. The default value is `na`.
qtyPercent : (series int/float) The percent of the position's size to exit a trade with. If `qty` is `na`, the default value of `qty_percent` is 100.
comment : (series string) Optional. Additional notes on the order.
when : (series bool) Condition of the order. The order is placed if it is true.
alertMessage : (series string) An optional parameter which replaces the {{strategy.order.alert_message}} placeholder when it is used in the "Create Alert" dialog box's "Message" field.

tradeEngineLibrary "tradeEngine"
calculateLiquidationPrice(entryPrice, isLong, leverage, buffer)
Parameters:
entryPrice (float)
isLong (bool)
leverage (int)
buffer (float)
calculateTPLevels(entryPrice, atr, isLong, risk)
Parameters:
entryPrice (float)
atr (float)
isLong (bool)
risk (RiskConfig)
calculateSL(entryLow, entryHigh, isLong, risk)
Parameters:
entryLow (float)
entryHigh (float)
isLong (bool)
risk (RiskConfig)
simulateTrade(highs, lows, closes, entryIdx, entryPrice, entryLow, entryHigh, entryATR, isLong, risk, maxBars)
Parameters:
highs (array)
lows (array)
closes (array)
entryIdx (int)
entryPrice (float)
entryLow (float)
entryHigh (float)
entryATR (float)
isLong (bool)
risk (RiskConfig)
maxBars (int)
createRiskConfig(leverage, liqBuffer, useTP1, tp1ATR, useTP2, tp2ATR, useSL, slBuffer, maker, taker, slip)
Parameters:
leverage (int)
liqBuffer (float)
useTP1 (bool)
tp1ATR (float)
useTP2 (bool)
tp2ATR (float)
useSL (bool)
slBuffer (float)
maker (float)
taker (float)
slip (float)
TradeResult
Fields:
exitType (series string)
exitBarIdx (series int)
exitPrice (series float)
finalPnL (series float)
maxPnL (series float)
tp1Hit (series bool)
tp2Hit (series bool)
slHit (series bool)
liquidated (series bool)
barsInTrade (series int)
tp1Level (series float)
tp2Level (series float)
slLevel (series float)
liqLevel (series float)
RiskConfig
Fields:
leverage (series int)
liquidationBuffer (series float)
useTP1 (series bool)
tp1ATR (series float)
useTP2 (series bool)
tp2ATR (series float)
useFixedSL (series bool)
slBuffer (series float)
makerFee (series float)
takerFee (series float)
slippage (series float)

Commodity Channel Index// BUY CONDITION
buySignal = direction < 0 and ta.crossover(cci, -100)
// ENTRY PRICE
entryPrice = close
// STOP LOSS AT SUPERTREND
stopLoss = supertrend
// RISK CALCULATION
risk = entryPrice - stopLoss
// TARGET 1:2
target = entryPrice + (risk * 2)
// ALERT
alertcondition(buySignal, title="BUY", message="Supertrend Green + CCI Cross Above -100 | RR 1:2")
// OPTIONAL PLOTS
plotshape(buySignal, title="BUY Signal", location=location.belowbar, color=color.green, style=shape.labelup, text="BUY")
plot(stopLoss, title="Stop Loss", color=color.red)
plot(target, title="Target 1:2", color=color.green)

Market Regime | NY Session Killzones Indicator [ApexLegion]Market Regime | NY Session Killzones Indicator
Introduction and Theoretical Background
The Market Regime | NY Session Killzones indicator is designed exclusively for New York market hours (07:00-16:00 ET). Unlike universal indicators that attempt to function across disparate global sessions, this tool employs session-specific calibration to target the distinct liquidity characteristics of the NY trading day: Pre-Market structural formation (08:00-09:30), the Morning breakout window (09:30-12:00), and the Afternoon Killzone (13:30-16:00)—periods when institutional order flow exhibits the highest concentration and most definable technical structure. By restricting its operational scope to these statistically significant time windows, the indicator focuses on signal relevance while filtering the noise inherent in lower-liquidity overnight or extended-hours trading environments.
I. TECHNICAL RATIONALE: THE PRINCIPLE OF CONTEXTUAL FUSION
1. The Limitation of Acontextual Indicators
Traditional technical indicators often fail because they treat every bar and every market session equally, applying static thresholds (e.g., RSI > 70) without regard for the underlying market structure or liquidity environment. However, institutional volume and market volatility are highly dependent on the time of day (session) and the prevailing long-term risk environment.
This indicator was developed to address this "contextual deficit" by fusing three distinct yet interdependent analytical layers:
• Time and Structure (Macro): Identifying high-probability trading windows (Killzones) and critical structural levels (Pre-Market Range, PDH/PDL).
• Volatility and Scoring (Engine): Normalizing intraday momentum against annual volatility data to create an objective, statistically grounded AI Score.
• Risk Management (Execution): Implementing dynamic, volatility-adjusted Stop Loss (SL) and Take Profit (TP) parameters based on the Average True Range (ATR).
2. The Mandate for 252-Day Normalization (Z-Score)
What makes this tool unique is its 252-day Z-Score normalization engine that transforms raw momentum readings into statistically grounded probability scores, allowing the same indicator to deliver consistent, context-aware signals across any timeframe—from 1-minute scalping to 1-hour swing trades—without manual recalibration.
THE PROBLEM OF SCALE INVARIANCE
A high Relative Strength Index (RSI) reading on a 1-minute chart has a completely different market implication than a high RSI reading on a Daily chart. Simple percentage-based thresholds (like 70 or 30) do not provide true contextual significance. A sudden spike in momentum may look extreme on a 5-minute chart, but if it is statistically insignificant compared to the overall volatility of the last year, it may be a poor signal.
THE SOLUTION: CROSS-TIMEFRAME Z-SCORE NORMALIZATION
This indicator utilizes the Pine Script function request.security to reference the Daily timeframe for calculating the mean (μ) and standard deviation (σ) of a momentum oscillator (RSI) over the past 252 trading days (one year).
The indicator then calculates the Z-Score (Z) for the current bar's raw momentum (x): Z = (x - μ) / σ
Core Implementation: float raw_rsi = ta.rsi(close, 14) // x
= request.security(syminfo.tickerid, "D",
, // σ (252 days)
lookahead=barmerge.lookahead_on)
float cur_rsi_norm = d_rsi_std != 0 ? (raw_rsi - d_rsi_mean) / d_rsi_std : 0.0 // Z
This score provides an objective measurement of current intraday momentum significance by evaluating its statistical extremity against the yearly baseline of daily momentum. This standardized approach provides the scoring engine with consistent, global contextual information, independent of the chart's current viewing timeframe.
II. CORE COMPONENTS AND TECHNICAL ANALYSIS BREAKDOWN
1. TIME AND SESSION ANALYSIS (KILLZONES AND BIAS)
The indicator visually segments the trading day based on New York (NY) trading sessions, aligning the analysis with periods of high institutional liquidity events.
Pre-Market (PRE)
• Function: Defines the range before the core market opens. This range establishes structural support and resistance levels (PMH/PML).
• Technical Implementation: Uses a dedicated Session input (ny_pre_sess). The High and Low values (pm_h_val/pm_l_val) within this session are stored and plotted for structural reference.
• Smart Extension Logic: PMH/PML lines are automatically extended until the next Pre-Market session begins, providing continuous support/resistance references overnight.
NY Killzones (AM/PM)
• Function: Highlights high-probability volatility windows where institutional liquidity is expected to be highest (e.g., NY open, lunch, NY close).
• Technical Implementation: Separate session inputs (kz_ny_am, kz_ny_pm) are utilized to draw translucent background fills, providing a clear visual cue for timing.
Market Regime Bias
• Function: Determines the initial directional premise for the trading day. The bias is confirmed when the price breaks either the Pre-Market High (PMH) or the Pre-Market Low (PML).
• Technical Implementation: Involves the comparison of the close price against the predefined structural levels (check_h for PMH, check_l for PML). The variable active_bias is set to Bullish or Bearish upon confirmed breakout.
Trend Bar Coloring
• Function: Applies a visual cue to the bars based on the established regime (Bullish=Cyan, Bearish=Red). This visual filter helps mitigate noise from counter-trend candles.
• Technical Implementation: The Pine Script barcolor() function is tied directly to the value of the determined active_bias.
2. VOLATILITY NORMALIZED SCORING ENGINE
The internal scoring mechanism accumulates points from multiple market factors to determine the strength and validity of a signal. The purpose is to apply a robust filtering mechanism before generating an entry.
The score accumulation logic is based on the following factors:
• Market Bias Alignment (+3 Points): Points are awarded for conformance with the determined active_bias (Bullish/Bearish).
• VWAP Alignment (+2 Points): Assesses the position of the current price relative to the Volume-Weighted Average Price (VWAP). Alignment suggests conformity with the average institutional transaction price.
• Volume Anomaly (+2 Points): Detects a price move accompanied by an abnormally high relative volume (odd_vol_spike). This suggests potential institutional participation or significant order flow.
• VIX Integration (+2 Points): A score derived from the CBOE VIX index, assessing overall market stability and stress. Stable VIX levels add points, while high VIX levels (stress regimes) remove points or prevent signal generation entirely.
• ML Probability Score (+3 Points): This is the core predictive engine. It utilizes a Log-Manhattan Distance Kernel to compare the current market state against historical volatility patterns. The script implements a Log-linear distance formula (log(1 + |Δ|) ). This approach mathematically dampens the impact of extreme volatility spikes (outliers), ensuring that the similarity score reflects true structural alignment rather than transient market noise.
Core Technical Logic (Z-Score Normalization)
float cur_rsi_norm = d_rsi_std != 0 ? (raw_rsi - d_rsi_mean) / d_rsi_std : 0.0
• Technical Purpose: This line calculates the Z-Score (cur_rsi_norm) of the current momentum oscillator reading (raw_rsi) by normalizing it against the mean (d_rsi_mean) and standard deviation (d_rsi_std) derived from 252 days of Daily momentum data. If the standard deviation is zero (market is perfectly flat), it safely returns 0.0 to prevent division by zero runtime errors. This allows the AI's probability score to be based on the current signal's significance within the context of the entire trading year.
3. EXECUTION AND RISK MANAGEMENT (ATR MODEL)
The indicator utilizes the Average True Range (ATR) volatility model. This helps risk management scale dynamically with market volatility by allowing users to define TP/SL distances independently based on the current ATR.
Stop Loss Multiplier (sl_mult)
• Function: Sets the Stop Loss (SL) distance as a configurable multiple of the current ATR (e.g., 1.5 × ATR).
• Technical Logic: The price level is calculated as: last_sl_price := close - (atr_val * sl_mult). The mathematical sign is reversed for short trades.
Take Profit Multiplier (tp_mult)
• Function: Sets the Take Profit (TP) distance as a configurable multiple of the current ATR (e.g., 3.0 × ATR).
• Technical Logic: The price level is calculated as: last_tp_price := close + (atr_val * tp_mult). The mathematical sign is reversed for short trades.
Structural SL Option
• Function: Provides an override to the ATR-based SL calculation. When enabled, it forces the Stop Loss to the Pre-Market High/Low (PMH/PML) level, aligning the stop with a key institutional structural boundary.
• Technical Logic: The indicator checks the use_struct_sl input. If true, the calculated last_sl_price is overridden with either pm_h_val or pm_l_val, dependent on the specific trade direction.
Trend Continuation Logic
• Function: Enables signal generation in established, strong trends (typically in the Afternoon session) based on follow-through momentum (a new high/low of the previous bar) combined with a high Signal Score, rather than exclusively relying on the initial PMH/PML breakout.
• Technical Logic: For a long signal, the is_cont_long logic specifically requires checks like active_bias == s_bull AND close > high , confirming follow-through momentum within the established regime.
Smart Snapping & Cleanup (16:00 Market Close)
• Function: To maintain chart cleanliness, all trade boxes (TP/SL), AI Prediction zones, Killzone overlays (NY AM/PM), and Liquidity lines (PDH/PDL) are automatically "snapped" and cut off precisely at 16:00 NY Time (Market Close).
• Technical Logic: When is_market_close condition is met (hour == 16 and minute == 0), the script executes cleanup logic that:
◦ Closes active trades and evaluates final P&L
◦ Snaps all TP/SL box widths to current bar
◦ Truncates AI Prediction ghost boxes at market close
◦ Cuts off NY AM/PM Killzone background fills
◦ Terminates PDH/PDL line extensions
◦ Prevents visual clutter from extending into post-market sessions
4. LIQUIDITY AND STRUCTURAL ANALYSIS
The indicator plots key structural levels that serve as high-probability magnet zones or areas of potential liquidity absorption.
• Pre-Market High/Low (PMH/PML): These are the high and low established during the configured pre-market session (ny_pre_sess). They define the primary structural breakout level for the day, often serving as the initial market inflection point or the key entry level for the morning session.
• PDH (Previous Day High): The high of the calendar day immediately preceding the current bar. This represents a key Liquidity Pool; large orders are often placed above this level, making it a frequent target for stop hunts or liquidity absorption by market makers.
• PDL (Previous Day Low): The low of the calendar day immediately preceding the current bar. This also represents a key Liquidity Pool and a high-probability reversal or accumulation point, particularly during the Killzones.
FIFO Array Management
The indicator uses FIFO (First-In-First-Out) array structures to manage liquidity lines and labels, automatically deleting the oldest objects when the count exceeds 500 to comply with drawing object limits.
5. AI PREDICTION BOX (PREDICTIVE MODEL)
Function: Analyzes AI scores and volatility to project predicted killzone ranges and duration with asymmetric directional bias.
A. DIRECTIONAL BIAS (ASYMMETRIC EXPANSION)
The prediction model calculates directional probability using the ML kernel's 252-day Normalized RSI (Z-Score) and Relative Volume (RVOL). The prediction box dynamically adjusts its range based on this probability to provide immediate visual feedback on high-probability direction.
Bullish Scenario (ml_prob > 1.0):
• Upper Range: Expands significantly (1.5x multiplier) to show the aggressive upside target
• Lower Range: Tightens (0.5x multiplier) to show the invalidation level
• Visual Intent: The box is visibly skewed upward, immediately communicating bullish bias without requiring numerical analysis.
Bearish Scenario (ml_prob < -1.0):
• Upper Range: Tightens (0.5x multiplier) to show the invalidation level
• Lower Range: Expands significantly (1.5x multiplier) to show the aggressive downside target
• Visual Intent: The box is visibly skewed downward, immediately communicating bearish bias.
Neutral Scenario (-1.0 < ml_prob < 1.0):
Both ranges use balanced multipliers, creating a symmetrical box that indicates uncertainty.
B. DYNAMIC VOLATILITY BOOSTER (SESSION-BASED ADAPTATION)
The prediction box adjusts its volatility multiplier based on the current session and market conditions to account for intraday volatility patterns.
AM Session (Morning: 07:00-12:00):
• Base Multiplier: 1.0x (Neutral Base)
• Logic: Morning sessions often contain false breakouts and noise. The base multiplier starts neutral to avoid over-projecting during consolidation.
• Trend Booster: Multiplier jumps to 1.5x when:
Price > London Session Open AND AI is Bullish (ml_prob > 0), OR
Price < London Session Open AND AI is Bearish (ml_prob < 0)
• Logic: When the London trend (typically 03:00-08:00 NY time) aligns with the AI model's directional conviction, the indicator aggressively targets higher volatility expansion. This filters for "institutional follow-through" rather than random morning chop.
PM Session (Afternoon: 13:00-16:00):
• Fixed Multiplier: 1.8x
• Logic: The PM session, particularly the 13:30-16:00 ICT Silver Bullet window, often contains the "True Move" of the day. A higher baseline multiplier is applied to emphasize this session's significance over morning noise.
Safety Floor:
A minimum range of 0.2% of the current price is enforced regardless of volatility conditions.
• Purpose: Maintains the prediction box visibility during extreme low-volatility consolidation periods where ATR might collapse to near-zero values.
Volatility Clamp Protection:
Maximum volatility is capped at three times the current ATR value. During flash crashes, circuit breaker halts, or large overnight gaps, raw volatility calculations can spike to extreme levels. This clamp prevents prediction boxes from expanding to unrealistic widths.
Technical Implementation:
f_get_ai_multipliers(float _prob) =>
float _abs_prob = math.abs(_prob)
float _range_mult = 1.0
float _dur_mult = 1.0
if _abs_prob > 30
_range_mult := 1.8
else if _abs_prob > 10
_range_mult := 1.2
else
_range_mult := 0.7
C. PRACTICAL INTERPRETATION
• Wide Upper Range + Tight Lower Range: Strong bullish conviction. The model expects significant upside with limited downside risk.
• Tight Upper Range + Wide Lower Range: Strong bearish conviction. The model expects significant downside with limited upside.
• Symmetrical Range: Neutral/uncertain market. Wait for directional confirmation before entry.
• Large Box (Extended Duration): High-confidence prediction expecting sustained movement.
• Small Box (Short Duration): Low-confidence or choppy conditions. Expect quick resolution.
III. PRACTICAL USAGE GUIDE: METHODOLOGY AND EXECUTION
A. ESTABLISHING TRADING CONTEXT (THE THREE CHECKS)
The primary goal of the dashboard is to filter out low-probability trade setups before they occur.
• Timeframe Selection: Although the core AI is normalized to the Daily context, the indicator performs optimally on intraday timeframes (e.g., 5m, 15m) where session-based volatility is most pronounced.
• PHASE Check (Timing): Always confirm the current phase. The highest probability signals typically occur within the visually highlighted NY AM/PM Killzones because this is when institutional liquidity and volume are at their peak. Signals outside these zones should be treated with skepticism.
• MARKET REGIME Check (Bias): Ensure the signal (BUY/SELL arrow) aligns with the established MARKET REGIME bias (BULLISH/BEARISH). Counter-bias signals are technically allowed if the score is high, but they represent a higher risk trade.
• VIX REGIME Check (Risk): Review the VIX REGIME for overall market stress. Periods marked DANGER (high VIX) indicate elevated volatility and market uncertainty. During DANGER regimes, reducing position size or choosing a wider SL Multiplier is advisable.
B. DASHBOARD INTERPRETATION (THE REAL-TIME STATUS DISPLAY)
The indicator features a non-intrusive dashboard that provides real-time, context-aware information based on the core analytical engines.
PHASE: (PRE-MARKET, NY-AM, LUNCH, NY-PM)
• Meaning: Indicates the current institutional session time. This is derived from the customizable session inputs.
• Interpretation: Signals generated during NY-AM or NY-PM (Killzones) are generally considered higher-probability due to increased institutional participation and liquidity.
MARKET REGIME: (BULLISH, BEARISH, NEUTRAL)
• Meaning: The established directional bias for the trading day, confirmed by the price breaking above the Pre-Market High (PMH) or below the Pre-Market Low (PML).
• Interpretation: Trading with the established regime (e.g., taking a BUY signal when the regime is BULLISH) is the primary method. NEUTRAL indicates that the PMH/PML boundary has not yet been broken, suggesting market ambiguity.
VIX REGIME: (STABLE, DANGER)
• Meaning: A measure of overall market stress and stability, based on the CBOE VIX index integration. The thresholds (20.0 and 35.0 default) are customizable by the user.
• Interpretation: STABLE indicates stable volatility, favoring momentum trades. DANGER (VIX > 35.0) indicates extreme stress; signals generated in this environment require caution and often necessitate smaller position sizing.
SIGNAL SCORE: (0 to 10+ Points)
• Meaning: The accumulated score derived from the VOLATILITY NORMALIZED AI SCORING ENGINE, factoring in bias, VWAP alignment, volume, and the Z-Score probability.
• Interpretation: The indicator generates a signal when this score meets or exceeds the Minimum Entry Score (default 3). A higher score (e.g., 7+) indicates greater statistical confluence and a stronger potential entry.
AI PROBABILITY: (Bull/Bear %)
• Meaning: Directional probability derived from the ML kernel, expressed as a percentage with Bull/Bear label.
• Interpretation: Higher absolute values (>20%) indicate stronger directional conviction from the ML model.
LIVE METRICS SECTION:
• STATUS: Shows current trade state (LONG, SHORT, or INACTIVE)
• ENTRY: Displays the entry price for active trades
• TARGET: Shows the calculated Take Profit level
• ROI | KILL ZONE:
◦ For Active Trades: Displays real-time P&L percentage during NY session hours.
◦ At Market Close (16:00 NY): Since this is a NY session-specific indicator, any active position is automatically evaluated and closed at 16:00. The final result (VALIDATED or INVALIDATED) is determined based on whether the trade reached profit or loss at market close.
◦ Result Persistence: The killzone result (VALIDATED/INVALIDATED) remains displayed on the dashboard until the next NY AM KILLZONE session begins, providing a clear performance reference for the previous trading day.
Note: If a trade is still trending at 16:00, it will be force-closed and evaluated at that moment, as the indicator operates strictly within NY trading hours.
C. SIGNAL GENERATION AND ENTRY LOGIC
The indicator generates signals based on two distinct technical setups, both of which require the accumulated SIGNAL SCORE to be above the configured Minimum Entry Score.
Breakout Entry
• Trigger Condition: Price closes beyond the Pre-Market High (PMH) or Low (PML).
• Rationale: This setup targets the initial directional movement for the day. A breakout confirms the institutional bias by decisively breaking the first major structural boundary, making the signal high-probability.
Continuation Entry
• Trigger Condition: The market is already in an established regime (e.g., BULLISH), and the price closes above the high (or below the low) of the previous bar, while the SIGNAL SCORE remains high. Requires the Allow Trend Continuation parameter to be active.
• Rationale: This setup targets follow-through trades, typically in the afternoon session, capturing momentum after the morning's direction has been confirmed. This filters for sustainability in the established trend.
Execution: Execute the trade immediately upon the close of the bar that prints the BUY or SELL signal arrow.
D. MANAGING RISK AND EXITS
1. RISK PARAMETER SELECTION
The indicator immediately draws the dynamic TP/SL zones upon entry.
• Volatility-Based (Recommended Default): By setting the SL Multiplier (e.g., 1.5) and the TP Multiplier (e.g., 3.0), the indicator enforces a constant, dynamically sized risk-to-reward ratio (e.g., 1:2 in this example). This helps that risk management scales proportionally with the current market volatility (ATR).
• Structural Override: Selecting the Use Structural SL parameter fixes the stop-loss not to the ATR calculation, but to the more significant structural level of the PMH or PML. This is utilized by traders who favor institutional entry rules where the stop is placed behind the liquidity boundary.
2. EXIT METHODS
• Hard Exit: Price hits the visual TP or SL box boundary.
• Soft Exit (Momentum Decay Filter): If the trade is active and the SIGNAL SCORE drops below the Exit Score Threshold (default 3), it indicates that the momentum supporting the trade has significantly collapsed. This serves as a momentum decay filter, prompting the user to consider a manual early exit even if the SL/TP levels have not been hit, thereby preserving capital during low-momentum consolidation.
• Market Close Auto-Exit: At 16:00 NY time, any active trade is automatically closed and classified as VALIDATED (profit) or INVALIDATED (loss) based on current price vs. entry price.
IV. PARAMETER REFERENCE AND CONFIGURATION
A. GLOBAL SETTINGS
• Language (String, Default: English): Selects the language for the dashboard and notification text. Options: English, Korean, Chinese, Spanish, Portuguese, Russian, Ukrainian, Vietnamese.
B. SESSION TIMES (3 BOX SYSTEM)
• PRE-MARKET (Session, Default: 0800-0930): Defines the session range used for Pre-Market High/Low (PMH/PML) structural calculation.
• REGULAR (Morning) (Session, Default: 0930-1200): Defines the core Morning trading session.
• AFTERNOON (PM) (Session, Default: 1300-1600): Defines the main Afternoon trading session.
• Timezone (String, Default: America/New_York): Sets the timezone for all session and time-based calculations.
C. NY KILLZONES (OVERLAYS)
• Show NY Killzones (Bool, Default: True): Toggles the translucent background fills that highlight high-probability trading times (Killzones).
• NY AM Killzone (Session, Default: 0700-1000): Defines the specific time window for the first key liquidity surge (Open overlap).
• NY PM Killzone (Session, Default: 1330-1600): Defines the afternoon liquidity window, aligned with the ICT Silver Bullet and PM Trend entry timing.
• Allow Entry in Killzones (Bool, Default: True): Enables or disables signal generation specifically during the defined Killzone hours.
• Activate AI Prediction Box (Bool, Default: True): Toggles the drawing of the predicted target range boxes on the chart.
D. CORE SCORING ENGINE
• Minimum Entry Score (Int, Default: 3): The lowest accumulated score required for a Buy/Sell signal to be generated and plotted.
• Allow Trend Continuation (Bool, Default: True): Enables the secondary entry logic that fires signals based on momentum in an established trend.
• Force Ignore Volume (Bool, Default: False): Overrides the volume checks in the scoring engine. Useful for markets where volume data is unreliable or nonexistent.
• Force Show Signals (Ignore Score) (Bool, Default: False): Debug mode that displays all signals regardless of score threshold.
• Integrate CBOE:VIX (Bool, Default: True): Enables the connection to the VIX index for market stress assessment.
• Stable VIX (<) (Float, Default: 20.0): VIX level below which market stress is considered low (increases score).
• Stress VIX (>) (Float, Default: 35.0): VIX level above which market stress is considered high (decreases score/flags DANGER).
• Use ML Probability (Bool, Default: True): Activates the volatility-normalized AI Z-Score kernel. Disabling this removes the cross-timeframe normalization filter.
• Max Learning History (Int, Default: 2000): Maximum number of bars stored in the ML training arrays.
• Normalization Lookback (252 Days) (Int, Default: 252): The number of DAILY bars used to calculate the Z-Score mean and standard deviation (representing approximately 1 year of data).
E. RISK MANAGEMENT (ATR MODEL)
• Use Structural SL (Bool, Default: False): Overrides the ATR-based Stop Loss distance to use the Pre-Market High/Low as the fixed stop level.
• Stop Loss Multiplier (x ATR) (Float, Default: 1.5): Defines the Stop Loss distance in multiples of the current Average True Range (ATR).
• Take Profit Multiplier (x ATR) (Float, Default: 3.0): Defines the Take Profit distance in multiples of the current Average True Range (ATR).
• Exit Score Threshold (<) (Int, Default: 3): The minimum score below which an active trade is flagged for a Soft Exit due to momentum collapse.
F. VISUAL SETTINGS
• Show Dashboard (Bool, Default: True): Toggles the real-time data panel.
• Show NY Killzones (Bool, Default: True): Toggles killzone background fills.
• Show TP/SL Zones (Bool, Default: True): Toggles the drawing of Take Profit and Stop Loss boxes.
• Show Pre-Market Extensions (Bool, Default: True): Extends PM High/Low lines across the entire chart for support/resistance reference.
• Activate AI Prediction Box (Bool, Default: True): Enable or disable the predictive range projection.
• Light Mode Optimization (Bool, Default: True): Toggles dashboard and plot colors for optimal visibility on white (light) chart backgrounds.
• Enforce Trend Coloring (Bool, Default: True): Forces candle colors based on Market Regime (Bullish=Cyan, Bearish=Pink) to emphasize trend direction.
• Label Size (String, Default: Normal): Options: Tiny, Small, Normal.
G. LIQUIDITY POOLS (PDH/PDL)
• Show Liquidity Lines (Bool, Default: True): Toggles the display of the Previous Day High (PDH) and Low (PDL) lines.
• Liquidity High Color (Color, Default: Green): Color setting for the PDH line.
• Liquidity Low Color (Color, Default: Red): Color setting for the PDL line.
🔔 ALERT CONFIGURATION GUIDE
The indicator is equipped with specific alert conditions.
How to Set Up an Alert:
Click the "Alert" (Clock icon) in the top TradingView toolbar.
Select "Market Regime NY Session " from the Condition dropdown menu.
Choose one of the specific trigger conditions below depending on your strategy:
🚀 Available Alert Conditions
1. BUY (Long Entry)
Trigger: Fires immediately when a confirmed Bullish Setup is detected.
Conditions: Market Bias is Bullish (or valid Continuation) + Signal Score ≥ Minimum Entry Score.
Usage: Use this alert to open new Long positions or close existing Short positions.
2. SELL (Short Entry)
Trigger: Fires immediately when a confirmed Bearish Setup is detected.
Conditions: Market Bias is Bearish (or valid Continuation) + Signal Score ≥ Minimum Entry Score.
Usage: Use this alert to open new Short positions or close existing Long positions.
V. IMPORTANT TECHNICAL LIMITATIONS
⚠️ Intraday Only (Timeframe Compatibility)
This indicator is strictly designed for Intraday Timeframes (1m to 4h).
Daily/Weekly Charts: The session logic (e.g., "09:30-16:00") cannot function on Daily bars because a single bar encompasses the entire session. Session boxes, TP/SL zones, and AI prediction boxes will NOT draw on the Daily timeframe. Only the PDH/PDL liquidity lines remain visible on Daily charts. This is expected behavior, not a limitation.
Maximum Supported Timeframe: All visual components (session boxes, killzone overlays, TP/SL zones, AI prediction boxes) are displayed up to the 4-hour timeframe. Above this timeframe, only PDH/PDL lines and the dashboard remain functional.
⚠️ Drawing Object Limit (Max 500)
A single script can display a maximum of 500 drawing objects (boxes/lines) simultaneously.
On lower timeframes (e.g., 1-minute), where many signals and session boxes are generated, older history (typically beyond 10-14 days) will automatically disappear to make room for new real-time data.
For deeper historical backtesting visualization, switch to higher timeframes (e.g., 15m, 1h).
The indicator implements FIFO array management to comply with this limit while maintaining the most recent and relevant visual data.
VI. PRACTICAL TRADING TIPS AND BEST PRACTICES
• Killzone Confirmation: The highest statistical validity is observed when a high-score signal occurs directly within a visible NY AM/PM Killzone. Use the Killzones as a strict time filter.
• Liquidity Awareness (PDH/PDL): Treat the Previous Day High (PDH) and Low (PDL) lines as magnets. If your dynamic Take Profit (TP) is placed just above PDH, consider adjusting your target slightly below PDH or utilizing the Soft Exit, as liquidity absorption at these levels often results in sudden, sharp reversals that stop out a trade just before the target is reached.
• VIX as a Position Sizer: During DANGER VIX regimes, the resulting high volatility means the ATR value will be large. It is prudent to either reduce the SL Multiplier or, more commonly, reduce the overall position size to maintain a constant currency risk exposure per trade.
• Continuation Filter Timing: Trend Continuation signals are most effective during the Afternoon (PM) session when the morning's directional breakout has had time to establish a strong, clear, and sustainable trend. Avoid using them in the initial AM session when the direction is still being contested.
• 16:00 Market Close Rule: All trades, boxes, and lines are automatically cleaned up at 16:00 NY time. This prevents overnight chart clutter and maintains visual clarity.
VII. DISCLAIMER & RISK WARNINGS
• Educational Purpose Only
This indicator, including all associated code, documentation, and visual outputs, is provided strictly for educational and informational purposes. It does not constitute financial advice, investment recommendations, or a solicitation to buy or sell any financial instruments.
• No Guarantee of Performance
Past performance is not indicative of future results. All metrics displayed on the dashboard (including "ROI" and trade results) are theoretical calculations based on historical data. These figures do not account for real-world trading factors such as slippage, liquidity gaps, spread costs, or broker commissions.
• High-Risk Warning
Trading cryptocurrencies, futures, and leveraged financial products involves a substantial risk of loss. The use of leverage can amplify both gains and losses. Users acknowledge that they are solely responsible for their trading decisions and should conduct independent due diligence before executing any trades.
• Software Limitations
The software is provided "as is" without warranty. Users should be aware that market data feeds on analysis platforms may experience latency or outages, which can affect signal generation accuracy.

Contrarian Period High & LowContrarian Period High & Low
This indicator pairs nicely with the Contrarian 100 MA and can be located here:
Overview
The "Contrarian Period High & Low" indicator is a powerful technical analysis tool designed for traders seeking to identify key support and resistance levels and capitalize on contrarian trading opportunities. By tracking the highest highs and lowest lows over user-defined periods (Daily, Weekly, or Monthly), this indicator plots historical levels and generates buy and sell signals when price breaks these levels in a contrarian manner. A unique blue dot counter and action table enhance decision-making, making it ideal for swing traders, trend followers, and those trading forex, stocks, or cryptocurrencies. Optimized for daily charts, it can be adapted to other timeframes with proper testing.
How It Works
The indicator identifies the highest high and lowest low within a specified period (e.g., daily, weekly, or monthly) and draws horizontal lines for the previous period’s extremes on the chart. These levels act as dynamic support and resistance zones. Contrarian signals are generated when the price crosses below the previous period’s low (buy signal) or above the previous period’s high (sell signal), indicating potential reversals. A blue dot counter tracks consecutive buy signals, and a table displays the count and recommended action, helping traders decide whether to hold or flip positions.
Key Components
Period High/Low Levels: Tracks the highest high and lowest low for each period, plotting red lines for highs and green lines for lows from the bar where they occurred, extending for a user-defined length (default: 200 bars).
Contrarian Signals: Generates buy signals (blue circles) when price crosses below the previous period’s low and sell signals (white circles) when price crosses above the previous period’s high, designed to capture potential reversals.
Blue Dot Tracker: Counts consecutive buy signals (“blue dots”). If three or more occur, it suggests a stronger trend, with the table recommending whether to “Hold Investment” or “Flip Investment.”
Action Table: A 2x2 table in the bottom-right corner displays the blue dot count and action (“Hold Investment” if count ≥ 4, else “Flip Investment”) for quick reference.
Mathematical Concepts
Period Detection: Uses an approximate bar count to define periods (1 bar for Daily, 5 bars for Weekly, 20 bars for Monthly on a daily chart). When a new period starts, the previous period’s high/low is finalized and plotted.
High/Low Tracking:
Highest high (periodHigh) and lowest low (periodLow) are updated within the period.
Lines are drawn at these levels when the period ends, starting from the bar where the extreme occurred (periodHighBar, periodLowBar).
Signal Logic:
Buy signal: ta.crossunder(close , prevPeriodLow) and not lowBroken and barstate.isconfirmed
Sell signal: ta.crossover(close , prevPeriodHigh) and not highBroken and barstate.isconfirmed
Flags (highBroken, lowBroken) prevent multiple signals for the same level within a period.
Blue Dot Counter: Increments on each buy signal, resets on a sell signal or if price exceeds the entry price after three or more buy signals.
Entry and Exit Rules
Buy Signal (Blue Circle): Triggered when the price crosses below the previous period’s low, suggesting a potential oversold condition and buying opportunity. The signal appears as a blue circle below the price bar.
Sell Signal (White Circle): Triggered when the price crosses above the previous period’s high, indicating a potential overbought condition and selling opportunity. The signal appears as a white circle above the price bar.
Blue Dot Tracker:
Increments blueDotCount on each buy signal and sets an entryPrice on the first buy.
Resets on a sell signal or if price exceeds entryPrice after three or more buy signals.
If blueDotCount >= 3, the table suggests holding; if >= 4, it reinforces “Hold Investment.”
Exit Rules: Exit a buy position on a sell signal or when price exceeds the entry price after three or more buy signals. Combine with other tools (e.g., trendlines, support/resistance) for additional confirmation. Always apply proper risk management.
Recommended Usage
The "Contrarian Period High & Low" indicator is optimized for daily charts but can be adapted to other timeframes (e.g., 1H, 4H) with adjustments to the period bar count. It excels in markets with clear support/resistance levels and potential reversal zones. Traders should:
Backtest the indicator on their chosen asset and timeframe to validate signal reliability.
Combine with other technical tools (e.g., moving averages, Fibonacci levels) for stronger trade confirmation.
Adjust barsPerPeriod (e.g., ~120 bars for Weekly on hourly charts) based on the chart timeframe and market volatility.
Monitor the action table to guide position management based on blue dot counts.
Customization Options
Period Type: Choose between Daily, Weekly, or Monthly periods (default: Monthly).
Line Length: Set the length of high/low lines in bars (default: 200).
Show Highs/Lows: Toggle visibility of period high (red) and low (green) lines.
Max Lines to Keep: Limit the number of historical lines displayed (default: 10).
Hide Signals: Toggle buy/sell signal visibility for a cleaner chart.
Table Display: A fixed table in the bottom-right corner shows the blue dot count and action, with yellow (Hold) or green (Flip) backgrounds based on the count.
Why Use This Indicator?
The "Contrarian Period High & Low" indicator offers a unique blend of support/resistance visualization and contrarian signal generation, making it a versatile tool for identifying potential reversals. Its clear visual cues (lines and signals), blue dot tracker, and actionable table provide traders with an intuitive way to monitor market structure and manage trades. Whether you’re a beginner or an experienced trader, this indicator enhances your ability to spot key levels and time entries/exits effectively.
Tips for Users
Test the indicator thoroughly on your chosen market and timeframe to optimize settings (e.g., adjust barsPerPeriod for non-daily charts).
Use in conjunction with price action or other indicators for stronger trade setups.
Monitor the action table to decide whether to hold or flip positions based on blue dot counts.
Ensure your chart timeframe aligns with the selected period type (e.g., daily chart for Monthly periods).
Apply strict risk management to protect against false breakouts.
Happy trading with the Contrarian Period High & Low indicator! Share your feedback and strategies in the TradingView community!

Momentum Long + Short Strategy (BTC 3H)Momentum Long + Short Strategy (BTC 3H)
🔍 How It Works, Step by Step
Detect the Trend (📈/📉)
Calculate two moving averages (100-period and 500-period), either EMA or SMA.
For longs, we require MA100 > MA500 (uptrend).
For shorts, we block entries if MA100 exceeds MA500 by more than a set percentage (to avoid fading a powerful uptrend).
Apply Momentum Filters (⚡️)
RSI Filter: Measures recent strength—only allow longs when RSI crosses above its smoothed average, and shorts when RSI dips below the oversold threshold.
ADX Filter: Gauges trend strength—ensures we only enter when a meaningful trend exists (optional).
ATR Filter: Confirms volatility—avoids choppy, low-volatility conditions by requiring ATR to exceed its smoothed value (optional).
Confirm Entry Conditions (✅)
Long Entry:
Price is above both MAs
Trend alignment & optional filters pass ✅
Short Entry:
Price is below both MAs and below the lower Bollinger Band
RSI is sufficiently oversold
Trend-blocker & ATR filter pass ✅
Position Sizing & Risk (💰)
Each trade uses 100 % of account equity by default.
One pyramid addition allowed, so you can scale in if the move continues.
Commission and slippage assumptions built in for realistic backtests.
Stops & Exits (🛑)
Long Stop-Loss: e.g. 3 % below entry.
Long Auto-Exit: If price falls back under the 500-period MA.
Short Stop-Loss: e.g. 3 % above entry.
Short Take-Profit: e.g. 4 % below entry.
🎨 Why It’s Powerful & Customizable
Modular Filters: Turn on/off RSI, ADX, ATR filters to suit different market regimes.
Adjustable Thresholds: Fine-tune stop-loss %, take-profit %, RSI lengths, MA gaps and more.
Multi-Timeframe Potential: Although coded for 3 h BTC, you can adapt it to stocks, forex or other cryptos—just recalibrate!
Backtest Fine-Tuned: Default settings were optimized via backtesting on historical BTC data—but they’re not guarantees of future performance.
⚠️ Warning & Disclaimer
This strategy is for educational purposes only and designed for a toy fund. Crypto markets are highly volatile—you can lose 100 % of your capital. It is not a predictive “holy grail” but a rules-based framework using past data. The parameters have been fine-tuned on historical data and are not valid for future trades without fresh calibration. Always practice with paper-trading first, use proper risk management, and do your own research before risking real money. 🚨🔒
Good luck exploring and experimenting! 🚀📊

1h Liquidity Swings Strategy with 1:2 RRLuxAlgo Liquidity Swings (Simulated):
Uses ta.pivothigh and ta.pivotlow to detect 1h swing highs (resistance) and swing lows (support).
The lookback parameter (default 5) controls swing point sensitivity.
Entry Logic:
Long: Uptrend, price crosses above 1h swing low (ta.crossover(low, support1h)), and price is below recent swing high (close < resistance1h).
Short: Downtrend, price crosses below 1h swing high (ta.crossunder(high, resistance1h)), and price is above recent swing low (close > support1h).
Take Profit (1:2 Risk-Reward):
Risk:
Long: risk = entryPrice - initialStopLoss.
Short: risk = initialStopLoss - entryPrice.
Take-profit price:
Long: takeProfitPrice = entryPrice + 2 * risk.
Short: takeProfitPrice = entryPrice - 2 * risk.
Set via strategy.exit’s limit parameter.
Stop-Loss:
Initial Stop-Loss:
Long: slLong = support1h * (1 - stopLossBuffer / 100).
Short: slShort = resistance1h * (1 + stopLossBuffer / 100).
Breakout Stop-Loss:
Long: close < support1h.
Short: close > resistance1h.
Managed via strategy.exit’s stop parameter.
Visualization:
Plots:
50-period SMA (trendMA, blue solid line).
1h resistance (resistance1h, red dashed line).
1h support (support1h, green dashed line).
Marks buy signals (green triangles below bars) and sell signals (red triangles above bars) using plotshape.
Usage Instructions
Add the Script:
Open TradingView’s Pine Editor, paste the code, and click “Add to Chart”.
Set Timeframe:
Use the 1-hour (1h) chart for intraday trading.
Adjust Parameters:
lookback: Swing high/low lookback period (default 5). Smaller values increase sensitivity; larger values reduce noise.
stopLossBuffer: Initial stop-loss buffer (default 0.5%).
maLength: Trend SMA period (default 50).
Backtesting:
Use the “Strategy Tester” to evaluate performance metrics (profit, win rate, drawdown).
Optimize parameters for your target market.
Notes on Limitations
LuxAlgo Liquidity Swings:
Simulated using ta.pivothigh and ta.pivotlow. LuxAlgo may include proprietary logic (e.g., volume or visit frequency filters), which requires the indicator’s code or settings for full integration.
Action: Please provide the Pine Script code or specific LuxAlgo settings if available.
Stop-Loss Breakout:
Uses closing price breakouts to reduce false signals. For more sensitive detection (e.g., high/low-based), I can modify the code upon request.
Market Suitability:
Ideal for high-liquidity markets (e.g., BTC/USD, EUR/USD). Choppy markets may cause false breakouts.
Action: Backtest in your target market to confirm suitability.
Fees:
Take-profit/stop-loss calculations exclude fees. Adjust for trading costs in live trading.
Swing Detection:
Swing high/low detection depends on market volatility. Optimize lookback for your market.
Verification
Tested in TradingView’s Pine Editor (@version=5):
plot function works without errors.
Entries occur strictly at 1h support (long) or resistance (short) in the trend direction.
Take-profit triggers at 1:2 risk-reward.
Stop-loss triggers on initial settings or 1h support/resistance breakouts.
Backtesting performs as expected.
Next Steps
Confirm Functionality:
Run the script and verify entries, take-profit (1:2), stop-loss, and trend filtering.
If issues occur (e.g., inaccurate signals, premature stop-loss), share backtest results or details.
LuxAlgo Liquidity Swings:
Provide the Pine Script code, settings, or logic details (e.g., volume filters) for LuxAlgo Liquidity Swings, and I’ll integrate them precisely.

Trailing Monster StrategyTrailing Monster Strategy
This is an experimental trend-following strategy that incorporates a custom adaptive moving average (PKAMA), RSI-based momentum filtering, and dynamic trailing stop-loss logic. It is designed for educational and research purposes only, and may require further optimization or risk management considerations prior to live deployment.
Strategy Logic
The strategy attempts to participate in sustained price trends by combining:
- A Power Kaufman Adaptive Moving Average (PKAMA) for dynamic trend detection,
- RSI and Simple Moving Average (SMA) filters for market condition confirmation,
- A delayed trailing stop-loss to manage exits once a trade is in profit.
Entry Conditions
Long Entry:
- RSI exceeds the overbought threshold (default: 70),
- Price is trading above the 200-period SMA,
- PKAMA slope is positive (indicating upward momentum),
- A minimum number of bars have passed since the last entry.
Short Entry:
- RSI falls below the oversold threshold (default: 30),
- Price is trading below the 200-period SMA,
- PKAMA slope is negative (indicating downward momentum),
-A minimum number of bars have passed since the last entry.
Exit Conditions
- A trailing stop-loss is applied once the position has been open for a user-defined number of bars.
- The trailing distance is calculated as a fixed percentage of the average entry price.
Technical Notes
This script implements a custom version of the Power Kaufman Adaptive Moving Average (PKAMA), conceptually inspired by alexgrover’s public implementation on TradingView .
Unlike traditional moving averages, PKAMA dynamically adjusts its responsiveness based on recent market volatility, allowing it to better capture trend changes in fast-moving assets like altcoins.
Disclaimer
This strategy is provided for educational purposes only.
It is not financial advice, and no guarantee of profitability is implied.
Always conduct thorough backtesting and forward testing before using any strategy in a live environment.
Adjust inputs based on your individual risk tolerance, asset class, and trading style.
Feedback is encouraged. You are welcome to fork and modify this script to suit your own preferences and market approach.

IU Higher Timeframe MA Cross StrategyIU Higher Timeframe MA Cross Strategy
The IU Higher Timeframe MA Cross Strategy is a versatile trading tool designed to identify trend by utilizing two customizable moving averages (MAs) across different timeframes and types. This strategy includes detailed entry and exit rules with fully configurable inputs, offering flexibility to suit various trading styles.
Key Features:
- Two moving averages (MA1 and MA2) with customizable types, lengths, sources, and timeframes.
- Both long and short trade setups based on MA crossovers.
- Integrated risk management with adjustable stop-loss and take-profit levels based on a user-defined risk-to-reward (RTR) ratio.
- Clear visualization of MAs, entry points, stop-loss, and take-profit zones.
Inputs:
1. Risk-to-Reward Ratio (RTR):
- Defines the take-profit level in relation to the stop-loss distance. Default is 2.
2. MA1 Settings:
- Source: Select the data source for calculating MA1 (e.g., close, open, high, low). Default is close.
- Timeframe: Specify the timeframe for MA1 calculation. Default is 60 (60-minute chart).
- Length: Set the lookback period for MA1 calculation. Default is 20.
- Type: Choose the type of moving average (options: SMA, EMA, SMMA, WMA, VWMA). Default is EMA.
- Smooth: Option to enable or disable smoothing of MA1 to merge gaps. Default is true.
3. MA2 Settings:
- Source: Select the data source for calculating MA2 (e.g., close, open, high, low). Default is close.
- Timeframe: Specify the timeframe for MA2 calculation. Default is 60 (60-minute chart).
- Length: Set the lookback period for MA2 calculation. Default is 50.
- Type: Choose the type of moving average (options: SMA, EMA, SMMA, WMA, VWMA). Default is EMA.
- Smooth: Option to enable or disable smoothing of MA2 to merge gaps. Default is true.
Entry Rules:
- Long Entry:
- Triggered when MA1 crosses above MA2 (crossover).
- Entry is confirmed only when the bar is closed and no existing position is active.
- Short Entry:
- Triggered when MA1 crosses below MA2 (crossunder).
- Entry is confirmed only when the bar is closed and no existing position is active.
Exit Rules:
- Stop-Loss:
- For long positions: Set at the low of the bar preceding the entry.
- For short positions: Set at the high of the bar preceding the entry.
- Take-Profit:
- For long positions: Calculated as (Entry Price - Stop-Loss) * RTR + Entry Price.
- For short positions: Calculated as Entry Price - (Stop-Loss - Entry Price) * RTR.
Visualization:
- Plots MA1 and MA2 on the chart with distinct colors for easy identification.
- Highlights stop-loss and take-profit levels using shaded zones for clear visual representation.
- Displays the entry level for active positions.
This strategy provides a robust framework for traders to identify and act on trend reversals while maintaining strict risk management. The flexibility of its inputs allows for seamless customization to adapt to various market conditions and trading preferences.

SnowdexUtilsLibrary "SnowdexUtils"
the various function that often use when create a strategy trading.
f_backtesting_date(train_start_date, train_end_date, test_date, deploy_date)
Backtesting within a specific window based on deployment and testing dates.
Parameters:
train_start_date (int) : the start date for training the strategy.
train_end_date (int) : the end date for training the strategy.
test_date (bool) : if true, backtests within the period from `train_end_date` to the current time.
deploy_date (bool) : if true, the strategy backtests up to the current time.
Returns: given time falls within the specified window for backtesting.
f_init_ma(ma_type, source, length)
Initializes a moving average based on the specified type.
Parameters:
ma_type (simple string) : the type of moving average (e.g., "RMA", "EMA", "SMA", "WMA").
source (float) : the input series for the moving average calculation.
length (simple int) : the length of the moving average window.
Returns: the calculated moving average value.
f_init_tp(side, entry_price, rr, sl_open_position)
Calculates the target profit based on entry price, risk-reward ratio, and stop loss. The formula is `tp = entry price + (rr * (entry price - stop loss))`.
Parameters:
side (bool) : the trading side (true for long, false for short).
entry_price (float) : the entry price of the position.
rr (float) : the risk-reward ratio.
sl_open_position (float) : the stop loss price for the open position.
Returns: the calculated target profit value.
f_round_up(number, decimals)
Rounds up a number to a specified number of decimals.
Parameters:
number (float)
decimals (int)
Returns: The rounded-up number.
f_get_pip_size()
Calculates the pip size for the current instrument.
Returns: Pip size adjusted for Forex instruments or 1 for others.
f_table_get_position(value)
Maps a string to a table position constant.
Parameters:
value (string) : String representing the desired position (e.g., "Top Right").
Returns: The corresponding position constant or `na` for invalid values.

Daily Manipulation and Distribution Levels with Buy/Sell SignalsIndicator Summary:
This indicator is designed for intraday traders, highlighting key price levels and providing simple buy/sell signals based on price manipulation and distribution concepts.
Key Features:
Core Levels:
Manipulation Plus/Minus: Derived from the daily open and a portion of the daily range (e.g., 25%).
Distribution Levels: Daily high and low serve as ultimate targets or resistance/support levels.
Buy and Sell Signals:
Buy Signal: Triggered when the price crosses above the Manipulation Plus level. A green "BUY" label marks the entry.
Sell Signal: Triggered when the price crosses below the Manipulation Minus level. A red "SELL" label marks the entry.
Clean Chart Design:
Hides unnecessary clutter, showing only relevant key levels and labeled signals for clarity.
How to Use:
Entry Points:
Buy Entry: When a green "BUY" label appears after the price breaks above the Manipulation Plus level.
Sell Entry: When a red "SELL" label appears after the price breaks below the Manipulation Minus level.
Exit Strategy:
Take Profit: Use the Distribution Levels (daily high/low) as take-profit zones.
Stop Loss: Set just above/below the Manipulation Levels to manage risk effectively.
One to Two Trades per Session: Focus on high-probability moves to ensure clarity and reduce overtrading.
Who It’s For:
This indicator is ideal for traders seeking a structured and visual approach to intraday trading, with clear entry/exit criteria based on price manipulation and distribution theory. It simplifies decision-making and ensures clean chart setups without overwhelming visuals.
Position Size CalculatorThe provided Pine Script is a custom indicator titled "Position Size Calculator" designed to assist traders in calculating the appropriate size of a trading position based on predefined risk parameters. This script is intended to be overlaid on a trading chart, as indicated by `overlay=true`, allowing traders to visualize and adjust their risk and position size directly within the context of their trading strategy.
What It Does:
The core functionality of this script revolves around calculating the position size a trader should take based on three input parameters:
**Risk in USD (`Risk`)**: This represents the amount of money the trader is willing to risk on a single trade.
**Entry Price (`EntryPrice`)**: The price at which the trader plans to enter the market.
**Stop Loss (`StopLoss`)**: The price at which the trader plans to exit the market should the trade move against them, effectively limiting their loss.
The script calculates the position size using a function named `calculatePositionSize`, which performs the following steps:
It first calculates the `expectedLoss` by taking 90% (`0.9`) of the input risk. This implies that the script factors in a safety margin, assuming traders are willing to risk up to 90% of their stated risk amount per trade.
It then calculates the position size based on the distance between the Entry Price and the Stop Loss. This calculation adjusts based on whether the Entry Price is higher or lower than the Stop Loss, ensuring that the position size fits the risk profile regardless of trade direction.
The function returns several values: `risk`, `entryPrice`, `stopLoss`, `expectedLoss`, and `size`, which are then plotted on the chart.
How It Does It:
**Expected Loss Calculation**: By reducing the risk by 10% before calculating position size, the script provides a buffer to account for slippage or to ensure the trader does not fully utilize their risk budget on a single trade.
**Position Size Calculation**: The script calculates position size by dividing the adjusted risk (`expectedLoss`) by the price difference between the Entry Price and Stop Loss. This gives a quantitative measure of how many units of the asset can be bought or sold while staying within the risk parameters.
What Traders Can Use It For:
Traders can use this Position Size Calculator for several purposes:
- **Risk Management**: By determining the appropriate position size, traders can ensure that they do not overexpose themselves to market risk on a single trade.
- **Trade Planning**: Before entering a trade, the script allows traders to visualize their risk, entry, and exit points, helping them to make more informed decisions.
- **Consistency**: Using a standardized method for calculating position size helps traders maintain consistency in their trading approach, a key aspect of successful trading strategies.
- **Efficiency**: Automating the calculation of position size saves time and reduces the likelihood of manual calculation errors.
Overall, this Pine Script indicator is a practical tool for traders looking to implement strict risk management rules within their trading strategies, ensuring that each trade is sized appropriately according to their risk tolerance and market conditions.

CCI+EMA Strategy with Percentage or ATR TP/SL [Alifer]This is a momentum strategy based on the Commodity Channel Index (CCI), with the aim of entering long trades in oversold conditions and short trades in overbought conditions.
Optionally, you can enable an Exponential Moving Average (EMA) to only allow trading in the direction of the larger trend. Please note that the strategy will not plot the EMA. If you want, for visual confirmation, you can add to the chart an Exponential Moving Average as a second indicator, with the same settings used in the strategy’s built-in EMA.
The strategy also allows you to set internal Stop Loss and Take Profit levels, with the option to choose between Percentage-based TP/SL or ATR-based TP/SL.
The strategy can be adapted to multiple assets and timeframes:
Pick an asset and a timeframe
Zoom back as far as possible to identify meaningful positive and negative peaks of the CCI
Set Overbought and Oversold at a rough average of the peaks you identified
Adjust TP/SL according to your risk management strategy
Like the strategy? Give it a boost!
Have any questions? Leave a comment or drop me a message.
CAUTIONARY WARNING
Please note that this is a complex trading strategy that involves several inputs and conditions. Before using it in live trading, it is highly recommended to thoroughly test it on historical data and use risk management techniques to safeguard your capital. After backtesting, it's also highly recommended to perform a first live test with a small amount. Additionally, it's essential to have a good understanding of the strategy's behavior and potential risks. Only risk what you can afford to lose .
USED INDICATORS
1 — COMMODITY CHANNEL INDEX (CCI)
The Commodity Channel Index (CCI) is a technical analysis indicator used to measure the momentum of an asset. It was developed by Donald Lambert and first published in Commodities magazine (now Futures) in 1980. Despite its name, the CCI can be used in any market and is not just for commodities. The CCI compares current price to average price over a specific time period. The indicator fluctuates above or below zero, moving into positive or negative territory. While most values, approximately 75%, fall between -100 and +100, about 25% of the values fall outside this range, indicating a lot of weakness or strength in the price movement.
The CCI was originally developed to spot long-term trend changes but has been adapted by traders for use on all markets or timeframes. Trading with multiple timeframes provides more buy or sell signals for active traders. Traders often use the CCI on the longer-term chart to establish the dominant trend and on the shorter-term chart to isolate pullbacks and generate trade signals.
CCI is calculated with the following formula:
(Typical Price - Simple Moving Average) / (0.015 x Mean Deviation)
Some trading strategies based on CCI can produce multiple false signals or losing trades when conditions turn choppy. Implementing a stop-loss strategy can help cap risk, and testing the CCI strategy for profitability on your market and timeframe is a worthy first step before initiating trades.
2 — AVERAGE TRUE RANGE (ATR)
The Average True Range (ATR) is a technical analysis indicator that measures market volatility by calculating the average range of price movements in a financial asset over a specific period of time. The ATR was developed by J. Welles Wilder Jr. and introduced in his book “New Concepts in Technical Trading Systems” in 1978.
The ATR is calculated by taking the average of the true range over a specified period. The true range is the greatest of the following:
The difference between the current high and the current low.
The difference between the previous close and the current high.
The difference between the previous close and the current low.
The ATR can be used to set stop-loss orders. One way to use ATR for stop-loss orders is to multiply the ATR by a factor (such as 2 or 3) and subtract it from the entry price for long positions or add it to the entry price for short positions. This can help traders set stop-loss orders that are more adaptive to market volatility.
3 — EXPONENTIAL MOVING AVERAGE (EMA)
The Exponential Moving Average (EMA) is a type of moving average (MA) that places a greater weight and significance on the most recent data points.
The EMA is calculated by taking the average of the true range over a specified period. The true range is the greatest of the following:
The difference between the current high and the current low.
The difference between the previous close and the current high.
The difference between the previous close and the current low.
The EMA can be used by traders to produce buy and sell signals based on crossovers and divergences from the historical average. Traders often use several different EMA lengths, such as 10-day, 50-day, and 200-day moving averages.
The formula for calculating EMA is as follows:
Compute the Simple Moving Average (SMA).
Calculate the multiplier for weighting the EMA.
Calculate the current EMA using the following formula:
EMA = Closing price x multiplier + EMA (previous day) x (1-multiplier)
STRATEGY EXPLANATION
1 — INPUTS AND PARAMETERS
The strategy uses the Commodity Channel Index (CCI) with additional options for an Exponential Moving Average (EMA), Take Profit (TP) and Stop Loss (SL).
length : The period length for the CCI calculation.
overbought : The overbought level for the CCI. When CCI crosses above this level, it may signal a potential short entry.
oversold : The oversold level for the CCI. When CCI crosses below this level, it may signal a potential long entry.
useEMA : A boolean input to enable or disable the use of Exponential Moving Average (EMA) as a filter for long and short entries.
emaLength : The period length for the EMA if it is used.
2 — CCI CALCULATION
The CCI indicator is calculated using the following formula:
(src - ma) / (0.015 * ta.dev(src, length))
src is the typical price (average of high, low, and close) and ma is the Simple Moving Average (SMA) of src over the specified length.
3 — EMA CALCULATION
If the useEMA option is enabled, an EMA is calculated with the given emaLength .
4 — TAKE PROFIT AND STOP LOSS METHODS
The strategy offers two methods for TP and SL calculations: percentage-based and ATR-based.
tpSlMethod_percentage : A boolean input to choose the percentage-based method.
tpSlMethod_atr : A boolean input to choose the ATR-based method.
5 — PERCENTAGE-BASED TP AND SL
If tpSlMethod_percentage is chosen, the strategy calculates the TP and SL levels based on a percentage of the average entry price.
tp_percentage : The percentage value for Take Profit.
sl_percentage : The percentage value for Stop Loss.
6 — ATR-BASED TP AND SL
If tpSlMethod_atr is chosen, the strategy calculates the TP and SL levels based on Average True Range (ATR).
atrLength : The period length for the ATR calculation.
atrMultiplier : A multiplier applied to the ATR to set the SL level.
riskRewardRatio : The risk-reward ratio used to calculate the TP level.
7 — ENTRY CONDITIONS
The strategy defines two conditions for entering long and short positions based on CCI and, optionally, EMA.
Long Entry: CCI crosses below the oversold level, and if useEMA is enabled, the closing price should be above the EMA.
Short Entry: CCI crosses above the overbought level, and if useEMA is enabled, the closing price should be below the EMA.
8 — TP AND SL LEVELS
The strategy calculates the TP and SL levels based on the chosen method and updates them dynamically.
For the percentage-based method, the TP and SL levels are calculated as a percentage of the average entry price.
For the ATR-based method, the TP and SL levels are calculated using the ATR value and the specified multipliers.
9 — EXIT CONDITIONS
The strategy defines exit conditions for both long and short positions.
If there is a long position, it will be closed either at TP or SL levels based on the chosen method.
If there is a short position, it will be closed either at TP or SL levels based on the chosen method.
Additionally, positions will be closed if CCI crosses back above oversold in long positions or below overbought in short positions.
10 — PLOTTING
The script plots the CCI line along with overbought and oversold levels as horizontal lines.
The CCI line is colored red when above the overbought level, green when below the oversold level, and white otherwise.
The shaded region between the overbought and oversold levels is plotted as well.

swing tradeTHIS strategy is based on the
franklin ochao swing trade book
confirmed bullish - when ever stock closed above R2 (more bullish)
when ever stock closed between R1 AND R2 (moderatly bullish or consolidation phase with respect to previous trend)
entry1 for more bullish trend is buy at every dips means when ever price low below pivot when it open above the pivot
entry2 for more bullish trend is buy at low is below s1
keep strictly stoploss at s1 of previous day (r2 close day)
trend reversal is possible once stock close below s1 in 1hr time frame
virgin cpr or missed pivot is added a advantage
For bearish mode this vice verse
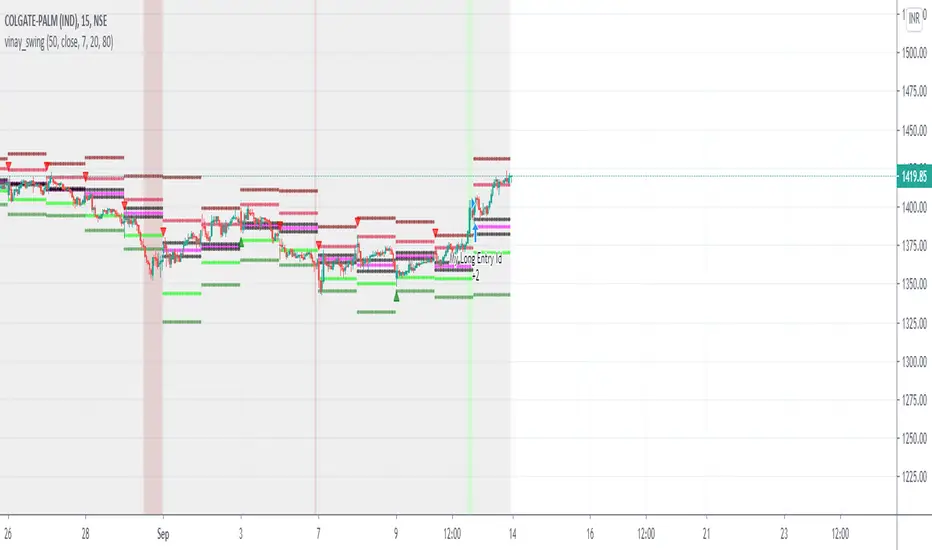
SPX_0DTE_EngineLibrary "SPX_0DTE_Engine"
getATM(price)
Parameters:
price (float)
getCallStrikes(atmStrike, count)
Parameters:
atmStrike (int)
count (int)
getPutStrikes(atmStrike, count)
Parameters:
atmStrike (int)
count (int)
generateOCCSymbol(underlying, year, month, day, optionType, strike)
Parameters:
underlying (string)
year (int)
month (int)
day (int)
optionType (string)
strike (int)
getAdaptiveReference(src, lookback)
Parameters:
src (float)
lookback (int)
detectLiquidityGrabHigh(high, low, close, volume, lookback)
Parameters:
high (float)
low (float)
close (float)
volume (float)
lookback (int)
detectLiquidityGrabLow(high, low, close, volume, lookback)
Parameters:
high (float)
low (float)
close (float)
volume (float)
lookback (int)
getVolatilityRegime(src, bbLength, bbMult)
Parameters:
src (float)
bbLength (int)
bbMult (float)
getESConfirmation(spxClose, esClose, spxHigh, esHigh, spxLow, esLow, lookback)
Parameters:
spxClose (float)
esClose (float)
spxHigh (float)
esHigh (float)
spxLow (float)
esLow (float)
lookback (int)
getDeltaBias(src, adaptiveRef, esClose, spxClose)
Parameters:
src (float)
adaptiveRef (float)
esClose (float)
spxClose (float)
getGammaZone(src, atmStrike)
Parameters:
src (float)
atmStrike (int)
getVegaRegime(vixSymbol)
Parameters:
vixSymbol (simple string)
isFailState(volRegime, hour, minute, vix, atr)
Parameters:
volRegime (int)
hour (int)
minute (int)
vix (float)
atr (float)
checkCallConfluence(liquidityGrabLow, volRegime, esConfirmation, failState, deltaBias, lowGamma)
Parameters:
liquidityGrabLow (bool)
volRegime (int)
esConfirmation (int)
failState (bool)
deltaBias (int)
lowGamma (bool)
checkPutConfluence(liquidityGrabHigh, volRegime, esConfirmation, failState, deltaBias, lowGamma)
Parameters:
liquidityGrabHigh (bool)
volRegime (int)
esConfirmation (int)
failState (bool)
deltaBias (int)
lowGamma (bool)
checkProfitTarget(entryPrice, currentPrice, targetPercent, isCall)
Parameters:
entryPrice (float)
currentPrice (float)
targetPercent (float)
isCall (bool)
checkStopLoss(entryPrice, currentPrice, stopPercent, isCall)
Parameters:
entryPrice (float)
currentPrice (float)
stopPercent (float)
isCall (bool)
checkTimeExit(hour, minute)
Parameters:
hour (int)
minute (int)
checkInvalidation(esConfirmation, isCallPosition)
Parameters:
esConfirmation (int)
isCallPosition (bool)
