Combined Indicator: Solar EMA and BWMACombined Indicator: Solar EMA and BWMA
This custom indicator combines two popular moving average techniques, the Exponential Moving Average (EMA) and the Barycenter Weighted Moving Average (BWMA), to provide insights into market trends and potential trade opportunities.
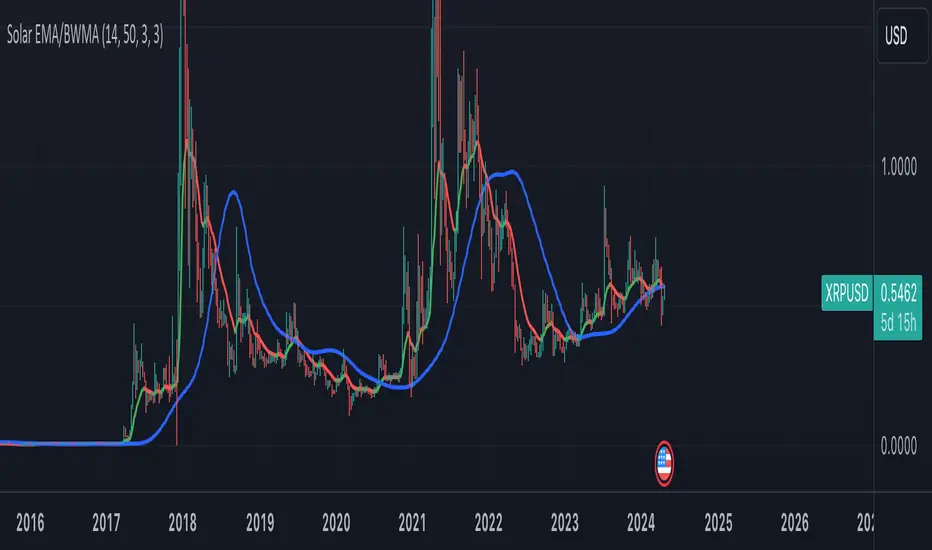
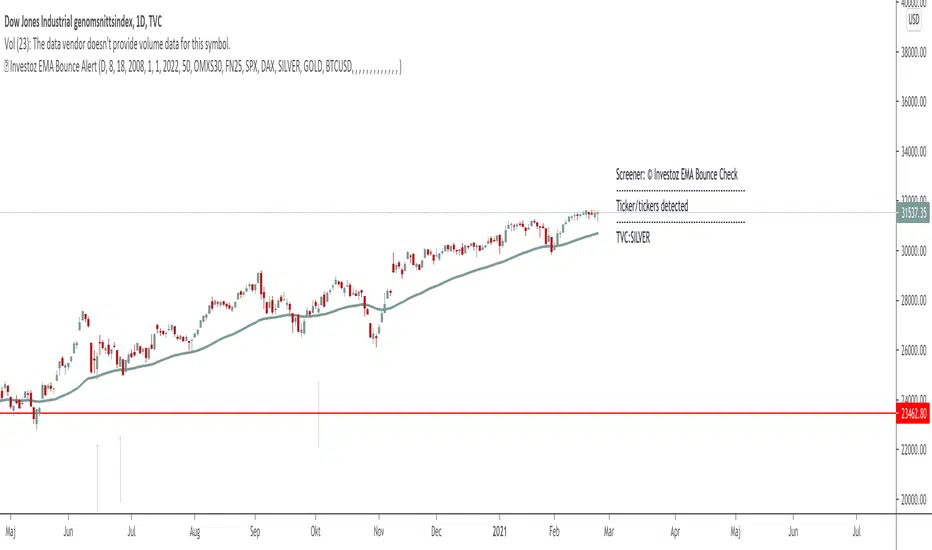
Solar EMA (Exponential Moving Average):
The Solar EMA is a dynamic moving average that reacts quickly to price changes while reducing lag.
It is plotted on the chart with customizable lengths, allowing traders to adapt to different market conditions.
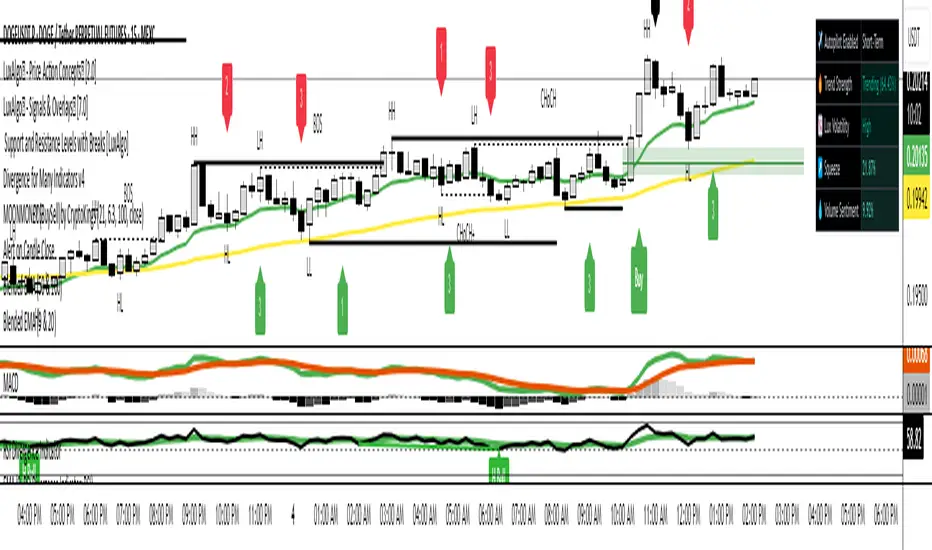
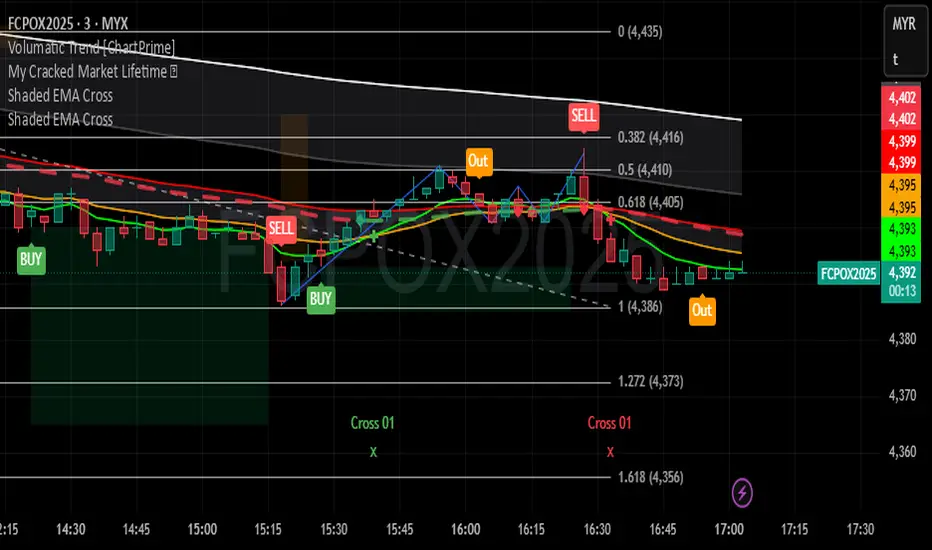
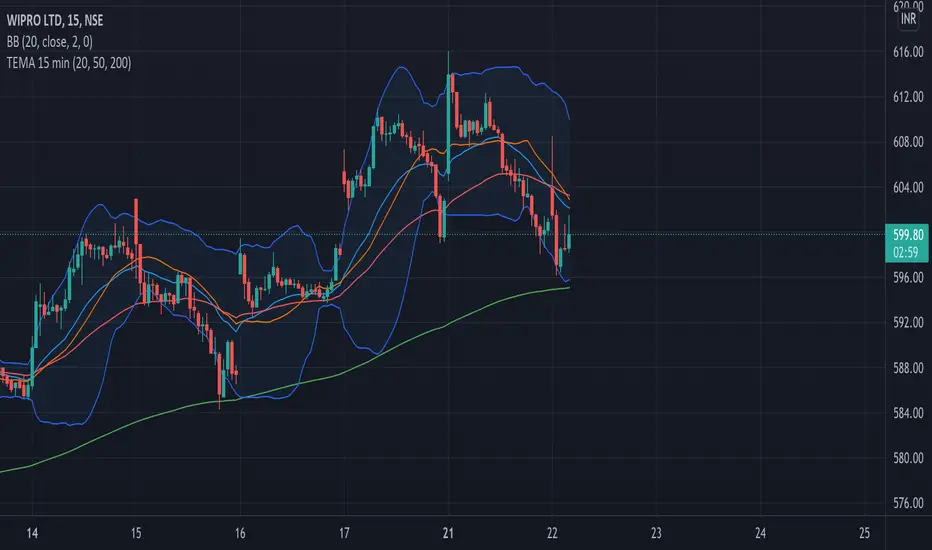
Bullish (upward) trends are indicated by a green line, bearish (downward) trends by a red line, and neutral periods by a yellow line.
BWMA (Barycenter Weighted Moving Average):
The BWMA is a weighted moving average that emphasizes recent price action while maintaining smoothness.
It is calculated using a combination of alpha and beta parameters, providing flexibility in tuning to specific market behaviors.
The BWMA line is plotted on the chart, with color indicating trend direction: blue for bullish, red for bearish, and gray for neutral.
Key Features:
Dynamic adaptation to different timeframes, adjusting lengths for both EMA and BWMA based on the selected timeframe.
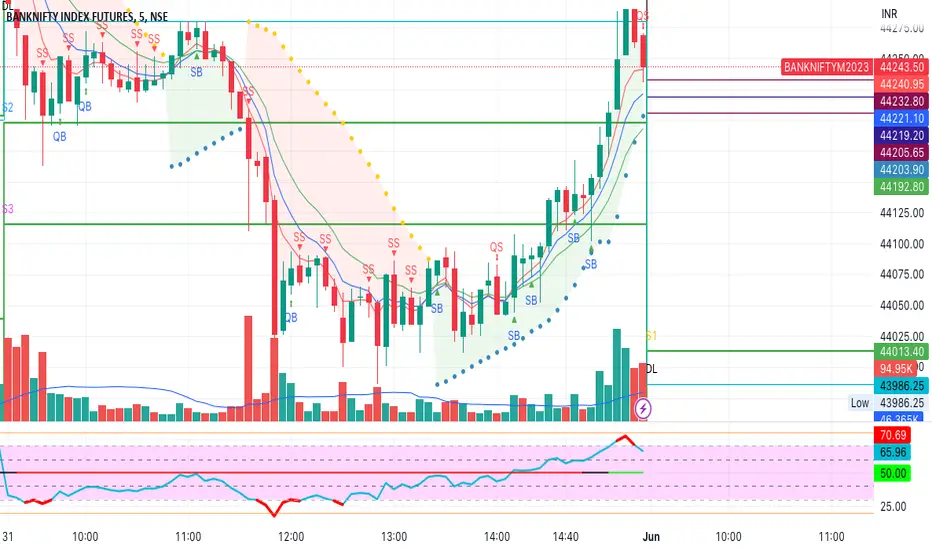
Detection of potential trend changes and significant market movements using a combination of EMA trend analysis and RSI (Relative Strength Index).
Buy and sell signals generated based on support and resistance levels, providing actionable insights for traders.
Usage:
Traders can use the Solar EMA and BWMA to identify trends, confirm trend reversals, and plan entry and exit points for trades.
Combining both moving averages offers a comprehensive view of market sentiment and enhances decision-making processes.
Disclaimer:
This indicator is intended for educational and informational purposes only and should not be construed as financial advice. Traders are encouraged to conduct their own research and analysis before making any trading decisions.
Pine Script® göstergesi