x5-smooth-ema[t90]Overview
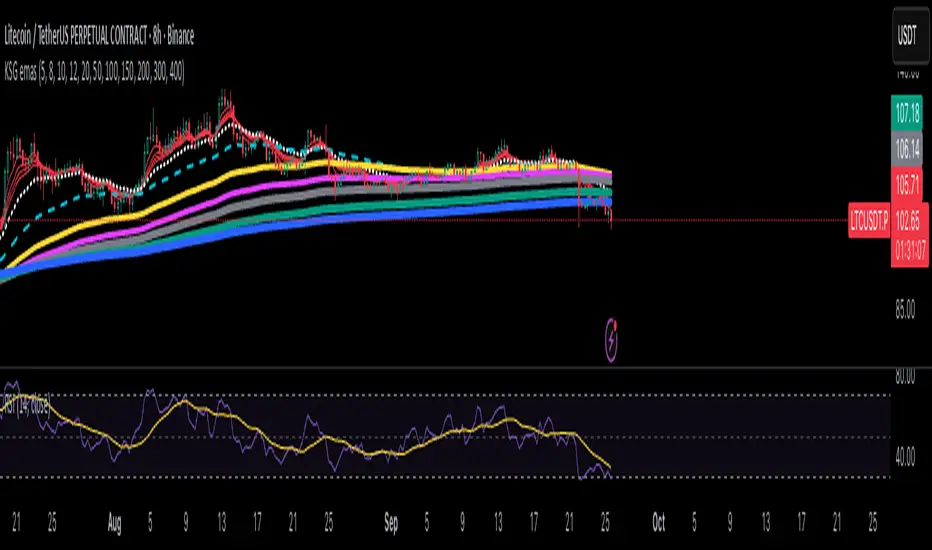
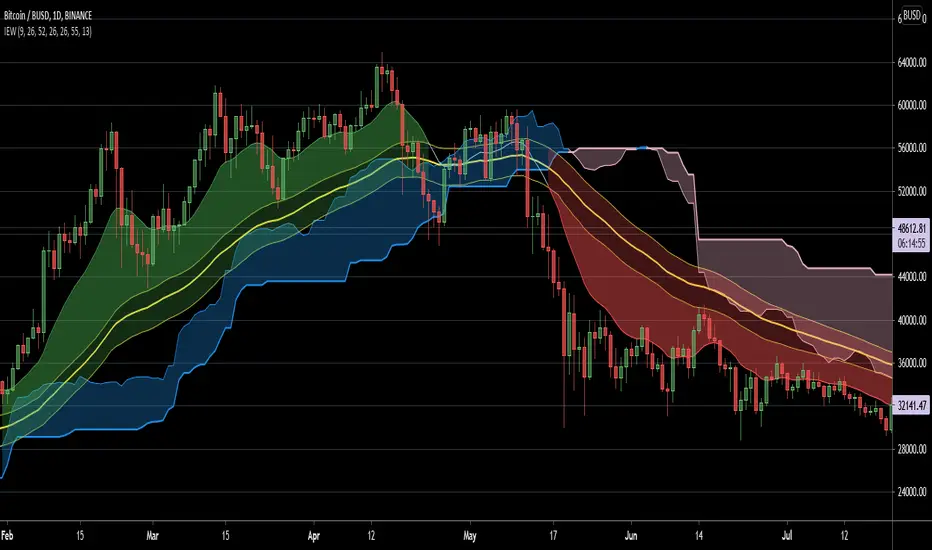
The x5 Smoothed EMA Flow is a trend-visualization tool designed to filter out market "noise" by applying a secondary smoothing layer to a base Exponential Moving Average (EMA).
How to Use
Trend Filtering: The "Flow" helps identify the true trend. When the ribbon is expanding and colored for a bullish trend, it signals strong, sustained momentum.
Noise Reduction: Unlike a standard EMA which can "whipsaw" during consolidation, the double-smoothed layers stay smoother for longer, helping traders stay in a position during minor pullbacks.
Trend Confirmation: Use the alignment of all smoothing layers to confirm a trend. When all layers transition to the same color, it indicates a high-probability trend shift.
Dynamic Support/Resistance: The ribbon acts as a depth-based support or resistance zone. Price often reacts to the "core" of the flow before continuing its primary move.
Settings
Source: Choose the price source (Close, HL2, etc.) for the initial calculation.
Base Length: Adjust the sensitivity. Shorter lengths are better for scalping; longer lengths are optimized for swing trading.
Color Settings: Fully customizable Bull and Bear colors to match your chart theme.
Disclaimer: This indicator is for educational purposes only. Moving averages are lagging indicators and should be used in conjunction with other forms of analysis. Past performance is not indicative of future results.
Pine Script® göstergesi