EMA Distance %# EMA Distance % - Daily Timeframe Analysis
## Overview
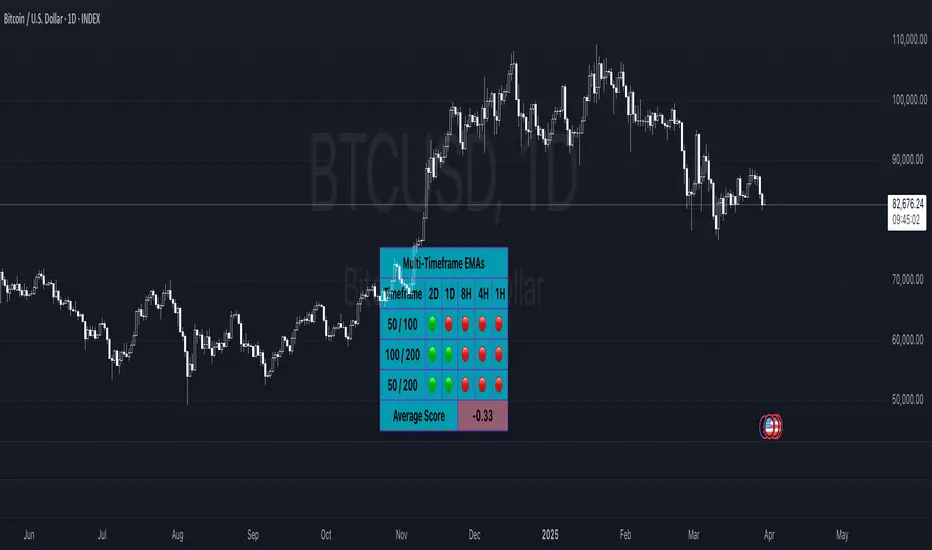
This indicator provides real-time analysis of price distance from key Exponential Moving Averages (EMA 10 and EMA 21) on the daily timeframe, regardless of your current chart timeframe. It displays both percentage and volatility-adjusted (ATR) distances in a clean, customizable table format.
## Key Features
- **Daily Timeframe Focus**: Always references daily EMA 10 and EMA 21 values, providing consistent analysis across all chart timeframes
- **Dual Distance Metrics**: Shows both percentage distance and ATR-normalized distance for comprehensive analysis
- **Customizable Table Position**: Position the data table anywhere on your chart (9 different locations available)
- **Color-Coded Results**: Green indicates price above EMA, red indicates price below EMA
- **Volatility Adjustment**: ATR distance provides context relative to the asset's typical price movements
## What It Shows
The indicator displays a table with the following information:
- **EMA Value**: Current daily EMA 10 and EMA 21 values
- **Distance %**: Percentage distance from each EMA (positive = above, negative = below)
- **ATR Distance**: How many Average True Range units the price is from each EMA
## Use Cases
- **Mean Reversion Trading**: Identify when price has moved significantly away from key EMAs
- **Trend Strength Analysis**: Gauge the strength of current trends relative to moving averages
- **Entry/Exit Timing**: Use ATR distances to identify potential reversal zones (typically 2-3+ ATR)
- **Multi-Timeframe Analysis**: View daily EMA relationships while analyzing shorter timeframes
- **Risk Management**: Understand volatility-adjusted distance for better position sizing
## Settings
- **Table Position**: Choose from 9 different table positions on your chart
- **ATR Period**: Customize the ATR calculation period (default: 14)
## Interpretation
- **Small distances (< 1% or < 1 ATR)**: Price near EMA support/resistance
- **Medium distances (1-3% or 1-2 ATR)**: Normal trending movement
- **Large distances (> 3% or > 2-3 ATR)**: Potential overextension, watch for mean reversion
Perfect for swing traders, position traders, and anyone using EMA-based strategies who wants quick access to daily timeframe EMA relationships without switching chart timeframes.
Pine Script® göstergesi