Pine Script® göstergesi
"ema" için komut dosyalarını ara
Pine Script® göstergesi
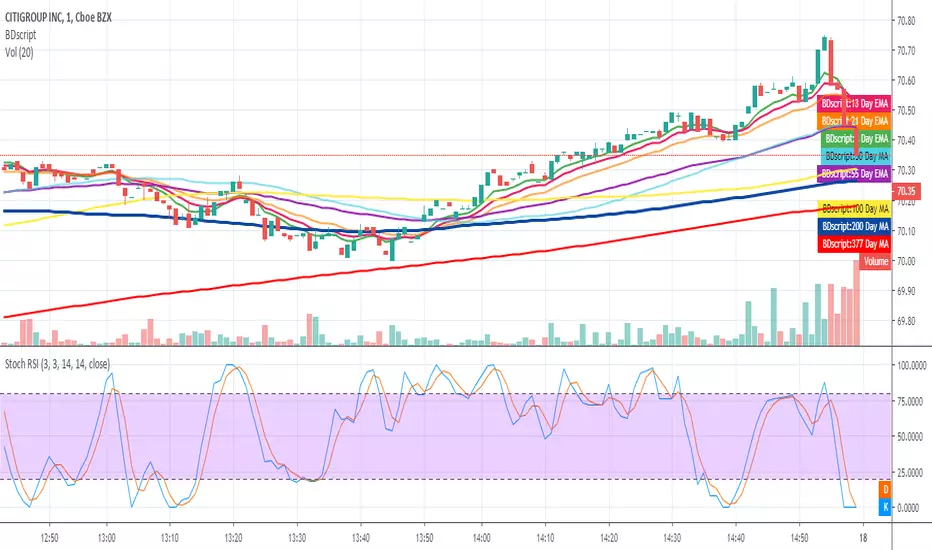
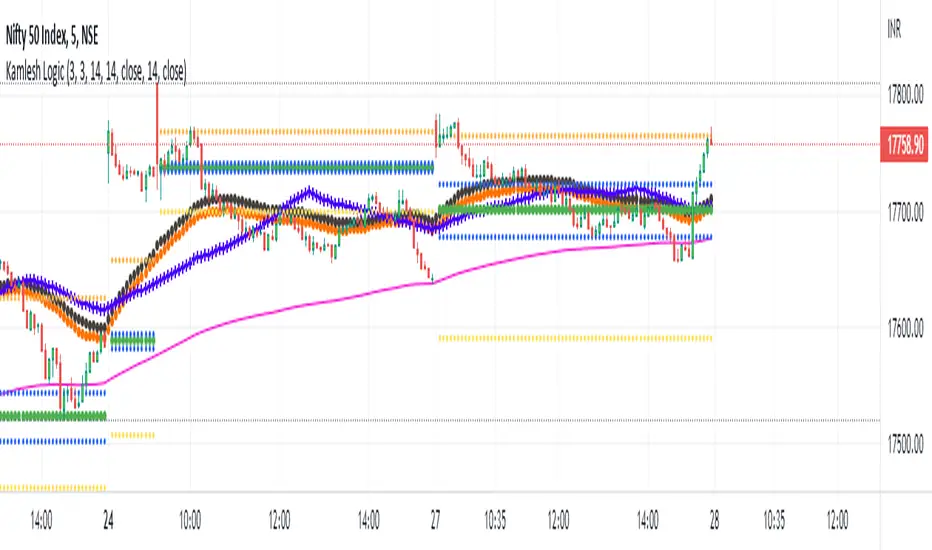
ZONEMAema 50 zone instead of just the ema line, just an indicator, you can modify the settings to make it the ema you prefer
Pine Script® göstergesi

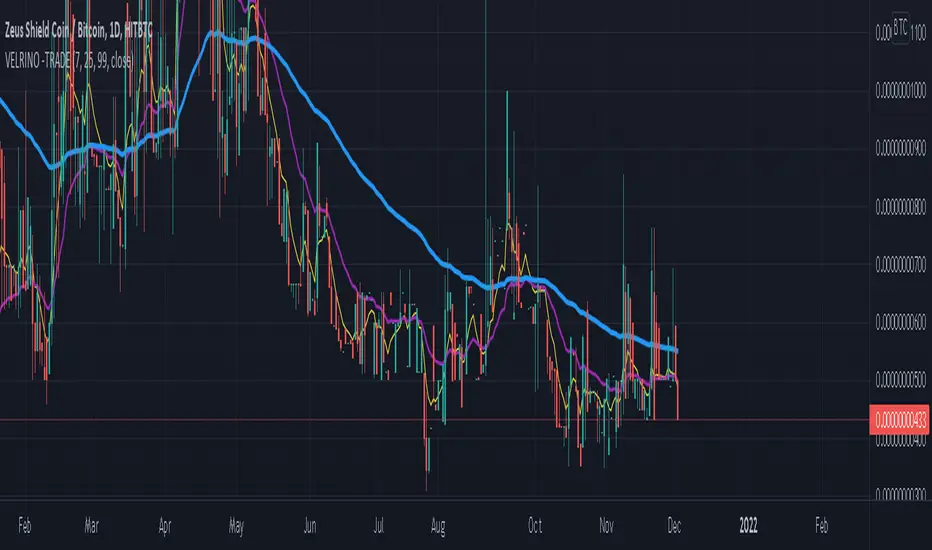
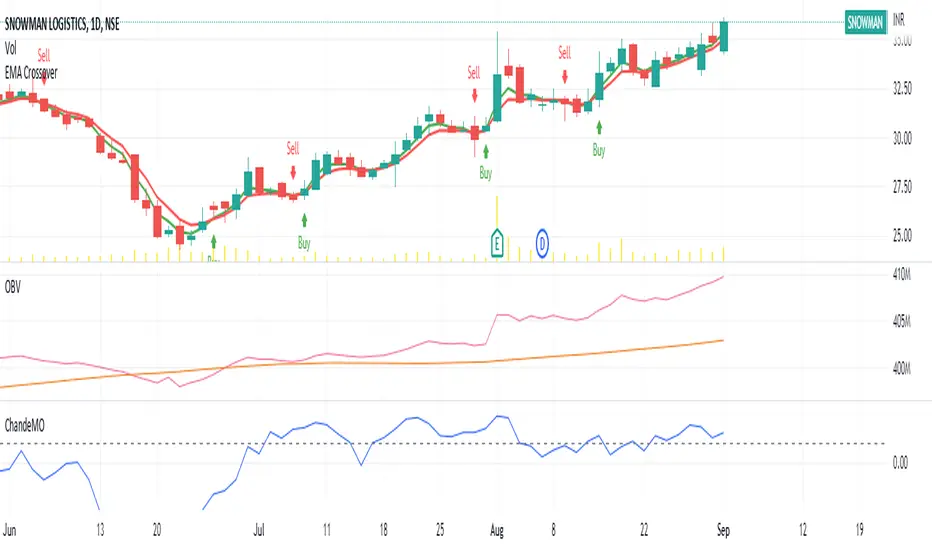
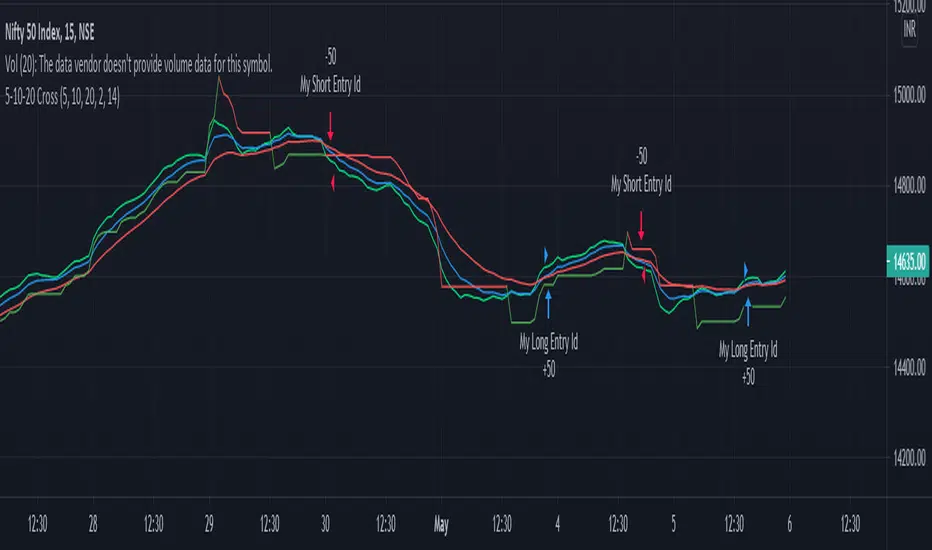
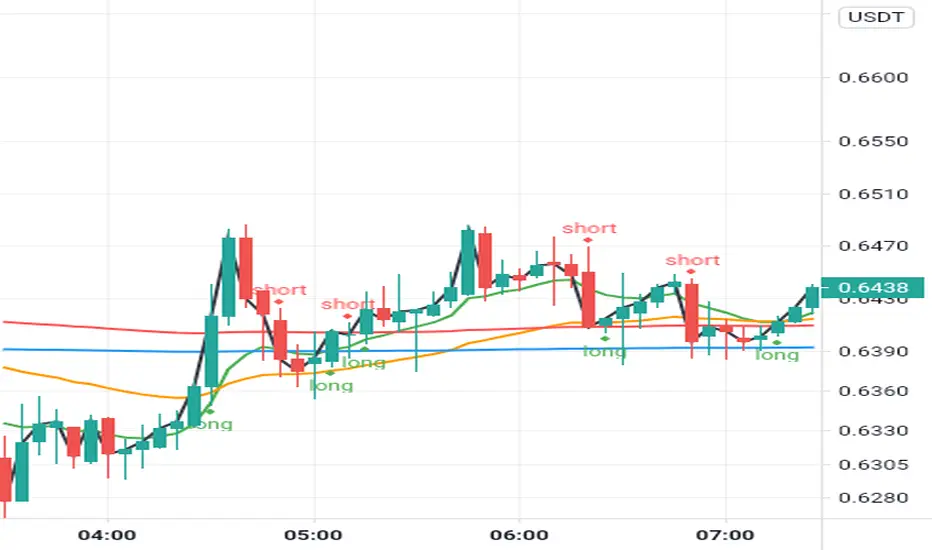
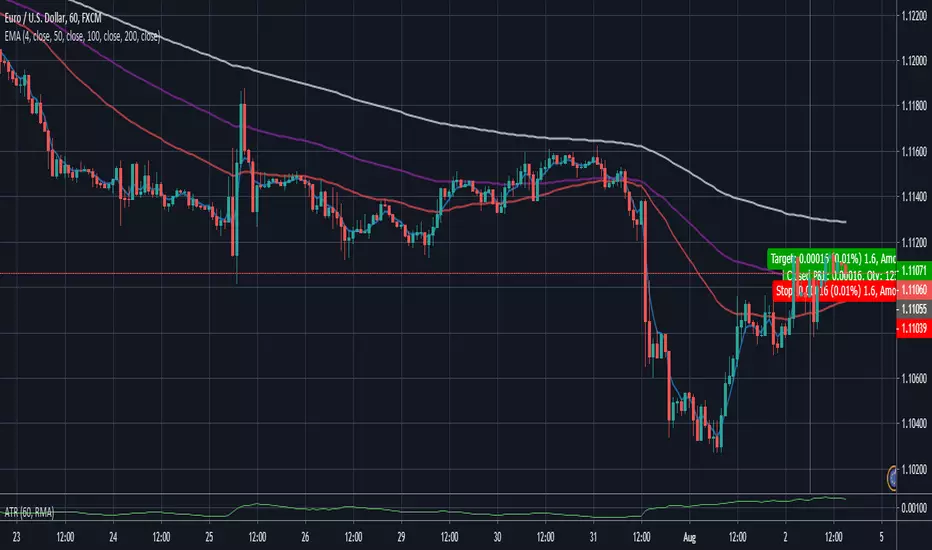
Ema(Ema10,10) Ema(Ema21,21) crossover strategyThis code works better in 1 hour for crypto currencies like BTC 1.51% or LTC.
It seems to beat the market. Feedback or improvement are welcome.
Pine Script® stratejisi

Pine Script® göstergesi

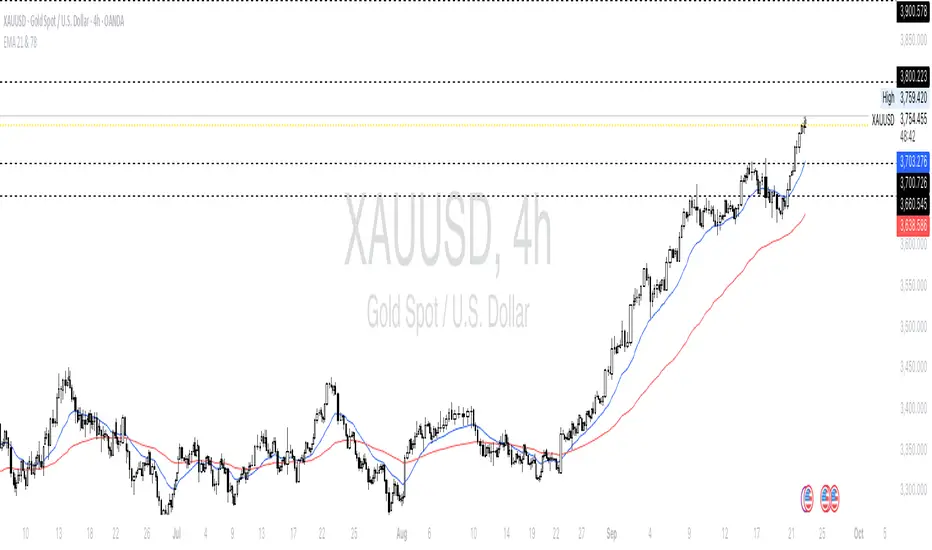
EMA 21 & 78 - With Instrument Nameonly add EMA21 and 78, I saw the 21 and 78 period is the most favor period when trading with gold
Pine Script® göstergesi
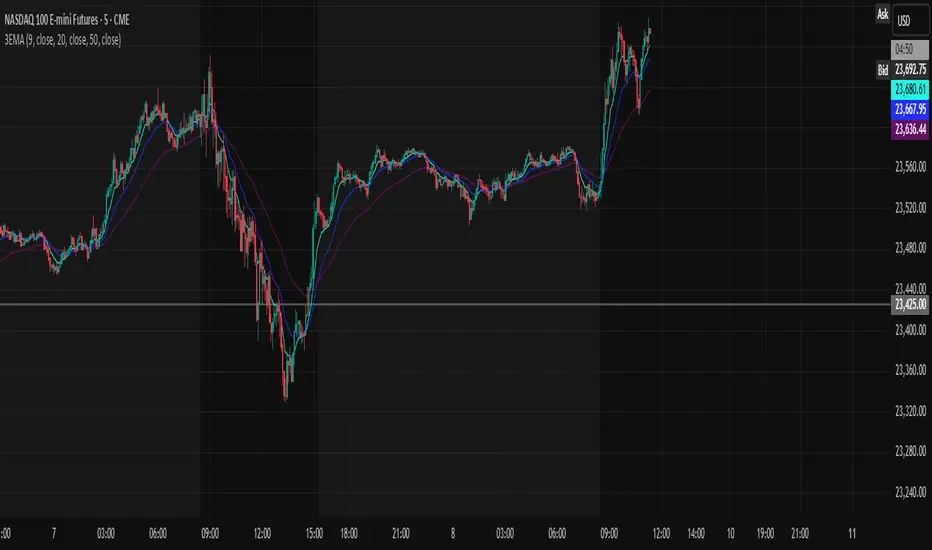
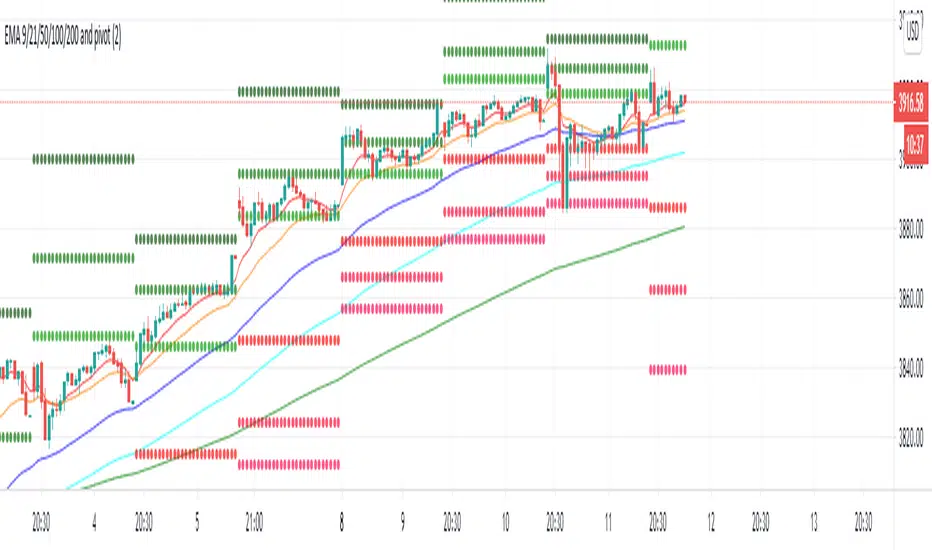
EMA 9, 20, 50Exponential Moving Averages of 9, 20, and 50. Used to gauge buy and sell opportunities in trending markets.
Pine Script® göstergesi
Pine Script® göstergesi
Pine Script® göstergesi
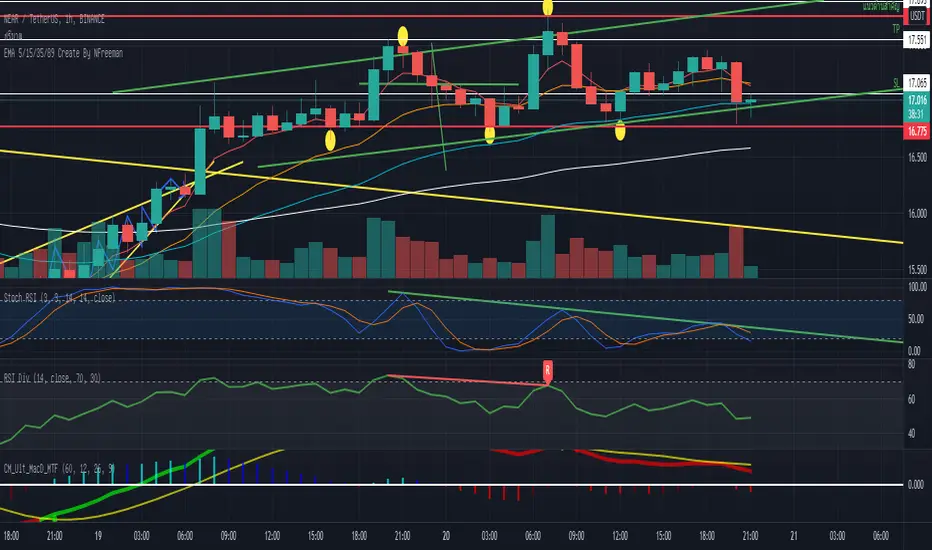
EMA 5/15/35/89 Create By NFreeman (Technical by CJ.SuperTrader)How to Use
เงื่อนไขการเล่นคือ UPTrend และดูแบบ TF1Day
-จังหวะการเข้าซื้อคือช่วงที่พักตัวลงมาระหว่าง EMA35-EMA89
-จังหวะที่ต้องบริหารความเสี่ยงคือช่วงหลุด EMA89
ขอให้ทุกคนเทรดได้ และมีความสุข
Pine Script® göstergesi
Pine Script® göstergesi

Pine Script® göstergesi
Pine Script® stratejisi
Pine Script® göstergesi
Pine Script® göstergesi

Pine Script® göstergesi
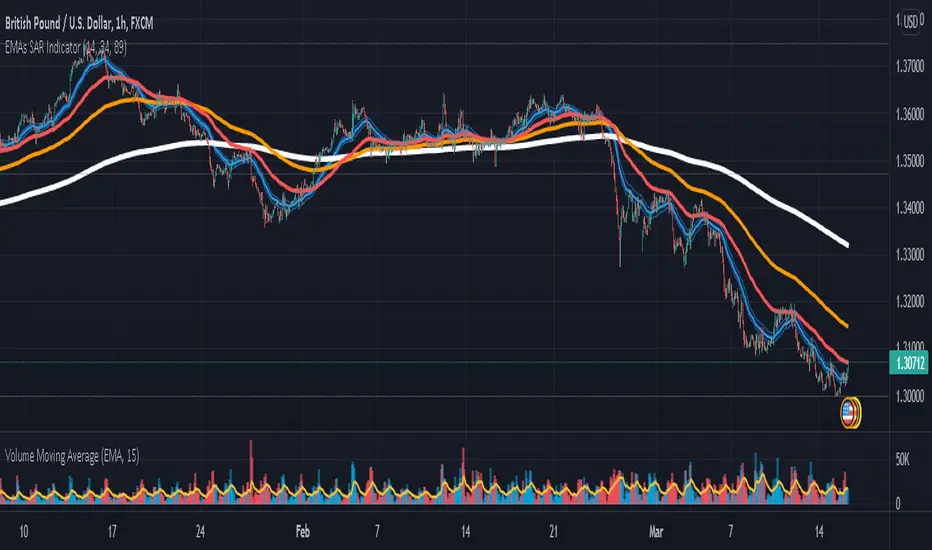
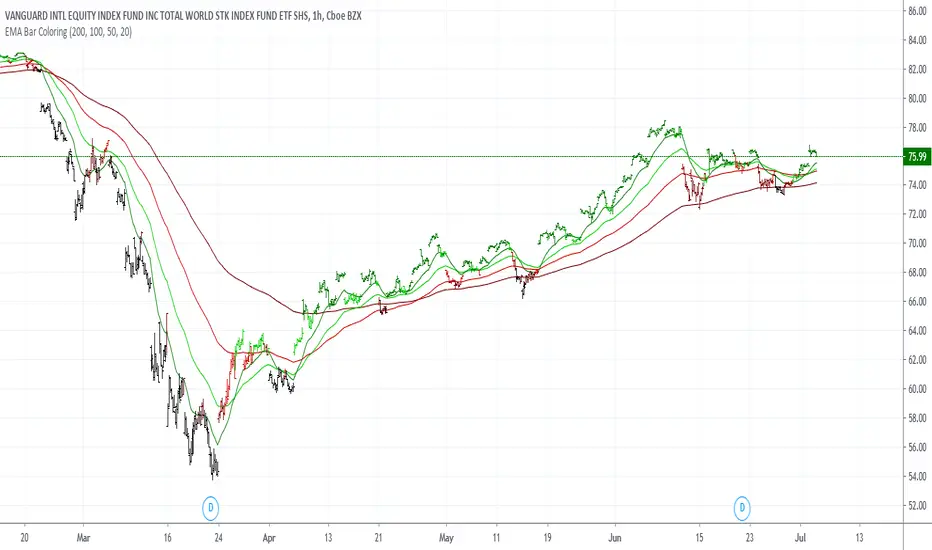
EMA Bar ColoringHi,
This is a simple visualization because I wanted to use tradingview on the cellphone with less Lines and Easy to understand.
There are 4 moving averages for each level of the closing price, the color changes.
The Moving averages can be seen in the option tab.
Also the plot of the closing prices can also be seen.
It works better with bar charts.
Best Regards,
RERS
Pine Script® göstergesi
Pine Script® göstergesi

Pine Script® göstergesi
Pine Script® göstergesi
Pine Script® göstergesi

Pine Script® göstergesi

Pine Script® göstergesi
