NY 4H Wyckoff State Machine [CHE] NY 4H Wyckoff State Machine — Full (Re-Entry, Breakout, Wick, Re-Accum/Distrib, Dynamic Table) — One-Candle Wyckoff Re-Entry (OCWR)
Summary
OCWR operationalizes a one-candle session workflow: mark the first four-hour New York candle, fix its high and low as the session range when the window closes, and drive entries through a Wyckoff-style state machine on intraday bars. The script adds an ATR-scaled buffer around the range and requires multi-bar acceptance before treating breaks or re-entries as valid. Optional wick-cluster evidence, a proximity retest, and simple volume or RSI gates increase selectivity. Background tints expose regimes, shapes mark events, a dynamic table explains the current state, and hidden plots supply alert payloads. The design reduces random flips and makes state transitions auditable without higher-timeframe calls.
Origin and name
Method name: One-Candle Wyckoff Re-Entry (OCWR)
Transcript origin: The source idea is a “stupid simple one-candle scalping” routine: mark the first New York four-hour candle (commonly between one and five in the morning New York time), drop to five minutes, observe accumulation inside, wait for a manipulation move outside, then trade the re-entry back inside. Stops go beyond the excursion extreme; targets are either a fixed reward multiple or the opposite side of the range. Preference is given to several manipulation candles. This indicator codifies that workflow with explicit states, acceptance counters, buffers, and optional quality filters. Any external performance claims are not part of the code.
Motivation: Why this design?
Session levels are widely respected, yet single-bar breaches around them are noisy. OCWR separates range discovery from trade logic. It locks the range at the end of the window, applies an ATR-scaled buffer to ignore marginal oversteps, and requires acceptance over several bars for breaks and re-entries. Wick evidence and optional retest proximity help confirm that an excursion likely cleared liquidity rather than launched a trend. This yields cleaner transitions from test to commitment.
What’s different vs. standard approaches?
Baseline: Static session lines or one-shot Wyckoff tags without process control.
Architecture: Dual long and short state machines; ATR-buffered edges; multi-bar acceptance for breaks and re-entries; optional wick dominance and cluster checks; optional retest tolerance; direct and opposite breakout paths; cooldown after fires; distribution timeout; dynamic table with highlighted row.
Practical effect: Fewer single-bar head-fakes, clearer hand-offs, and on-chart explanations of the machine’s view.
Wyckoff structure by example — OCWR on five minutes
One-candle setup:
On the four-hour chart, mark the first New York candle’s high and low, then switch to five minutes. Solid lines show the fixed range; dashed lines show ATR-buffered edges.
Long path (verbal mapping):
Phase A, Stopping Action: Price stabilizes inside the range.
Phase B, Consolidation: Sustained balance while the window is closed and after the range is fixed.
Phase C, Test (Spring): Excursion below the buffered low with preference for several outside bars and dominant lower wicks, then a return inside.
Re-entry acceptance: A required run of inside bars validates the test.
Phase D, Breakout to Markup: Long signal fires; stop beyond the excursion extreme; objective is the opposite range or a fixed reward multiple.
Phase E, Trend (Markup) and Re-Accumulation: Advance continues until target, stop, confirmation back against the box, or timeout. A pause inside trend may register as re-accumulation.
Short path mirrors the above: A UTAD-style move forms above the buffered high, then re-entry leads to Markdown and possible re-distribution.
Variant map (verbal):
Accumulation after a downtrend: with Spring and Test, or without Spring; both proceed to Markup and may pause in Re-Accumulation.
Distribution after an uptrend: with UTAD and Test, or without UTAD; both proceed to Markdown and may pause in Re-Distribution.
Note: Phases A through E occur within each variant and are not separate variants.
How it works (technical)
Session window: A configurable four-hour New York window records its high and low. At window end, the bounds are fixed for the session.
ATR buffer: A margin above and below the fixed range discourages triggers from tiny oversteps.
Inside and outside: Users choose close-based or wick-based detection. Overshoot requirements are expressed verbally as a fraction of the range with an optional absolute minimum.
Manipulation tracking: The machine counts bars spent outside and records the side extreme.
Re-entry acceptance: After a return inside, a specified number of inside bars must print before acceptance.
Direct and opposite breakouts: Direct breakouts from accumulation and opposite breakouts after manipulation are supported, subject to acceptance and optional filters.
Targets and exits: Choose the opposite boundary or a fixed reward multiple. Distribution ends on target, stop, confirmation back against the range, or timeout.
Context filters (optional): Volume above a scaled SMA, RSI thresholds, and a trend SMA for simple regime context.
Diagnostics: Background tints for regimes; arrows for re-entries; triangles for breakouts; table with row highlights; hidden plots for alert values.
Central table (Wyckoff console)
The table sits top-right and explains the machine’s stance. Columns: Structure label, plain-English description, active state pair for long and short, and human phase tags. Rows: Start and range building; accumulation branch with Spring and Test as well as direct breakout; Markup and re-accumulation; distribution branch with UTAD and Test as well as direct short breakout; Markdown and re-distribution. Only the active state cell is rewritten each last bar, for example “L_ACCUM slash S_ACCUM”. Row highlighting is context-aware: accumulation, Spring or UTAD, breakout, Markup or Markdown, and re-accumulation or re-distribution checks can highlight independently so users see simultaneous conditions. The table is created once, updated only on the last bar for efficiency, and functions as a read-only console to audit why a signal fired and where the path currently sits.
Parameter Guide
Session window and time zone: First four hours of New York by default; time zone “America/New_York”.
ATR length and buffer factor: Control buffer size; larger reduces sensitivity, smaller reacts faster.
Minimum overshoot (fraction and absolute): Demand meaningful extension beyond the buffer.
Break mode: Close-based is stricter; wick-based is more reactive.
Acceptance counts: Separate counts for break, re-entry, and opposite breakout; higher values reduce noise.
Minimum bars outside: Ensures manipulation is not a single spike.
Wick detection and clusters (optional): Dominance thresholds and cluster size within a short window.
Retest required and tolerance (optional): Gate re-entry by proximity to the buffered edge.
Volume and RSI filters (optional): Simple gates on activity and momentum.
TP mode and reward multiple: Opposite range or fixed multiple.
Cooldown and distribution timeout: Rate-limit signals and prevent endless distribution.
Visualization toggles: Background phases, labels, table, and helper lines.
Reading & Interpretation
Solid lines are the fixed session bounds; dashed lines are buffers. Backgrounds tint accumulation, manipulation, and distribution. Arrows show accepted re-entries; triangles show direct or opposite breakouts. Labels can summarize entry, stop, target, and risk. The table highlights the active row and the current state pair.
Practical Workflows & Combinations
OCWR baseline: Each morning, mark the New York four-hour candle, move to five minutes, prefer multi-bar manipulation outside, then wait for a qualified re-entry inside. Stop beyond the excursion extreme. Target the opposite range for conservative management or a fixed multiple for uniform sizing.
Trend following: Favor direct breakouts with trend alignment and no contradictory wick evidence.
Quality control: When noise rises, increase acceptance, raise the buffer factor, enable retest, and require wick clusters.
Discretionary confluences: Fair-value gaps and trend lines can be added by the user; they are not computed by this script.
Behavior, Constraints & Performance
Closed-bar confirmation is recommended when you require finality; live-bar conditions can change until close. The script does not call higher-timeframe data. It uses arrays, lines, labels, boxes, and a table; maximum bars back is five thousand; table updates are last-bar only. Known limits include compressed buffers in quiet sessions, unreliable wick evidence in thin markets, and session misalignment if the platform time zone is not New York.
Sensible Defaults & Quick Tuning
Start with ATR length fourteen, buffer factor near zero point fifteen, overshoot fraction near zero point ten, acceptance counts of two, minimum outside duration three, retest required on.
Too many flips: increase acceptance, raise buffer, enable retest, and tighten wick thresholds.
Too slow: reduce acceptance, lower buffer, switch to wick-based breaks, disable retest.
Noisy wicks: increase minimum wick ratio and cluster size, or disable wick detection.
What this indicator is—and isn’t
A session-anchored visualization and signal layer that formalizes a Wyckoff-style re-entry and breakout workflow derived from a single four-hour New York candle. It is not predictive and not a complete trading system. Use with structure analysis, risk controls, and position management.
Disclaimer
The content provided, including all code and materials, is strictly for educational and informational purposes only. It is not intended as, and should not be interpreted as, financial advice, a recommendation to buy or sell any financial instrument, or an offer of any financial product or service. All strategies, tools, and examples discussed are provided for illustrative purposes to demonstrate coding techniques and the functionality of Pine Script within a trading context.
Any results from strategies or tools provided are hypothetical, and past performance is not indicative of future results. Trading and investing involve high risk, including the potential loss of principal, and may not be suitable for all individuals. Before making any trading decisions, please consult with a qualified financial professional to understand the risks involved.
By using this script, you acknowledge and agree that any trading decisions are made solely at your discretion and risk.
Do not use this indicator on Heikin-Ashi, Renko, Kagi, Point-and-Figure, or Range charts, as these chart types can produce unrealistic results for signal markers and alerts.
Best regards and happy trading
Chervolino
"demand" için komut dosyalarını ara

Luxy Adaptive MA Cloud - Trend Strength & Signal Tracker V2Luxy Adaptive MA Cloud - Professional Trend Strength & Signal Tracker
Next-generation moving average cloud indicator combining ultra-smooth gradient visualization with intelligent momentum detection. Built for traders who demand clarity, precision, and actionable insights.
═══════════════════════════════════════════════
WHAT MAKES THIS INDICATOR SPECIAL?
═══════════════════════════════════════════════
Unlike traditional MA indicators that show static lines, Luxy Adaptive MA Cloud creates a living, breathing visualization of market momentum. Here's what sets it apart:
Exponential Gradient Technology
This isn't just a simple fill between two lines. It's a professionally engineered gradient system with 26 precision layers using exponential density distribution. The result? An organic, cloud-like appearance where the center is dramatically darker (15% transparency - where crossovers and price action occur), while edges fade gracefully (75% transparency). Think of it as a visual "heat map" of trend strength.
Dynamic Momentum Intelligence
Most MA clouds only show structure (which MA is on top). This indicator shows momentum strength in real-time through four intelligent states:
- 🟢 Bright Green = Explosive bullish momentum (both MAs rising strongly)
- 🔵 Blue = Weakening bullish (structure intact, but momentum fading)
- 🟠 Orange = Caution zone (bearish structure forming, weak momentum)
- 🔴 Deep Red = Strong bearish momentum (both MAs falling)
The cloud literally tells you when trends are accelerating or losing steam.
Conditional Performance Architecture
Every calculation is optimized for speed. Disable a feature? It stops calculating entirely—not just hidden, but not computed . The 26-layer gradient only renders when enabled. Toggle signals off? Those crossover checks don't run. This makes it one of the most efficient cloud indicators available, even with its advanced visual system.
Zero Repaint Guarantee
All signals and momentum states are based on confirmed bar data only . What you see in historical data is exactly what you would have seen trading live. No lookahead bias. No repainting tricks. No signals that "magically" appear perfect in hindsight. If a signal shows in history, it would have triggered in real-time at that exact moment.
Educational by Design
Every single input includes comprehensive tooltips with:
- Clear explanations of what each parameter does
- Practical examples of when to use different settings
- Recommended configurations for scalping, day trading, and swing trading
- Real-world trading impact ("This affects entry timing" vs "This is visual only")
You're not just getting an indicator—you're learning how to use it effectively .
═══════════════════════════════════════════════
THE GRADIENT CLOUD - TECHNICAL DETAILS
═══════════════════════════════════════════════
Architecture:
26 precision layers for silk-smooth transitions
Exponential density curve - layers packed tightly near center (where crossovers happen), spread wider at edges
75%-15% transparency range - center is highly opaque (15%), edges fade gracefully (75%)
V-Gradient design - emphasizes the action zone between Fast and Medium MAs
The Four Momentum States:
🟢 GREEN - Strong Bullish
Fast MA above Medium MA
Both MAs rising with momentum > 0.02%
Action: Enter/hold LONG positions, strong uptrend confirmed
🔵 BLUE - Weak Bullish
Fast MA above Medium MA
Weak or flat momentum
Action: Caution - bullish structure but losing strength, consider trailing stops
🟠 ORANGE - Weak Bearish
Medium MA above Fast MA
Weak or flat momentum
Action: Warning - bearish structure developing, consider exits
🔴 RED - Strong Bearish
Medium MA above Fast MA
Both MAs falling with momentum < -0.02%
Action: Enter/hold SHORT positions, strong downtrend confirmed
Smooth Transitions: The momentum score is smoothed using an 8-bar EMA to eliminate noise and prevent whipsaws. You see the true trend , not every minor fluctuation.
═══════════════════════════════════════════════
FLEXIBLE MOVING AVERAGE SYSTEM
═══════════════════════════════════════════════
Three Customizable MAs:
Fast MA (default: EMA 10) - Reacts quickly to price changes, defines short-term momentum
Medium MA (default: EMA 20) - Balances responsiveness with stability, core trend reference
Slow MA (default: SMA 200, optional) - Long-term trend filter, major support/resistance
Six MA Types Available:
EMA - Exponential; faster response, ideal for momentum and day trading
SMA - Simple; smooth and stable, best for swing trading and trend following
WMA - Weighted; middle ground between EMA and SMA
VWMA - Volume-weighted; reflects market participation, useful for liquid markets
RMA - Wilder's smoothing; used in RSI/ADX, excellent for trend filters
HMA - Hull; extremely responsive with minimal lag, aggressive option
Recommended Settings by Trading Style:
Scalping (1m-5m):
Fast: EMA(5-8)
Medium: EMA(10-15)
Slow: Not needed or EMA(50)
Day Trading (5m-1h):
Fast: EMA(10-12)
Medium: EMA(20-21)
Slow: SMA(200) for bias
Swing Trading (4h-1D):
Fast: EMA(10-20)
Medium: EMA(34-50)
Slow: SMA(200)
Pro Tip: Start with Fast < Medium < Slow lengths. The gradient works best when there's clear separation between Fast and Medium MAs.
═══════════════════════════════════════════════
CROSSOVER SIGNALS - CLEAN & RELIABLE
═══════════════════════════════════════════════
Golden Cross ⬆ LONG Signal
Fast MA crosses above Medium MA
Classic bullish reversal or trend continuation signal
Most reliable when accompanied by GREEN cloud (strong momentum)
Death Cross ⬇ SHORT Signal
Fast MA crosses below Medium MA
Classic bearish reversal or trend continuation signal
Most reliable when accompanied by RED cloud (strong momentum)
Signal Intelligence:
Anti-spam filter - Minimum 5 bars between signals prevents noise
Clean labels - Placed precisely at crossover points
Alert-ready - Built-in ALERTS for automated trading systems
No repainting - Signals based on confirmed bars only
Signal Quality Assessment:
High-Quality Entry:
Golden Cross + GREEN cloud + Price above both MAs
= Strong bullish setup ✓
Low-Quality Entry (skip or wait):
Golden Cross + ORANGE cloud + Choppy price action
= Weak bullish setup, likely whipsaw ✗
═══════════════════════════════════════════════
REAL-TIME INFO PANEL
═══════════════════════════════════════════════
An at-a-glance dashboard showing:
Trend Strength Indicator:
Visual display of current momentum state
Color-coded header matching cloud color
Instant recognition of market bias
MA Distance Table:
Shows percentage distance of price from each enabled MA:
Green rows : Price ABOVE MA (bullish)
Red rows : Price BELOW MA (bearish)
Gray rows : Price AT MA (rare, decision point)
Distance Interpretation:
+2% to +5%: Healthy uptrend
+5% to +10%: Getting extended, caution
+10%+: Overextended, expect pullback
-2% to -5%: Testing support
-5% to -10%: Oversold zone
-10%+: Deep correction or downtrend
Customization:
4 corner positions
5 font sizes (Tiny to Huge)
Toggle visibility on/off
═══════════════════════════════════════════════
HOW TO USE - PRACTICAL TRADING GUIDE
═══════════════════════════════════════════════
STRATEGY 1: Trend Following
Identify trend : Wait for GREEN (bullish) or RED (bearish) cloud
Enter on signal : Golden Cross in GREEN cloud = LONG, Death Cross in RED cloud = SHORT
Hold position : While cloud maintains color
Exit signals :
• Cloud turns ORANGE/BLUE = momentum weakening, tighten stops
• Opposite crossover = close position
• Cloud turns opposite color = full reversal
STRATEGY 2: Pullback Entries
Confirm trend : GREEN cloud established (bullish bias)
Wait for pullback : Price touches or crosses below Fast MA
Enter when : Price rebounds back above Fast MA with cloud still GREEN
Stop loss : Below Medium MA or recent swing low
Target : Previous high or when cloud weakens
STRATEGY 3: Momentum Confirmation
Your setup triggers : (e.g., chart pattern, support/resistance)
Check cloud color :
• GREEN = proceed with LONG
• RED = proceed with SHORT
• BLUE/ORANGE = skip or reduce size
Use gradient as confluence : Not as primary signal, but as momentum filter
Risk Management Tips:
Never enter against the cloud color (don't LONG in RED cloud)
Reduce position size during BLUE/ORANGE (transition periods)
Place stops beyond Medium MA for swing trades
Use Slow MA (200) as final trend filter - don't SHORT above it in uptrends
═══════════════════════════════════════════════
PERFORMANCE & OPTIMIZATION
═══════════════════════════════════════════════
Tested On:
Crypto: BTC, ETH, major altcoins
Stocks: SPY, AAPL, TSLA, QQQ
Forex: EUR/USD, GBP/USD, USD/JPY
Indices: S&P 500, NASDAQ, DJI
═══════════════════════════════════════════════
TRANSPARENCY & RELIABILITY
═══════════════════════════════════════════════
Educational Focus:
Detailed tooltips on every input
Clear documentation of methodology
Practical examples in descriptions
Teaches you why , not just what
Open Logic:
Momentum calculation: (Fast slope + Medium slope) / 2
Smoothing: 8-bar EMA to reduce noise
Thresholds: ±0.02% for strong momentum classification
Everything is transparent and explainable
═══════════════════════════════════════════════
COMPLETE FEATURE LIST
═══════════════════════════════════════════════
Visual Components:
26-layer exponential gradient cloud
3 customizable moving average lines
Golden Cross / Death Cross labels
Real-time info panel with trend strength
MA distance table
Calculation Features:
6 MA types (EMA, SMA, WMA, VWMA, RMA, HMA)
Momentum-based cloud coloring
Smoothed trend strength scoring
Conditional performance optimization
Customization Options:
All MA lengths adjustable
All colors customizable (when gradient disabled)
Panel position (4 corners)
Font sizes (5 options)
Toggle any feature on/off
Signal Features:
Anti-spam filter (configurable gap)
Clean, non-overlapping labels
Built-in alert conditions
No repainting guarantee
═══════════════════════════════════════════════
IMPORTANT DISCLAIMERS
═══════════════════════════════════════════════
This indicator is for educational and informational purposes only
Not financial advice - always do your own research
Past performance does not guarantee future results
Use proper risk management - never risk more than you can afford to lose
Test on paper/demo accounts before using with real money
Combine with other analysis methods - no single indicator is perfect
Works best in trending markets; less effective in choppy/sideways conditions
Signals may perform differently in different timeframes and market conditions
The indicator uses historical data for MA calculations - allow sufficient lookback period
═══════════════════════════════════════════════
CREDITS & TECHNICAL INFO
═══════════════════════════════════════════════
Version: 2.0
Release: October 2025
Special Thanks:
TradingView community for feedback and testing
Pine Script documentation for technical reference
═══════════════════════════════════════════════
SUPPORT & UPDATES
═══════════════════════════════════════════════
Found a bug? Comment below with:
Ticker symbol
Timeframe
Screenshot if possible
Steps to reproduce
Feature requests? I'm always looking to improve! Share your ideas in the comments.
Questions? Check the tooltips first (hover over any input) - most answers are there. If still stuck, ask in comments.
═══════════════════════════════════════════════
Happy Trading!
Remember: The best indicator is the one you understand and use consistently. Take time to learn how the cloud behaves in different market conditions. Practice on paper before going live. Trade smart, manage risk, and may the trends be with you! 🚀

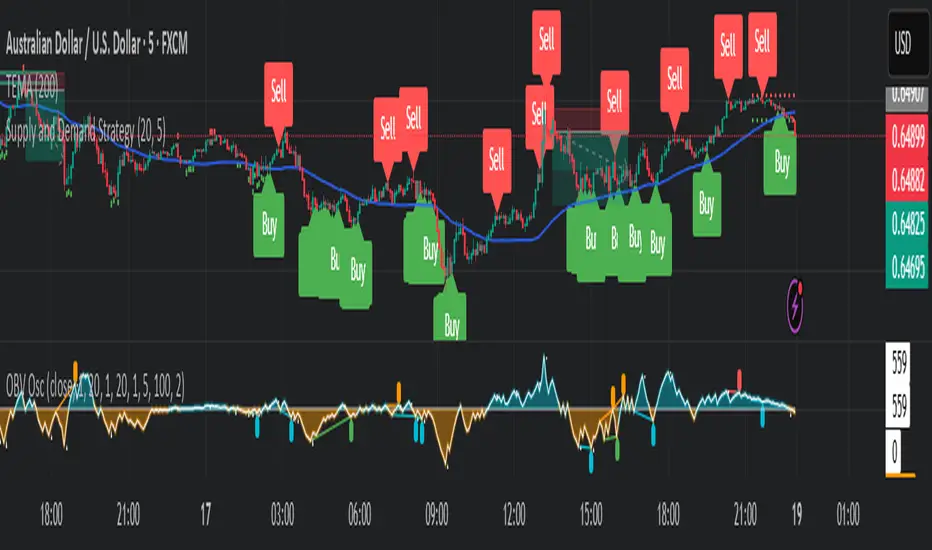
Smart Money Concepts Pro – OB, FVG, Liquidity + Trade SetupsThis script is a complete Smart Money Concepts (SMC) toolkit designed for traders who want clean and actionable charts without clutter.
It combines the most important institutional concepts into one indicator:
Order Blocks (OB): auto-detection of bullish and bearish order blocks with mitigation tracking, merging and TTL (time-to-live).
Fair Value Gaps (FVG): automatic gap recognition with size filters, mitigation tracking and lifetime control.
Liquidity Pools (EQH/EQL): equal highs and equal lows marked with tolerance (ATR-based or fixed).
Break of Structure (BOS): up/down structure shifts plotted directly on the chart.
Multi-Timeframe (HTF): option to use higher timeframe data (e.g. H4, Daily) for stronger zones.
Trend Filter: show zones only in the direction of market structure.
Trade Setups: automatic signals for OB Retest + Trend setups, with entry, stop-loss and take-profit levels (custom R-R).
Flexible Zone Extension: choose between extending zones to the live bar or fixed box width for a cleaner look when scrolling.
Features
Fully customizable (pivot length, ATR filters, box width, TTL, zone colors)
Separate presets for Scalping, Intraday, Swing trading styles
Visual trade planning with entry/SL/TP lines and optional labels
Works across all markets (crypto, forex, indices, stocks)
How to use
Bias: identify overall direction (BOS + HTF zones).
Wait: for price to return to an unmitigated OB or FVG.
Entry: take the setup signal (OB retest + trend filter).
Risk: stop-loss at opposite OB boundary.
Target: TP based on chosen R-R multiple (default 2R).
⚡ Whether you scalp short-term moves or swing trade HTF zones, this indicator gives you a clear institutional edge in spotting supply/demand imbalances and high-probability setups.

Wolfe Waves [BigBeluga]🔵 OVERVIEW
The Wolfe Waves pattern was first introduced by Bill Wolfe , a trader and analyst in the 1980s–1990s who specialized in market geometry and natural rhythm cycles. Wolfe observed that price often forms symmetrical wave structures that anticipate equilibrium points where supply and demand meet. These formations, called Wolfe Waves , gained popularity as a reliable pattern for forecasting both short- and long-term reversals.
The Wolfe Waves indicator automatically detects these patterns in real time. It tracks sequences of five pivots (points 1 through 5) and connects them with wave lines. Users can select either Bullish or Bearish Wolfe Waves depending on their trading bias. When the pattern fails, the lines automatically turn red to highlight invalidation.
🔵 CONCEPTS
Five-Point Structure – Wolfe Waves are defined by five pivots (1–5), which together form the basis of the wave pattern.
Bullish Pattern – Occurs when price compresses downward into point 5, signaling a potential upside reversal.
Bearish Pattern – Occurs when price extends upward into point 5, forecasting a downside reversal.
Validation & Failure – The pattern is considered valid once all five pivots form; if price fails to respect the expected breakout, the indicator marks the structure as broken with red lines.
🔵 FEATURES
Automatic detection of Bullish and Bearish Wolfe Waves.
Labels each pivot (1–5) on the chart for clarity.
Draws connecting lines between pivots to visualize the wave structure.
Projects target/dashed lines (EPA/ETA) based on Wolfe Wave geometry.
Lines automatically turn red when the pattern is broken, giving immediate feedback.
Customizable color scheme for bullish (lime) and bearish (orange) waves.
Adjustable sensitivity for pivot detection.
🔵 HOW TO USE
Choose between Bullish or Bearish mode depending on your analysis.
Watch for the formation of all five pivots; the indicator labels them clearly.
Look for potential entries near point 5, with the expectation that price will travel toward the projected EPA line.
Use invalidation (lines turning red) as a risk management warning to exit failed setups.
Combine with momentum, volume, or higher-timeframe analysis to increase reliability.
🔵 CONCLUSION
The Wolfe Waves brings the classic Wolfe Wave theory into an automated TradingView tool. Inspired by Bill Wolfe’s original concept of natural market cycles, this indicator detects, labels, and validates Wolfe Waves in real time. With automatic invalidation marking and customizable settings, it offers traders a structured way to harness one of the most well-known geometric reversal patterns.

ZS Master Vision Pro - Advanced Multi-Timeframe Trading SystemZS MASTER VISION PRO - PROFESSIONAL TRADING SUITE
Created by Zakaria Safri
A comprehensive, all-in-one trading system combining multiple proven technical analysis methods into a single, powerful indicator. Designed for traders who demand precision, clarity, and actionable signals across all timeframes.
KEY FEATURES
CORE TREND ALGORITHM
Adaptive ATR-based trend detection with dynamic support and resistance zones. Features Type A and Type B signal modes for different trading styles, strong signal detection in key reversal zones, and optional EMA source smoothing for noise reduction.
MULTI-LAYER EMA CLOUD SYSTEM
Five customizable EMA cloud layers for multi-timeframe analysis with theme-adaptive color coding across five professional themes. Optional line display for detailed MA tracking with configurable periods from scalping to position trading.
WAVE TREND OSCILLATOR
Advanced momentum oscillator with channel-based calculations featuring smart reversal detection at extreme overbought and oversold levels. Includes directional strength confirmation and customizable sensitivity with adjustable reaction periods.
DIVERGENCE SCANNER
Detects four types of divergence automatically:
- Regular Bullish: Price making lower lows while oscillator making higher lows
- Regular Bearish: Price making higher highs while oscillator making lower highs
- Hidden Bullish: Trend continuation signals in uptrends
- Hidden Bearish: Trend continuation signals in downtrends
Automatic fractal-based detection with clear visual labels on chart.
MARKET BIAS INDICATOR
Heikin Ashi-based trend strength analysis with real-time bias calculation showing Bullish or Bearish combined with Strong or Weak conditions. Smoothed for cleaner signals and perfect for trend confirmation.
MOMENTUM SYSTEM
Proprietary momentum calculation using adaptive smoothing with growing and falling state detection. Normalized values for consistent interpretation and responsive to rapid market changes.
DYNAMIC SUPPORT AND RESISTANCE
Automatic pivot-based support and resistance level detection with adjustable left and right bar lookback. Non-repainting levels with visual clarity through color-coded lines.
LIVE INFORMATION DASHBOARD
Real-time market analysis panel displaying current trend direction, market bias based on Heikin Ashi, Wave Trend status and value, and momentum trend with state. Customizable display options with theme-adaptive colors.
VISUAL CUSTOMIZATION
FIVE PROFESSIONAL COLOR THEMES:
Pro - Modern green and red color scheme (default)
Classic - Traditional teal and red combination
Cyberpunk - Neon cyan and magenta contrast
Ocean - Blue and orange contrast
Sunset - Gold and red warmth
SIGNAL STYLES:
Labels with emoji indicators (BUY with rocket, SELL with bear, STRONG with lightning)
Arrows for clean minimal appearance
Triangles for classic approach
DISPLAY OPTIONS:
Color-coded candles following trend direction
Trend background highlighting for instant trend recognition
Optional EMA line display for detailed analysis
Adjustable transparency levels for personal preference
SMART ALERTS
Pre-configured alert conditions for all major signals:
Buy signals for standard entry opportunities
Sell signals for standard exit or short opportunities
Strong buy signals for high-confidence long entries
Strong sell signals for high-confidence short entries
Bullish divergence detection alerts
Bearish divergence detection alerts
Alert messages automatically include ticker symbol, current price, and specific signal type for quick decision making.
HOW TO USE
FOR TREND TRADERS:
Enable EMA Clouds with focus on Cloud 5 featuring 50 and 200 period moving averages. Wait for trend background color change to confirm direction. Enter on STRONG signals aligned with higher timeframe trend direction. Use support and resistance levels for strategic exits.
FOR SWING TRADERS:
Enable Wave Trend Oscillator information display. Look for oversold and overbought reversal setups. Confirm potential reversals with divergence scanner. Enter on smart reversal signals with proper risk management.
FOR SCALPERS:
Use Type B signal mode for more frequent trading signals. Enable Cloud 1 with 5 and 13 periods for quick trend confirmation. Focus on momentum growing and falling states for entry timing. Take quick entries on regular buy and sell signals.
FOR POSITION TRADERS:
Use Type A mode with higher ATR multiplier set to 3.0 or above. Enable only Cloud 5 with 50 and 200 periods for major trend confirmation. Only take STRONG signals for highest probability setups. Hold positions through minor pullbacks and noise.
RECOMMENDED SETTINGS
STOCKS ON DAILY TIMEFRAME:
Trend Period: 180
ATR Period: 155
ATR Multiplier: 2.1
Signal Mode: Type A
FOREX ON HOURLY AND 4-HOUR TIMEFRAMES:
Trend Period: 150
ATR Period: 120
ATR Multiplier: 2.5
Signal Mode: Type A
CRYPTOCURRENCY ON 15-MINUTE AND 1-HOUR TIMEFRAMES:
Trend Period: 100
ATR Period: 80
ATR Multiplier: 3.0
Signal Mode: Type B
SCALPING ON 1-MINUTE AND 5-MINUTE TIMEFRAMES:
Trend Period: 50
ATR Period: 40
ATR Multiplier: 2.0
Signal Mode: Type B
WHAT IS INCLUDED
Trend Analysis using ATR-based adaptive algorithm
Five EMA Cloud Layers for multi-timeframe confluence
Wave Trend Oscillator for momentum and reversal detection
Divergence Scanner detecting four types of divergence
Market Bias using Heikin Ashi-based trend strength
Momentum System with advanced momentum tracking
Support and Resistance Levels with automatic pivot detection
Live Dashboard showing real-time market analysis
Smart Alerts featuring six pre-configured alert types
Five Color Themes offering professional visual options
TECHNICAL DETAILS
CALCULATION METHODS:
Average True Range (ATR) for volatility adaptation
Exponential Moving Average (EMA) and Simple Moving Average (SMA) for trend smoothing
Wave Trend channel oscillator for momentum analysis
Fractal-based divergence detection algorithm
Heikin Ashi transformation for bias calculation
Logarithmic momentum calculation for precision
PERFORMANCE CHARACTERISTICS:
Optimized for maximum speed and efficiency
No repainting signals ensuring reliability
Works on all timeframes from 1 minute to monthly
Compatible with all instruments including stocks, forex, crypto, and futures
RISK DISCLAIMER
This indicator is a technical analysis tool and should not be used as the sole basis for trading decisions. Always use proper risk management and never risk more than you can afford to lose. Combine with other analysis methods and practice on demo accounts first. Past performance does not guarantee future results. Trading carries substantial risk and is not suitable for all investors.
SUPPORT AND UPDATES
Regular updates and continuous improvements
Based on proven technical analysis principles
Developed following Pine Coders best practices and standards
Clean, well-documented, and optimized code structure
WHY CHOOSE ZS MASTER VISION PRO
All-in-one solution eliminating the need for multiple indicators
Highly customizable to adapt to your specific trading style
Professional grade analysis with institutional-quality standards
Clean interface that is not cluttered or confusing
Works everywhere across all markets and all timeframes
Smart signals filtered for quality over quantity
Beautiful design featuring five professional color themes
Active development with regular improvements and updates
Transform your trading with ZS Master Vision Pro today.
Version 2.0 | Created by Zakaria Safri | Pine Script Version 5

Swing Points LiquiditySwing Points Liquidity
Unlock advanced swing detection and liquidity zone marking for smarter trading decisions.
Overview:
Swing Points Liquidity automatically identifies key swing highs and swing lows using a five-candle “palm” structure, marking each significant price turn with precise labels: “BSL swing high” for potential bearish liquidity and “SSL swing low” for potential bullish liquidity. This transparent swing logic provides a robust way to highlight areas where price is most likely to react—making it an invaluable tool for traders applying Smart Money Concepts, supply and demand, or liquidity-based strategies.
How It Works:
The indicator scans every candle on your chart to detect and label swing highs and lows.
A swing high (“BSL swing high”) is identified when a central candle’s high is greater than the highs of the previous two and next two candles.
A swing low (“SSL swing low”) is identified when a central candle’s low is lower than the lows of the previous two and next two candles.
Labels are plotted for every detected swing point, providing clear visualization of important market liquidity levels on any symbol and timeframe.
How to Use:
Liquidity levels marked by the indicator are potential price reversal zones. To optimize your entries, combine these levels with confirmation signals such as reversal candlestick patterns, order blocks, or fair value gaps (FVGs).
When you see a “BSL swing high” or “SSL swing low” label, observe the price action at that area—if a reliable reversal pattern or order block/FVG forms, it can signal a high-probability trade opportunity.
These marked liquidity swings are also excellent for locating confluence zones, setting stop losses, and identifying where institutional activity or smart money may trigger significant moves. Always use market structure and price action in conjunction with these levels for greater consistency and confidence in your trading.
Features:
Customizable label display for swing highs (BSL) and swing lows (SSL)
Automatic detection using robust 5-candle palm logic
Works with all symbols and chart timeframes
Lightweight, clear visual style—easy for manual and algorithmic traders
Notes:
The indicator requires at least two candles both before and after each swing point, so labels will start appearing after enough historical data is loaded.
For deeper historical analysis, simply scroll left or zoom out on your chart to load more candles—the indicator will automatically process and display swing points on all available data.

BTC Flow Dashboard (Spot Premium + OI + Funding)It builds a single flows dashboard that shows whether real spot demand (fiat buyers) or leveraged perps (futures traders) are driving BTC, and then cross-checks that with Open Interest (OI) and funding pressure—all normalized so you can spot regime shifts and squeeze risk fast.
How to read it (practical playbook)
Continuation (healthier trend)
Price ↑, premium > 0 and rising, oiZ ≥ 0 → spot sponsoring the move; perps chase → add on pullbacks.
Leverage-led & vulnerable
Price ↑, premium < 0, fundZ > 0 (expensive longs) → crowding → fade extensions / expect sharp pullbacks.
Buyable dip / absorption
Price ↓, premium ≥ 0 (spot supporting), oiZ flat/down, fundZ ≤ 0 → selling looks weak → scale into reversals.
Exhaustion / mean reversion
premZ ≥ +2 after a run → flows unusually hot → take profits / tighten risk.
premZ ≤ −2 into key support → capitulation risk but also bounce setups if OI/funding aren’t pressuring.

US Construction Spending & Manufacturing Employment YoY % ChangeUsage Notes: Timeframe: Use a monthly chart, as TTLCONS and MANEMP are monthly data. Other timeframes result in interpolation.
Data Availability: As of October 2025, TTLCONS is available until July 2025 and MANEMP until August 2025 (automatically via TradingView).
The Unsung Heroes: Why C&M Are the True Indicators
Imagine the economy is a highly sensitive vehicle. Quarterly reported GDP is like a quarterly glance at the odometer—it's slow, often delayed, and clearly refers to the past. Anyone who wants to predict future developments needs something much faster.
This is where construction and manufacturing come into play. These two sectors are the machine builders of the economy and provide us with real-time feedback. They form the backbone of economic forecasting for several important reasons:
1. Monetary policy indicators: Both sectors are highly sensitive to monetary policy developments, such as interest rate changes. If developers are unable to finance large residential or commercial projects and manufacturers postpone capital-intensive factory expansions, for example, declines in construction demand would quickly affect other sectors.
2. The backbone of the secondary sector: These industries constitute the secondary sector of the economy, meaning they are concerned with the actual transformation and production of goods, not just the extraction of raw materials or the provision of intangible services. One could argue that while they only account for about 15% of GDP in the US, their impact is massive and cyclical.
3. The timeliness advantage: Forget quarterly lags. Both construction output and manufacturing employment data are released monthly. This timely, frequent data allows analysts to assess economic momentum much more quickly than if they had to wait for delayed GDP reports.
In the US, some analysts have even titled their articles with the bold claim: "Housing construction is the business cycle." Fluctuations in housing construction are frequent and large, and a decline in activity is almost always accompanied by a subsequent decline in GDP.

Europe Session LinesThis simple script marks the start of the European trading sessions:
08:00 a.m. London trading session
09:00 a.m. Frankfurt trading session
The settings of the lines can be changed. (thickness, colour, type).
It can be used on Futures and CFDs for example for FDAX, FTSE100 but also for GOLD, Silver and EURO- and GBP based FX pairs as supply or demand zone with the change of character trading setup.

Previous Day & Week High/Low LevelsPrevious Day & Week High/Low Levels is a precision tool designed to help traders easily identify the most relevant price levels that often act as strong support or resistance areas in the market. It automatically plots the previous day’s and week’s highs and lows, as well as the current day’s developing internal high and low. These levels are crucial reference points for intraday, swing, and even position traders who rely on price action and liquidity behavior.
Key Features
Previous Day High/Low:
The indicator automatically draws horizontal lines marking the highest and lowest prices from the previous trading day.
These levels are widely recognized as potential zones where the market may react again — either rejecting or breaking through them.
Previous Week High/Low:
The script also tracks and displays the high and low from the last completed trading week.
Weekly levels tend to represent stronger liquidity pools and broader institutional zones, which makes them especially important when aligning higher timeframe context with lower timeframe entries.
Internal Daily High/Low (Real-Time Tracking):
While the day progresses, the indicator dynamically updates the current day’s internal high and low.
This allows traders to visualize developing market structure, identify intraday ranges, and anticipate potential breakouts or liquidity sweeps.
Multi-Timeframe Consistency:
All levels — daily and weekly — remain visible across any chart timeframe, from 1 minute to 1 day or higher.
This ensures traders can maintain perspective and avoid losing track of key zones when switching views.
Customizable Visuals:
The colors, line thickness, and label visibility can be easily adjusted to match personal charting preferences.
This makes the indicator adaptable to any trading style or layout, whether minimalistic or detailed.
How to Use
Identify Key Reaction Zones:
Observe how price interacts with the previous day and week levels. Rejections, consolidations, or clean breakouts around these lines often signal strong liquidity areas or potential directional moves.
Combine with Market Structure or Liquidity Concepts:
The indicator works perfectly with supply and demand analysis, liquidity sweeps, order block strategies, or simply classic support/resistance techniques.
Scalping and Intraday Trading:
On lower timeframes (1m–15m), the daily levels help identify intraday turning points.
On higher timeframes (1h–4h or daily), the weekly levels provide broader context and directional bias.
Risk Management and Planning:
Using these levels as reference points allows for more precise stop placement, target setting, and overall trade management.
Why This Indicator Helps
Markets often react strongly around previous highs and lows because these zones contain trapped liquidity, pending orders, or institutional decision points.
By having these areas automatically mapped out, traders gain a clear and objective view of where price is likely to respond — without needing to manually draw lines every day or week.
Whether you’re a beginner still learning about price structure, or an advanced trader refining entries within liquidity zones, this tool simplifies the process and keeps your charts clean, consistent, and data-driven.

ETH Smart Money Order Blocks Detector derek
This script helps identify potential Order Blocks (institutional price zones) on the chart based on Breaks of Structure (BOS).
It automatically highlights demand zones (green blocks) and supply zones (red blocks), making it easier to read institutional market flow.
Ideal for traders using Smart Money Concepts (SMC) or market structure analysis.
Compatible with any asset and timeframe.
🔹 Bullish OB = potential buy entry zone
🔹 Bearish OB = potential sell or resistance zone
Author: Derek 🧠💹

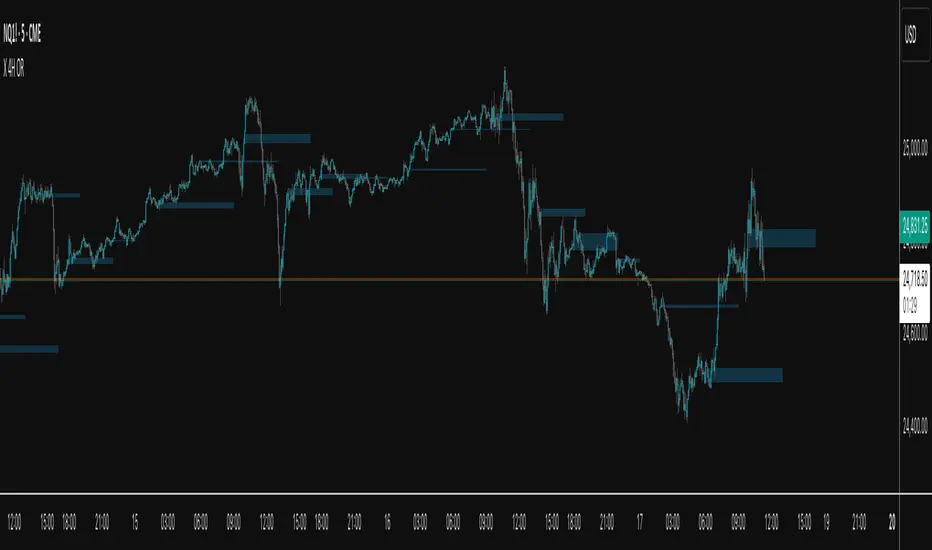
X 4H ORThis indicator plots the 30-second opening range (high/low) for six New-York–time anchors—2am, 6am, 10am, 2pm, 6pm, and 10pm—and extends each box to a fixed end time (e.g., 2am→9am, 6am→1pm, etc.). It samples true 30-second data regardless of the chart timeframe, so the captured highs/lows are precise.
What it does
Builds the first 30s OR for each selected anchor and draws a time-anchored box for that session.
Archives every day’s boxes (up to a cap) so you can study how price interacts with past ranges.
Adds per-anchor show toggles to display the latest box for that anchor.
Adds a global History toggle to show/hide all archived boxes without deleting them (clean view vs. context view).
Uses borderless, color-coded fills per anchor to avoid edge distortion while keeping levels easy to read.
Why it’s useful
Quickly spot session inflection zones where liquidity, breakouts, or reversals cluster.
Compare how current price trades relative to recent session ranges for bias and risk framing.
Perform lightweight post-session review/backtesting on OR breaks, retests, and range rotations.
Keep charts decluttered on demand (latest only), or flip on history for deeper context.
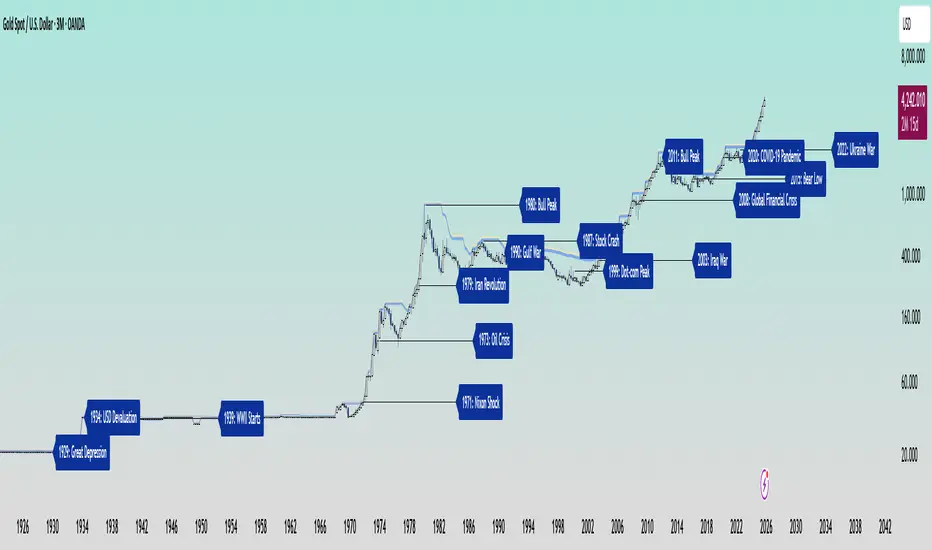
Gold and Bitcoin: The Evolution of Value!The Eternal Luster of Gold
In the dawn of time, when the earth was young and rivers whispered secrets to the stones, a wanderer named Elara found a gleam in the silt of a sun-kissed stream. It was pure gold, radiant like a captured star fallen from the heavens. She held it in her palm, feeling its warmth pulse like a heartbeat, and in that moment, humanity’s soul awakened to the allure of eternity.
As seasons turned to centuries, gold wove itself into the story of empires. In ancient Egypt, pharaohs crowned themselves with its glow, believing it to be the flesh of gods. It built pyramids that reached for the sky and tombs that guarded kings forever. Across the sands in Mesopotamia, merchants traded it for spices and silks, its weight a promise of power and trust.
Translation moment: Gold became the first universal symbol of value. People trusted it more than words or promises because it did not rust, fade, or vanish.
The Greeks saw in gold not only wealth but wisdom, the symbol of the sun’s eternal fire. Alexander the Great carried it across the continent, forging an empire of golden threads. Rome rose on its back, minting coins whose clink echoed through history.
Through the ages, gold endured the rush of California’s dreamers, the halls of Versailles, and the quiet vaults of modern fortunes. It has been both a curse and a blessing, the fuel of wars and the gift of love, whispering of beauty’s fragility and the human desire for something that lasts beyond the grave. In its shine, we see ourselves fragile yet forever chasing light.
The Digital Dawn of Bitcoin
Centuries later, under the glow of computer screens, a visionary named Satoshi dreamed of a new gold born not from the earth but from the ether of ideas. Bitcoin appeared in 2009 amid a world weary of banks and broken trust.
Like gold’s ancient gleam, Bitcoin was mined not with picks but with puzzles solved by machines. It promised freedom, a currency without kings, flowing from person to person, unbound by borders or empires.
Translation moment: Bitcoin works like digital gold. Instead of digging the ground, miners use computers to solve problems and unlock new coins. No one controls it, and that is what makes it powerful.
Through doubt and frenzy, it rose as a beacon for those seeking sovereignty in a digital world. Its volatility became its soul, a reminder that true value is built on belief. Bitcoin speaks to ingenuity and rebellion, a star of code guiding us toward a future where wealth is weightless yet profoundly honest.
Gold’s Cycles: Echoes of War and Crisis
In the early 20th century, gold was held under fixed prices until the Great Depression of 1929 shattered these illusions. The 1934 dollar devaluation lifted it from 20.67 to 35, restoring faith amid despair. When World War II erupted in 1939, gold’s role as a refuge was muted by controls, yet it quietly held its place as the world’s silent guardian.
The 1970s awakened its wild spirit. The Nixon Shock of 1971 freed gold from 35, sparking a bull run during the 1973 Oil Crisis. The 1979 Iranian Revolution led to a 1980 peak of 850, a leap of more than 2,000 percent, as investors sought safety from the chaos.
Translation moment: When fear rises, people rush to gold. Every major war or economic crisis has sent gold upward because it feels safe when paper money loses trust.
The 1987 stock crash caused brief dips, but the 1990 Gulf War reignited its glow. Around 2000, after the Dot-com Bust, gold found new life, climbing from $ 270 to over $1,900 during the 2008 Financial Crisis. It dipped to 1050 in 2015, then surged again past 2000 during the 2020 pandemic.
The 2022 Ukraine War added another chapter with prices climbing above 2700 by 2025. Across a century of crises, gold has risen whenever fear tested humanity’s resolve, teaching patience and fortitude through its quiet endurance.
Bitcoin’s Cycles: Echoes of Innovation and Crisis
Born from the ashes of the 2008 Financial Crisis, Bitcoin began its story at mere cents. It traded below $1 until 2011, when it reached $30 before crashing by 90 percent following the MTGOX collapse.
In 2013, it soared to 1242 only to fall again to 200 in 2015 as regulations tightened. The 2017 bull run lifted it to nearly 20000 before another long winter brought it to 3200 in 2018. Each fall taught resilience, each rise renewed belief.
During the 2020 pandemic, it fell below 5000 before rallying to 69000 in 2021. The Ukraine War and the FTX collapse of 2022 brought it down to 16000, but also proved its role in humanitarian aid. By 2024, the halving and ETF approvals helped it break 100000, marking Bitcoin’s rise as digital gold.
Translation moment: Bitcoin’s rhythm follows four-year halving cycles when mining rewards are cut in half. This keeps supply limited, which often triggers new bull runs as demand returns.
Every four years, it's halving cycles 2012, 2016, 2020, 2024, fueling new waves of adoption and correction. Bitcoin grows strongest in times of uncertainty, echoing humanity’s drive to evolve beyond limits.
The Harmony of Gold and Bitcoin Modern Parallels
In today’s markets, gold’s ancient glow meets Bitcoin’s electric pulse. As of October 17, 2025, their correlation stands near 0.85, close to its historic high of 0.9. Both rise as guardians against inflation and the erosion of trust in the dollar.
Gold trades near 4310 per ounce a record high while Bitcoin hovers around 104700 showing brief fractures in their unity. Gold offers the comfort of touch while Bitcoin provides the thrill of code. Together, they reflect fear and hope, the twin emotions that drive every market.
Translation moment: A correlation of 0.85 means they often move in the same direction. When fear or inflation rises, both gold and Bitcoin tend to rise in tandem.
Analysts warn of bubbles in stocks, gold, and crypto, yet optimism remains for Bitcoin’s growth through 2026, while gold holds its defensive strength.
Gold carries risks of storage cost and theft, but steadiness in chaos. Bitcoin carries volatility and regulatory challenges, but it also offers unmatched innovation and reach. One is the anchor, the other the dream, and both reward those who hold conviction through uncertainty.
Epilogue: The Timeless Balance
Gold and Bitcoin form a bridge between the ancient and the future. Gold, the earth’s eternal treasure, stands as a symbol of stability and truth. Bitcoin, the digital heir, shines with the spark of innovation and freedom.
Experts view gold as the ultimate inflation hedge, forged in fire and tested over centuries. They see Bitcoin as its digital counterpart, scarce by code and limitless in reach.
Gold’s weight grounds us in reality while Bitcoin’s light expands our imagination. In 2025, as gold surpasses $4,346 and Bitcoin hovers near $105,000, the wise investor sees not rivals but reflections.
Translation moment: Gold reminds us to protect what we have. Bitcoin reminds us to dream of what could be. Together, they balance caution and courage, the two forces every generation must master.
One whispers of legacy, the other of evolution, yet together they tell humanity’s oldest story, our unending quest to preserve value against time and to chase the light that never fades.
🙏 I ask (Allah) for guidance and success. 🤲
Wyckoff Accumulation / Distribution Detector (v3)🌱 Spring (Bullish Wyckoff Signature)
🧠 Definition
A Spring happens when price dips below a well-defined support level, usually near the end of an accumulation phase, then quickly reverses back above support.
This is not ordinary volatility — it's usually intentional by large operators (“Composite Man”) to:
Trigger stop-losses of weak holders
Create the illusion of a breakdown to scare late sellers in
Absorb all remaining supply at low prices
Launch the next markup leg once weak hands are flushed out
🧭 Typical Spring Characteristics
Feature Behavior
Location Near the bottom of a trading range after a decline
Price Action Temporary breakdown below support, then sharp reversal above
Volume Usually low to average on the break, indicating lack of real selling pressure. Sometimes a volume surge on the reversal as strong hands step in
Candle Often shows a long lower wick, closes back inside the range
Intent Shakeout of weak holders, allow institutions to accumulate more quietly
📈 Why It's Bullish
Springs typically mark the final test of supply. If price can dip below support and immediately recover, it means:
Selling pressure is exhausted (no follow-through)
Strong hands are absorbing remaining shares
A bullish breakout is often imminent
🪤 Upthrust (Bearish Wyckoff Signature)
🧠 Definition
An Upthrust is the mirror image of a Spring. It happens when price pokes above a resistance level, usually near the end of a distribution phase, but then fails to hold above it and falls back inside the range.
This is typically smart money distributing to eager buyers:
Late breakout traders pile in
Institutions sell into that strength
Price collapses back into the range, trapping breakout buyers
🧭 Typical Upthrust Characteristics
Feature Behavior
Location Near the top of a trading range after a rally
Price Action Temporary breakout above resistance, then quick reversal down
Volume Frequently low on the breakout, suggesting a lack of real buying interest — or sometimes high but with no progress, showing hidden selling
Candle Often shows a long upper wick, closes back inside the range
Intent Trap breakout buyers, provide liquidity for institutional sellers to unload near highs
📉 Why It's Bearish
Upthrusts show demand failure and supply swamping:
Buyers cannot sustain the breakout.
The sharp reversal signals large players are exiting.
Typically precedes markdown phases or sharp declines.
📝 Trading Implications
Spring → Often followed by a sign of strength rally → good long entry if confirmed with volume expansion and follow-through.
Upthrust → Often followed by a sign of weakness → short setups, especially if the next rally fails at lower highs.
The script looks for:
🌱 Spring:
Price makes a low below recent pivot support,
Closes back above,
Does so on low volume → likely a shakeout.
🪤 Upthrust:
Price makes a high above recent pivot resistance,
Closes back below,
On low volume → likely a bull trap.

TrendShield Pro | DinkanWorldSmart Trailing Trend System Powered by EMA + ATR
TrendShield Pro is a powerful trend detection and trailing stop indicator designed for traders who rely on pure price movement and volatility tracking.
It dynamically adapts to market conditions using a combination of EMA (Exponential Moving Average) and ATR (Average True Range) to identify the active trend and place a visual trailing stop line.
🔍 How It Works
TrendShield Pro combines trend direction and volatility to create a self-adjusting trailing system:
EMA (Exponential Moving Average):
Smooths price fluctuations and identifies the overall market bias.
ATR (Average True Range):
Measures volatility to determine how far the trailing stop should follow the trend.
Dynamic Bands:
Two invisible thresholds are formed — up and down — around the EMA using the ATR and your chosen Factor value.
Trailing Logic:
When the EMA is rising, the Trailing Stop (TUp) locks in higher lows.
When the EMA is falling, the Trailing Stop (TDown) locks in lower highs.
The indicator switches trend automatically based on price crossing these trailing levels.
🧭 Visuals & Features
Green Trailing Line (Demand Trend): Indicates an active bullish trend.
Red Trailing Line (Supply Trend): Indicates an active bearish trend.
Arrow Signals:
🟢 Up Arrow → Bullish Trend Reversal
🔴 Down Arrow → Bearish Trend Reversal
Diamond Markers: Show points where the trailing line shifts, marking dynamic volatility changes.
⚙️ Inputs
Input Description
EMA Period Length of the Exponential Moving Average
ATR Period Period used for Average True Range calculation
Factor Multiplier for ATR-based volatility expansion

Squeeze Weekday Frequency [CHE] Squeeze Weekday Frequency — Tracks historical frequency of low-volatility squeezes by weekday to inform timing of low-risk setups.
Summary
This indicator monitors periods of unusually low volatility, defined as when the average true range falls below a percentile threshold, and tallies their occurrences across each weekday. By aggregating these counts over the chart's history, it reveals patterns in squeeze frequency, helping traders avoid or target specific days for reduced noise. The approach uses persistent counters to ensure accurate daily tallies without duplicates, providing a robust view of weekday biases in volatility regimes.
Motivation: Why this design?
Traders often face inconsistent signal quality due to varying volatility patterns tied to the trading calendar, such as quieter mid-week sessions or busier Mondays. This indicator addresses that by binning low-volatility events into weekday buckets, allowing users to spot recurring low-activity days where trends may develop with less whipsaw. It focuses on historical aggregation rather than real-time alerts, emphasizing pattern recognition over prediction.
What’s different vs. standard approaches?
- Reference baseline: Traditional volatility trackers like simple moving averages of range or standalone Bollinger Band squeezes, which ignore temporal distribution.
- Architecture differences:
- Employs array-based persistent counters for each weekday to accumulate events without recounting.
- Includes duplicate prevention via day-key tracking to handle sparse data.
- Features on-demand sorting and conditional display modes for focused insights.
- Practical effect: Charts show a persistent table of ranked weekdays instead of transient plots, making it easier to glance at biases like higher squeezes on Fridays, which reduces the need for manual logging and highlights calendar-driven edges.
How it works (technical)
The indicator first computes the average true range over a specified lookback period to gauge recent volatility. It then ranks this value against its own history within a sliding window to identify squeezes when the rank drops below the threshold. Each bar's timestamp is resolved to a weekday using the selected timezone, and a unique day identifier is generated from the date components.
On detecting a squeeze and valid price data, it checks against a stored last-marked day for that weekday to avoid multiple counts per day. If it's a new occurrence, the corresponding weekday counter in an array increments. Total days and data-valid days are tracked separately for context.
At the chart's last bar, it sums all counters to compute shares, sorts weekdays by their squeeze proportions, and populates a table with the selected subset. The table alternates row colors and highlights the peak weekday. An info label above the final bar summarizes totals and the top day. Background shading applies a faint red to squeeze bars for visual confirmation. State persists via variable arrays initialized once, ensuring counts build incrementally without resets.
Parameter Guide
ATR Length — Sets the lookback for measuring average true range, influencing squeeze sensitivity to short-term swings. Default: 14. Trade-offs/Tips: Shorter values increase responsiveness but raise false positives in chop; longer smooths for stability, potentially missing early squeezes.
Percentile Window (bars) — Defines the history length for ranking the current ATR, balancing recent relevance with sample size. Default: 252. Trade-offs/Tips: Narrower windows adapt faster to regime shifts but amplify noise; wider ones stabilize ranks yet lag in fast markets—aim for 100-500 bars on daily charts.
Squeeze threshold (PR < x) — Determines the cutoff for low-volatility classification; lower values flag rarer, tighter squeezes. Default: 10.0. Trade-offs/Tips: Tighter thresholds (under 5) yield fewer but higher-quality signals, reducing clutter; looser (over 20) captures more events at the cost of relevance.
Timezone — Selects the reference for weekday assignment; exchange default aligns with asset's session. Default: Exchange. Trade-offs/Tips: Use custom for cross-market analysis, but verify alignment to avoid offset errors in global pairs.
Show — Toggles the results table visibility for quick on/off of the display. Default: true. Trade-offs/Tips: Disable in multi-indicator setups to save screen space; re-enable for periodic reviews.
Pos — Positions the table on the chart pane for optimal viewing. Default: Top Right. Trade-offs/Tips: Bottom options suit long-term charts; test placements to avoid overlapping price action.
Font — Adjusts text size in the table for readability at different zooms. Default: normal. Trade-offs/Tips: Smaller fonts fit more data but strain eyes on small screens; larger for presentations.
Dark — Applies a dark color scheme to the table for contrast against chart backgrounds. Default: true. Trade-offs/Tips: Toggle false for light themes; ensures legibility without manual recoloring.
Display — Filters table rows to show all, top three, or bottom three weekdays by squeeze share. Default: All. Trade-offs/Tips: Use "Top 3" for focus on high-frequency days in active trading; "All" for full audits.
Reading & Interpretation
Red-tinted backgrounds mark individual squeeze bars, indicating current low-volatility conditions. The table's summary row shows the highest squeeze count, its percentage of total events, and the associated weekday in teal. Detail rows list selected weekdays with their absolute counts, proportional shares, and a left arrow for the peak day—higher percentages signal days where squeezes cluster, suggesting potential for calmer trend development. The info label reports overall days observed, valid data days, and reiterates the top weekday with its count. Drifting counts toward zero on a weekday imply rarity, while elevated ones point to habitual low-activity sessions.
Practical Workflows & Combinations
- Trend following: Scan for squeezes on high-frequency weekdays as entry filters, confirming with higher highs or lower lows in the structure; pair with momentum oscillators to time breaks.
- Exits/Stops: On low-squeeze days, widen stops for breathing room, tightening them during peak squeeze periods to guard against false breaks—use the table's percentages as a regime proxy.
- Multi-asset/Multi-TF: Defaults work across forex and indices on hourly or daily frames; for stocks, adjust percentile window to 100 for shorter histories. Scale thresholds up by 5-10 points for high-vol assets like crypto to maintain signal sparsity.
Behavior, Constraints & Performance
- Repaint/confirmation: Counts update only on confirmed bars via day-key changes, with no future references—live bars may shade red tentatively but tallies finalize at session close.
- security()/HTF: Not used, so no higher-timeframe repaint risks; all computations stay in the chart's resolution.
- Resources: Relies on a fixed-size array of seven elements and small loops for sorting and table fills, capped at 5000 bars back—efficient for most charts but may slow on very long intraday histories.
- Known limits: Ignores weekends and holidays implicitly via data presence; early chart bars lack full percentile context, leading to initial undercounting; assumes continuous sessions, so gaps in data (e.g., news halts) skew totals.
Sensible Defaults & Quick Tuning
Start with the built-in values for broad-market daily charts: ATR at 14, window at 252, threshold at 10. For noisier environments, lower the threshold to 5 and shorten the window to 100 to prioritize rare squeezes. If too few events appear, raise the threshold to 15 and extend ATR to 20 for broader capture. To combat overcounting in sparse data, widen the window to 500 while keeping others stock—monitor the info label's data-days count before trusting patterns.
What this indicator is—and isn’t
This serves as a statistical overlay for spotting calendar-based volatility biases, aiding in session selection and filter design. It is not a standalone signal generator, predictive model, or risk manager—integrate it with price action, volume, and broader strategy rules for decisions.
Disclaimer
The content provided, including all code and materials, is strictly for educational and informational purposes only. It is not intended as, and should not be interpreted as, financial advice, a recommendation to buy or sell any financial instrument, or an offer of any financial product or service. All strategies, tools, and examples discussed are provided for illustrative purposes to demonstrate coding techniques and the functionality of Pine Script within a trading context.
Any results from strategies or tools provided are hypothetical, and past performance is not indicative of future results. Trading and investing involve high risk, including the potential loss of principal, and may not be suitable for all individuals. Before making any trading decisions, please consult with a qualified financial professional to understand the risks involved.
By using this script, you acknowledge and agree that any trading decisions are made solely at your discretion and risk.
Do not use this indicator on Heikin-Ashi, Renko, Kagi, Point-and-Figure, or Range charts, as these chart types can produce unrealistic results for signal markers and alerts.
Best regards and happy trading
Chervolino

Orderblocks & BreakersThis indicator identifies potential orderblocks and breakers based on recent swing highs and lows. It is built to offer a structured, customizable, and noise-controlled view of how price interacts with supply and demand levels.
The script applies pivot-based swing detection to identify swing highs and lows.
Bullish Orderblocks: The script Identifies and stores the last down candle before a swing high is breached and confirms and plots the orderblock with a market structure break (close above the swing high).
Bearish Orderblocks: The script Identifies and stores the last up candle before a swing low is breached and confirms and plots the orderblock with a market structure break (close below the swing low).
When price later closes through an existing orderblock, it is reclassified as a Breaker and recolored accordingly. (all colors can be changed in the settings)
What Makes It Different
Unlike most orderblock tools that simply mark every swing-based block, this version introduces:
1. Chop Control – automatically hides breakers that price repeatedly closes through (2 closes after the orderblock becomes a breaker), keeping only relevant zones visible.
2. Recent Block Filtering – limits how many of the recent orderblocks or breakers are displayed, preventing chart clutter.
3. Dynamic Updating – orderblocks automatically convert to breakers when price closes beyond them, with clear color changes.
These features make it easier to study cleaner price structure without manually managing old or invalid zones. The optional Chop Control filter can reduce overlapping or repeatedly invalidated zones to keep the chart clearer.
Customizable Parameters
- Swing detection length (shorter means more aggressive pivot detection, longer means less aggressive so less highs/lows detected)
- Number of recent blocks to display
- Visibility toggles for orderblocks or breakers
- Color and transparency controls for each type
Alerts
Alerts can be set to trigger when price tests any defined zone.
Purpose
This indicator is designed as a price structure visualization and study tool.
It may assist in understanding how price interacts with previously active regions, but it does not produce signals or trade recommendations.

Illuminati Zone🟣 Illuminati Zone — Hidden Power of the 11 PM NZ Candle
The Illuminati Zone reveals the hidden footprints of liquidity and market imbalance formed by the 11 PM New Zealand 15-minute candle — a time when global liquidity transitions between major sessions.
This candle often defines key intraday supply and demand boundaries, serving as a magnet for price and a pivot point for high-probability reversals or breakouts.
🧠 How it works
Automatically detects and marks the 11 PM NZ 15-minute candle each day.
Draws a translucent zone box between its high and low.
Extends two reference lines at +1 × range and –1 × range above and below the zone — ideal for spotting overextensions or liquidity sweeps.
Supports custom lookback, colors, and visual options.
💡 How to use it
Watch how price interacts with the zone — rejection often signals smart-money activity.
Use +1 and –1 levels as overextended zones for potential reversals or breakout retests.
Combine with your own confluence tools or volume analysis for precision entries.
⚙️ Customization Options
Target hour (NZ time)
Days back to display
Zone and line colors
Transparency and visual preferences
🔮 Pro Tip: Pair it with a volume or imbalance indicator for surgical-level precision in identifying where smart money positions are built or released.

3-1-2 Strat Combo by NaturalBelleThe 3-1-2 Strat Combo by NaturalBelle automatically detects and highlights one of The Strat’s most powerful reversal patterns — the 3-1-2 setup.
When a 3 (outside bar) is followed by a 1 (inside bar) and then a 2 that breaks direction, this script plots yellow triangles and draws yellow box zones across the sequence, giving traders a clean visual cue for potential reversals or continuations.
Features:
Highlights both bullish (3-1-2-Up) and bearish (3-1-2-Down) sequences
Draws yellow boxes covering the 3-1-2 structure for easy zone recognition
Optional text labels for clarity
Adjustable box extension and transparency
Built-in alert conditions for both up and down setups
This clean, no-clutter version focuses purely on price action — no indicators, no noise. Just the pattern.
🟡 Best used on: Any timeframe
🟡 Strategy: Combine with market structure, EMAs, or supply & demand zones for confirmation
Created by NaturalBelle — keeping Strat analysis simple, visual, and precise.

Wyckoff Effort vs. Result📌 Wyckoff Effort vs. Result (E/R) – Visualizing Supply & Demand Imbalance with Volume Confirmation
📖 Overview
The Wyckoff Effort vs. Result (E/R) indicator is designed to help traders interpret market behavior through the lens of volume vs. price movement — a foundational concept in Richard Wyckoff’s methodology.
This tool aims to highlight moments where the “effort” (volume) is not in proportion to the “result” (price movement) — giving insight into potential accumulation or distribution events.
By detecting high-volume candles and classifying them based on their price direction, the indicator visualizes zones where smart money might be active .
⚙️ How It Works
1. Effort Accumulation (High Volume Down Bar):
• When a candle closes lower than it opens (down bar) and has above-average volume , it’s marked as potential absorption of selling pressure (effort to push down met by buying).
• These candles are colored red and the open level is plotted, acting as a potential support or re-test zone.
2. Effort Distribution (High Volume Up Bar):
• When a candle closes higher than it opens (up bar) and has above-average volume , it’s marked as potential distribution (effort to push up absorbed by sellers).
• These candles are colored green and the open level is plotted , acting as a potential resistance or rejection zone.
3. Average Volume Calculation:
• The script calculates a simple moving average (SMA) of volume over a user-defined lookback period.
• If current volume exceeds the average multiplied by a set threshold, it’s treated as a high-effort bar .
🧪 Inputs
Input Description
Average Volume Lookback - Number of bars used to calculate the volume average
High Volume Multiplier. - Multiplier to define what qualifies as “high volume”
🖥️ Visual Output
• 🔴 Red candles = High volume on a down bar → possible accumulation
• 🟢 Green candles = High volume on an up bar → possible distribution
• 📉 Horizontal lines at bar open price mark the potential zones where effort occurred
These zones can serve as:
• Areas of support/resistance
• Trap zones where smart money absorbs liquidity
• Entry/exit filters when combined with price action
🧠 How to Use
• Use in combination with price structure, support/resistance, and volume profile tools
• Watch how price reacts when it revisits the plotted lines
• Look for effort bars that fail to lead to continuation, signaling potential reversal
• Can be used in scalping, swing trading, or Wyckoff-style phase analysis
🔒 Technical Notes
• ✅ Does not repaint
• ✅ Built with Pine Script v6
• ✅ Lightweight and customizable
• ❌ Does not generate buy/sell signals — it provides context, not predictions

Supply/Demand Zones & EMA CrossSupport and Resistance Zone based on past ten days for daily, weekly, with this ema 8,20,50,200 and vwap also inclued

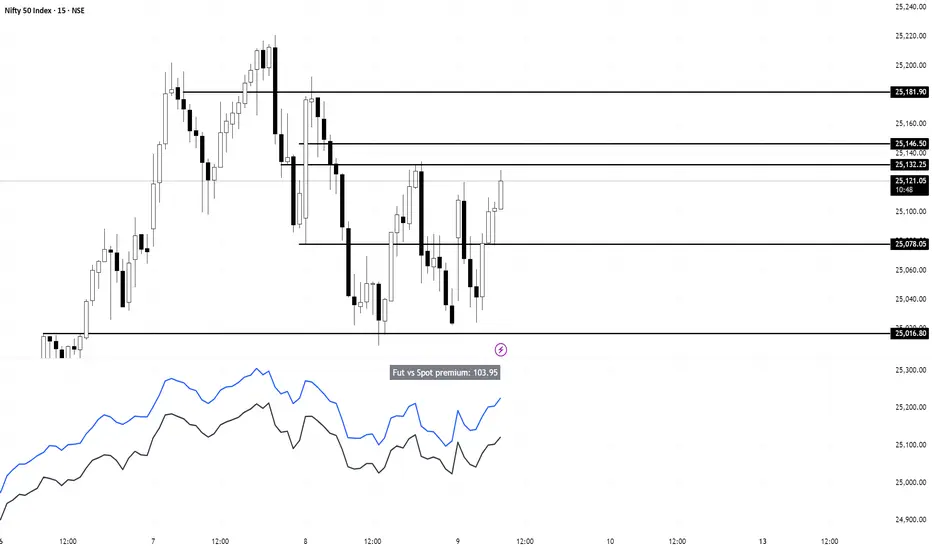
Nifty vs Nifty Fut Premium indicator This indicator compares Nifty Spot and Nifty Futures prices in real-time, displaying the premium (or discount) between them at the top of the pane.
Trading applications:
Arbitrage opportunities: When the premium becomes unusually high or low compared to fair value (based on cost of carry), traders can exploit the mispricing through cash-futures arbitrage
Market sentiment: A rising premium often indicates bullish sentiment as traders are willing to pay more for futures, while a declining or negative premium suggests bearish sentiment
Rollover strategy: Near expiry, monitoring the premium helps traders decide optimal timing for rolling positions from current month to next month contracts
Risk assessment: Sudden spikes in premium can signal increased demand for leveraged long positions, potentially indicating overbought conditions or strong momentum