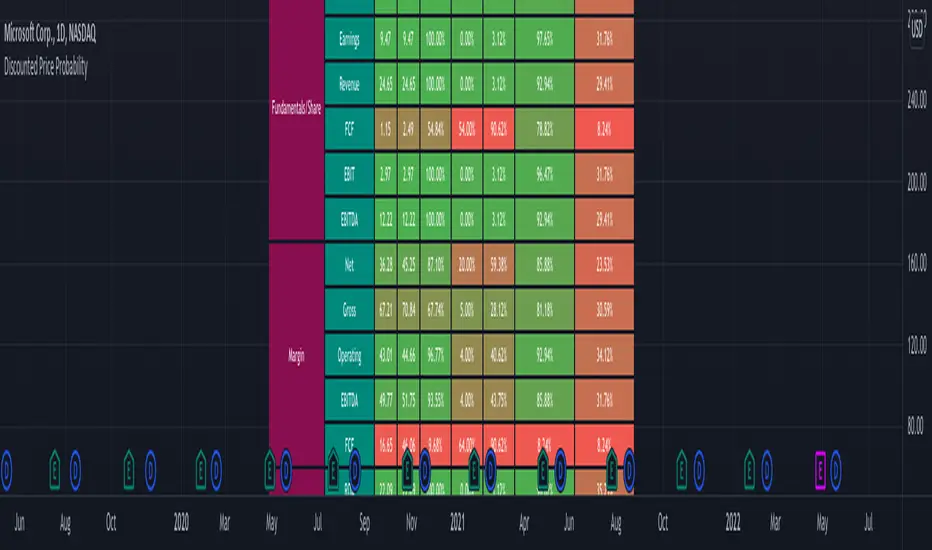
Discounted Price ProbabilityHere is an attempt to understand the probability of discounted price of a stock by comparing it to historical price and fundamental correlation. Have made use of some of the new features of pine in developing this script (Such as matrix and new features of tables such as cell merge and tooltip).
Script makes use of the library written on matrix matrix
🎲 Process
Probability is measured in two angles
🎯 Absolute : Measure the percentile of price and fundamentals with respect to all time high. The difference between the two is measure of probability of stock being undervalued.
🎯 Drawdown : Measure the percentile of distance from all time high for both price and fundamentals. The difference between the two is used for depicting the probability of stock being undervalued.
🎲 Components
In short, the definitions of stats presented are as below
🎲 Settings
Settings are pretty straightforward
🎲 How to look at these stats
To Start with
Are most of the fundamental values coloured in green? If yes, it means that they are near all time high in terms of percentile.
If drawdowns of fundamental values coloured in green? If yes, it means, the stock has not suffered much drawdowns of fundamentals from its peak.
Are the percentile values of drawdowns in green? If yes, it means, that drop in fundamentals are not high compared to its previous values.
If all the above are greener, then it means, company is in strong growth space.
Example: TSLA
Even though the financial ratios of TSLA are not in par with most of the fundamentally strong stocks, it is indeed growing steadily and at its near all time high.
Lets take another example of NKLA
Here the base columns regarding fundamentals are mostly red. This means, company has suffered setback with respect to their financials and the company is not where it used to be. But, if you see the differential probabilities, it says 92% of being undervalued?
Well, this is due to the fact that NKLA's fundamentals suffered most of the time and they are always below par when compared to price. Hence, such kind of cases may interpret the stocks as undervalued. Hence, even if the probability of being undervalued is more, it does not guarantee the quality of the stock. We need to be mindful overall financials of the company and how they fare with general standards.
Moving forward
To understand value of trending stock, use Absolute Probability (marked with P). Ex. GOOG, MSFT, BRK.B etc.
To understand value of stock which has been recently suffered huge price drop, look at drawdown based probability (marked with D). Ex. BABA, FB, PYPL, SQ, ROKU etc.
Some examples of high flyers:
Some for deep pullbacks:
And the meme stocks:
"deep股票代码" için komut dosyalarını ara
Weighted Standard Deviation BandsLinearly weighted standard deviations over linearly weighted mean.
The rationale of the study can be deduced from my latest publications where I go deeper into explaining the benefits of linear weighting, but in short, I can remind that by using linear weighting we are able to increase the information gain by communicating the sequential nature of time series to the calculations via linear weighting.
Note, that multiplier parameters can take both negative and positive values resulting in ability to have, for example, 1st and 6th weighted standard deviations higher than the weighted mean.
Despite the modification of the classic standard deviation formula, I assume that mathematical qualities of standard deviation will hold due to the fact we can alternately weight the window itself, and then apply the classic standard deviation over the weighted window. In both cases, the results will be the same.
Aight that was too formal, but your short strangles should be happy
Here is it, for you

Measure Volume, Momentum, Trend, VolatilityThis script displays the following indicators in one pane to quickly determine several important factors regarding price action. It allows the user to quickly see all of most important factors surrounding price action in one pane with one quick glance. This should be incredibly helpful and allow things like double divergence and trend confirmation to be spotted much more quickly. I personally use the data in this indicator to replace four separate indicators and it has brought my win rate and profit factor significantly higher. I hadn't seen any place where all of the best J. Welles Wilder indicators such as RSI, Parabolic SAR, and DMI/ADX were brought into one easy to use interface. This is my attempt at fixing that gap. For a much deeper understanding of how to use these indicators, I recommend reading New Concepts in Technical Trading Systems written by J. Welles Wilder.
Momentum via RSI (Relative Strength Index)
Volume via MFI (Money Flow Index)
Volatility via DMI/ADX (Direction Movement Index/Average Directional Index)
Trend via Parabolic SAR (Parabolic Stop and Reverse)
It is worth noting that DMI/ADX and Parabolic SAR can both help determine trend strength and volatility.
The Volatility mechanism is measured by DMI and ADX and displayed at the top of the pane using circles. The top, tiny circles reflect if show if positive DI or negative DI has a higher value. The small circles directly underneath indicate whether or not the ADX is above 20 (configurable, some may choose to increase this to 25 or even 30).
The Momentum mechanism is shown as standard RSI with the default being a white line and default period of 14, which is all configurable.
The Volume mechanism is shown as standard MFI with the default being a fuchsia line and default period of 14, which is also configurable.
The momentum and volume oscillators should be used in conjunction to help spot whether the trend is strong or weak using divergences and the middle, overbought, and oversold levels. These levels are also configurable.
The Trend mechanism is measured by Parabolic SAR and displayed at the bottom of the pane using diamonds. The default is red diamonds when in a bear trend, green when in an uptrend which is configurable. When price is above the Parabolic SAR, it is considered to be an uptrend. When price is below the Parabolic SAR, it is considered to be a downtrend. The way price is measured is also configurable (i.e. open, close, ohlc4, hlc3, etc.). When price crossed above or below the Parabolic SAR, the diamonds will change colors.
All the indicators displayed should be used in a well rounded strategy. For instance, I only trade when ADX is above 20 and rarely trade against the trend shown via PSAR. When trend shifts and divergences helped indicate a trend shift would occur using the RSI and MFI, it can be a great spot to take an entry. RSI/MFI can also confirm the trend is strong when they are not showing divergences and inline with price action. All of this data should be used in conjunction with good fundamental data and technical levels. Divergences with RSI and MFI on double tops or bottoms can also be incredibly powerful. There is no right or wrong way to use all the data displayed in this indicator, however using all four pillars of trading (Momentum, Volume, Trend, Volatility) will help ensure only the best trades are taken.

T3 Super GuppyA Tillson T3 moving average implemented variation of the CM Super Guppy indicator by @FritzMurphy
The T3 moving average was developed by Tom Tilson which combines multiple EMAs into a single moving average. it is smoother and more responsive compared to traditional moving averages. The disadvantage is that it can overshoot price.
█ Description
T3 Super Guppy consists of 20 T3 moving averages:
• 7 fast T3 MAs
• 13 slow T3 MAs
Visuals:
• Compact view available for chart minimalists
• In compact view only 10 of the fastest T3 moving averages will be displayed
• Compact view will not affect how the colour scales with trend movement
• Ribbon transparency will automatically scale based on the display mode chosen
Colour Gradient
• The more T3 MAs that cross above or below their slower counterparts will result in how deep the chosen upTrend(Blue) or downTrend(Red) colour is displayed
• Helps to spot weakening trends or reversal signals when indicator colour starts converging into the opposite colour
• Single colour mode is available if you find the colour gradient distracting
█ Credits
@ChrisMoody original guppy idea:
@FritzMurphy super guppy format:
█ Examples
compact view:
full view:

+ Awesome OscillatorHi again. I have another indicator that I think is pretty neat.
I had the idea of creating an Awesome Oscillator for my Ultimate MA, just to see what kind of signals it might produce. If you're not familiar with my UMA you should go take a look at it, but essentially it is just an average of eight different length MAs, and if you're not familiar with the Awesome Oscillator, it is simply a comparison of the gap between two different moving averages (traditionally a 5 and 34 SMA) plotted as a histogram below the price chart. The two UMAs I was comparing in this version of the AO were the Hull and Simple. It looked okay, but I thought due to the nature of the movements of these MAs, that it was necessary to add something to this indicator in order to validate its creation and make it truly useful
I came to the idea of simply comparing the closing price of the asset on the chart to both the Awesome Oscillator moving averages. What this effectively does is gives you a representation of the moving averages on the chart (assuming you are using those same MAs) as an oscillator below the chart, enabling you to remove the moving averages from your price chart (obviously if you so choose). For me, I like this because fewer things on the chart makes it easier for me to see the price action and structure of the market clearly, or add something like a tWAP or two.
So, like, "how exactly would I use this indicator?"" you're probably asking.
First off: the Awesome Oscillator. By default it is a faintly shaded area, and is the least obvious part of the indicator.
Second: the plotted line. This is what I call the baseline (if you're familiar with NNFX, then you know what this is). It's basically your bias moving average (this means it defines, based on its lookback or length, whether momentum is bullish, bearish or ranging). In the case of the oscillator though, the ZERO line represents the baseline, and the oscillating line represents price in relation to it. If the line is above the zero line then price is above the moving average, and vice versa if it's below. The farther from the center line the baseline price is the greater the volatility,
Third: the histogram. This is the faster moving average, and same rules apply to it as your baseline. You can think of your fast moving average as a trade entry trigger, or an exit. It shows more immediate momentum shifts.
What's interesting about the relationships of all three of these things is that you don't actually NEED all three displayed. Because the Awesome Oscillator is a relation of your two moving averages, and the baseline and histogram are representational of the price relative to those two moving averages, you will notice that when the histogram (fast MA) flips up or down is the same exact time that the baseline price dips into the AO. The AO is effectively a moving average on that. So you can run this with just the AO and Baseline, or just the Baseline and fast MA histogram. To get started, I might recommend keeping your moving averages that you use on the chart just so you can see how this indicator works.
Both the fast MA and Baseline will show nice divergences (divergence indicator is added if you want to use it). And I've added Donchian Channels as upper and lower bounds that act neatly as support or resistance (especially effective if you're using my UMA with Bollinger Bands, or Magic Carpet Bands).
I've also done the usual colored candles thing, which gives you another great reason to get the moving averages off your chart. There are of course alerts for conditions that one might need to be alerted to as well.
Below are some images of different ways you might set these up using the default moving average/baseline settings. In all of these I've left the moving averages on the price chart (with the addition of a 233 SMA) so you can see the relationship between the indicators.
Right here is the indicator set up with just the awesome oscillator and baseline price. Gives a cleaner overall look. You can see that every time the baseline crosses the awesome oscillator is when price crosses the 8 SMA. Candle colors are based on if candle closes above baseline or below.
This is the indicator set up without the awesome oscillator. Here you can see candle closes over the 8 SMA (fast moving average) are shown by the histogram. Candle coloring is still the same as the above image.
This image looks identical to the first, except that the candle coloring is different. This time it is based on the 8 SMA (same as the baseline entering the awesome oscillator).
And the final example image. This one depicts the awesome oscillator and the fast moving average histogram. Candle coloring is based on the awesome oscillator. This can be a great way to visualize momentum because the awesome oscillator is depicting the crossing of the moving averages. A lot of people poo-poo moving average crosses, but I'd say they're wrong. Well, they're right and wrong. Depends on the MAs you're using. The power in moving average crosses is in their ability to show bullish or bearish momentum (or ranging behavior if they continually cross over each other). If you're using slow moving averages, then crosses are often very late (hence so many people who don't know saying, "but moving average crosses are too laggy". Here you might try changing these and having the baseline be faster than the UMA, and actually plot on chart the UMA (or some other moving average). These are just some thoughts.
Anyway, I hope this indicator proves useful to you all. I think for anyone looking to look at price action a bit more, but is used to using moving averages, this could be a really useful indicator. Most oscillating indicators (if not all) are built around moving averages, but they're never explained in such a way as I'm explaining how this one works (I don't think). I think knowing this could help many traders come to a deeper understanding of what the indicator they're using is actually doing.

Template Trailing Strategy (Backtester)💭 Overview
+ Title: Template Trailing Strategy (Backtester)
+ Author: Iason Nikolas (jason5480)
+ License: CC BY-NC-SA 4.0
💢 What is the "Template Trailing Strategy (Backtester)" ❓
The "Template Trailing Strategy (Backtester)" (TTS) is a back-tester orchestration framework. It supercharges the implementation-test-evaluation lifecycle of new trading strategies, by making it possible to plug in your own trading idea.
While TTS offers a vast number of configuration settings, it primarily allows the trader to:
Test and evaluate your own trading logic that is described in terms of entry, exit, and cancellation conditions.
Define the entry and exit order types as well as their target prices when the limit, stop, or stop-limit order types are used.
Utilize a variety of options regarding the placement of the stop-loss and take-profit target(s) prices and support for well-known techniques like moving to breakeven and trailing.
Provide well-known quantity calculation methods to properly handle risk management and easily evaluate trading strategies and compare them.
Alert on each trading event or any related change through a robust and fully customizable messaging system.
All of the above makes TTS a practical toolkit: once you learn it, many repetitive tasks that strategy authors usually re-implement are eliminated. Using TradingView’s built-in backtesting engine makes testing and comparing ideas straightforward.
By utilizing the TTS one can easily swap "trading logic" by testing, evaluating, and comparing each trading idea and/or individual component of a strategy.
Finally, TTS, through its per-event alert management (and debugging) system, provides an automated solution that supports live trading with brokers via webhooks.
NOTE: The "Template Trailing Strategy (Backtester)" does not dictate how you can combine different indicator types. Thus, it should not be confused as a "Trading System", because it gives its user full flexibility on that end (for better or worse).
💢 What is a "Signal Indicator" ❓
"Signal Indicator" (SI) is an indicator that can output a "signal" that follows a specific convention so that the "Template Trailing Strategy (Backtester)" can "understand" and execute the orders accordingly. The SI realizes the core trading logic signaling to the TTS when to enter, exit, or cancel an order. A SI instructs the TTS "when" to enter or exit, and the TTS determines "how" to enter and exit the position once the Signal Indicator generates a signal.
A very simple example of a Signal Indicator might be a 200-day Simple Moving Average Signal. When the price of the security closes above the 200-day SMA, a SI would provide TTS with a "long entry signal". Once TTS receives the "long entry signal", the TTS will open a long position and send an alert or automated trade message via webhook to a broker, based on the Entry settings defined in TTS. If the TTS Entry settings specify a "Market" order type, then the open long position will be executed by TTS immediately. But if the TTS Entry settings specify a "Stop" order type with a 1% Stop Distance, then when the price of the security rises by 1% after the "long entry signal" occurs, the TTS will open a long position and the Long Entry alert or webhook to the broker will be sent.
🤔 How to Guide
💢 How to connect a "signal" from a "Signal Indicator" ❓
The "Template Trailing Strategy (Backtester)" was designed to receive external signals from a "Signal Indicator". In this way, a "new trading idea" can be developed, configured, and evaluated separately from the TTS. Similarly, the SI can be held constant, and the trading mechanics can change in the TTS settings and back-tested to answer questions such as, "Am I better with a different stop loss placement method, what if I used a limit order instead of a stop order to enter, what if I used 25% margin instead of trading spot market?"
To make that possible by connecting an external signal indicator to TTS, you should:
Add both your SI (e.g. "Two MA Signal Indicator" , "Click Signal Indicator" , "Signal Adapter" , "Signal Composer" ) and the TTS script to the same chart.
Open the script's Settings / Inputs dialog for the TTS.
In the 🛠️ STRATEGY group set 𝐃𝐞𝐚𝐥 𝐂𝐨𝐧𝐝𝐢𝐨𝐧𝐬 𝐌𝐨𝐝𝐞 to 🔨External (this makes TTS listen to an external signal source).
Still inside 🛠️ STRATEGY locate the 🔌𝐒𝐢𝐠𝐧𝐚𝐥 🛈 input and choose the plotted output of your SI. The option should look like: "<SI short title>:🔌Signal to TTS" .
Verbose troubleshooting & tips
If the SI does not appear in the 🔌Signal 🛈 selector, confirm both scripts are added to the same chart and the SI exposes a plotted series (title often "🔌Signal to TTS").
When using multiple SIs, pick the SI instance that actually outputs the "🔌Signal to TTS" plotted series.
Validate on the chart: when your SI changes state, the plotted "🔌Signal" series in the TTS (visible in the data window) should change accordingly.
The TTS accepts only signals that follow the tts_convention DealConditions structure. Do not attempt to feed arbitrary scalar series without using conv.getDealConditions / conv.DealConditions.
Make sure your SI composes a DealConditions value following the TTS convention (startLong, endLong, startShort, endShort — optional cancel fields). See the template below.
If the plot is present but TTS does not react, ensure the SI plot is non-repainting (or accept realtime/backtest limitations). Test on historical bars first.
Create alerts on the strategy (see the Alerts section). Use the {{strategy.order.alert_message}} placeholder in the Create Alert dialog to forward TTS messages.
💢 How to create a custom trading logic ❓
The "Template Trailing Strategy (Backtester)" provides two ways to plug in your custom trading logic. Both of them have their advantages and disadvantages.
✍️ Develop your own Customized "Signal Indicator" 💥
The first approach is meant to be used for relatively more complex trading logic. The advantages of this approach are the full control and customization you have over the trading logic and the relatively simple configuration setup by having two scripts only. The downsides are that you have to have some experience with pinescript or you are willing to learn and experiment. You should also know the exact formula for every indicator you will use since you have to write it by yourself. Copy-pasting from existing open-source indicators will get you started quite fast though.
The idea here is either to create a new indicator script from scratch or to copy an existing non-signal indicator and make it a "Signal Indicator". To create a new script, press the "Pine Editor" button below the chart to open the "Pine Editor" and then press the "Open" button to open the drop-down menu with the templates. Select the "New Indicator" option. Add it to your chart to copy an existing indicator and press the source code {} button. Its source code will be shown in the "Pine Editor" with a warning on top stating that this is a read-only script. Press the "create a working copy". Now you can give a descriptive title and a short title to your script, and you can work on (or copy-paste) the (other) indicators of your interest. Once you have the information needed to decide, define a DealConditions object and plot it like this:
import jason5480/tts_convention/ as conv
// Calculate the start, end, cancel start, cancel end conditions
dealConditions = conv.DealConditions.new(
startLongDeal = ,
startShortDeal = ,
endLongDeal = ,
endShortDeal = ,
cnlStartLongDeal = ,
cnlStartShortDeal = ,
cnlEndLongDeal = ,
cnlEndShortDeal = )
// Use this signal in scripts like "Template Trailing Strategy (Backtester)" and "Signal Composer" that can utilize its value
// Emit the current signal value according to the TTS framework convention
plot(series = conv.getSignal(dealConditions), title = '🔌Signal to TTS', color = #808000, editable = false, display = display.data_window + display.status_line, precision = 0)
You should import the latest version of the tts_convention library and write your deal conditions appropriately based on your trading logic and put them in the code section shown above by replacing the "…" part after "=". You can omit the conditions that are not relevant to your logic. For example, if you use only market orders for entering and exiting your positions the cnlStartLongDeal, cnlStartShortDeal, cnlEndLongDeal, and cnlEndShortDeal are irrelevant to your case and can be safely omitted from the DealConditions object. After successfully compiling your new custom SI script add it to the same chart with the TTS by pressing the "Add to chart" button. If all goes well, you will be able to connect your "signal" to the TTS as described in the "How to connect a "signal" from a "Signal Indicator"?" guide.
🧩 Adapt and Combine existing non-signal indicators 💥
The second approach is meant to be used for relatively simple trading logic. The advantages of this approach are the lack of pine script and coding experience needed and the fact that it can be used with closed-source indicators as long as the decision-making part is displayed as a line in the chart. The drawback is that you have to have a subscription that supports the "indicator on indicator" feature so you can connect the output of one indicator as an input to another indicator. Please check if your plan supports that feature here
To plug in your own logic that way you have to add your indicator(s) of preference in the chart and then add the "Signal Adapter" script in the same chart as well. This script is a "Signal Indicator" that can be used as a proxy to define your custom logic in the CONDITIONS group of the "Settings/Inputs" tab after defining your inputs from your preferred indicators in the VARIABLES group. Then a "signal" will be produced, if your logic is simple enough it can be directly connected to the TTS that is also added to the same chart for execution. Check the "How to connect a "signal" from a "Signal Indicator"?" in the "🤔 How to Guide" for more information.
If your logic is slightly more complicated, you can add a second "Signal Adapter" in your chart. Then you should add the "Signal Composer" in the same chart, go to the SIGNALS group of the "Settings/Inputs" tab, and connect the "signals" from the "Signal Adapters". "Signal Composer" is also a SI so its composed "signal" can be connected to the TTS the same way it is described in the "How to connect a "signal" from a "Signal Indicator"?" guide.
At this point, due to the composability of the framework, you can add an arbitrary number (bounded by your subscription of course) of "Signal Adapters" and "Signal Composers" before connecting the final "signal" to the TTS.
💢 How to set up ⏰Alerts ❓
The "Template Trailing Strategy (Backtester)" provides a fully customizable per-event alert mechanism. This means that you may have an entirely different message for entering and exiting into a position, hitting a stop-loss or a take-profit target, changing trailing targets, etc. There are no restrictions, and this gives you great flexibility.
First enable the events you want under the "🔔 ALERT MESSAGES" module. Each enabled event exposes a text area where you can craft the message using placeholders that TTS replaces with actual values when the event occurs.
The placeholder categories (exact names used by the script) are:
Chart & instrument:
{{ticker}}
{{base_currency}}
{{quote_currency}}
Entry / exit / stop / TP prices & offsets:
{{entry_price}}
{{exit_price}}
{{stop_loss_price}}
{{take_profit_price_1}} ... {{take_profit_price_5}}
{{entry+_price}}, {{entry-_price}}, {{exit+_price}}, {{exit-_price}} — Optional offset helpers (computed using "Offset Ticks")
Quantities, percents & derived quantities:
{{entry_base_quantity}} — base units at entry (e.g. BTC)
{{entry_quote_quantity}} — quote amount at entry (e.g. USD)
{{risk_perc}} — % of capital risked for that entry (multiplied by 100 when "Percentage Range " is enabled)
{{remaining_quantity_perc}} — % of the initial position remaining at close/SL
{{remaining_base_quantity}} — remaining base units at close/SL
{{take_profit_quantity_perc_1}} ... {{take_profit_quantity_perc_5}} — % sold/bought at each TP
{{take_profit_base_quantity_1}} ... {{take_profit_base_quantity_5}} — base units closed at each TP
❗ Important: the per-event alert text is injected into the Create Alert dialog using TradingView's strategy placeholder:
{{strategy.order.alert_message}}
During the creation of a strategy alert, make sure the placeholder {{strategy.order.alert_message}} exists in the "Message" box. TradingView will substitute the per-event text you configured and enabled in TTS Settings/Inputs before sending it via webhook/notification.
Tip: For webhook/broker execution, set the proper "Condition" in the Create Alert dialog (for changing-entry/exit/SL notifications use "Order fills and alert() function calls" or "alert() function calls only" as appropriate).
💢 How to execute my orders in a broker ❓
To execute your orders in a broker that supports webhook integration, you should enable the appropriate alerts in the "Template Trailing Strategy (Backtester)" first (see the "How to set up Alerts?" guide above). Then you should go to the "Create Alert/Notifications" tab check the "Webhook URL" and paste the URL provided by your broker. You have to read the documentation of your broker for more information on what messages are expected.
Keep in mind that some brokers have deep integration with TradingView so a per-event alert approach might be overkill.
📑 Definitions
This section tries to give some definitions in terms that appear in the "Settings/Inputs" tab of the "Template Trailing Strategy (Backtester)"
💢 What is Trailing ❓
Trailing is a technique where a price target follows another "barrier" price (usually high or low) by trying to keep a maximum distance from the "barrier" when it moves in only one direction (up or down). When the "barrier" moves in the other direction the price target will not change. There are as many types of trailing as price targets, which means that there are entry trailing, exit trailing, stop-loss trailing, and take-profit trailing techniques.
💢 What is a Moonbag ❓
A Moonbag in a trade is the quantity of the position that is reserved and will not be exited even if all take-profit targets defined in the strategy are hit, the quantity will be exited only if the stop-loss is hit or a close signal is received. This makes the stop-loss trailing technique in a trend-following strategy a good candidate to take advantage of a Moonbag.
💢 What is Distance ❓
Distance is the difference between two prices.
💢 What is Bias ❓
Bias is a psychological phenomenon where you make decisions based on market sentiment. For example, when you want to enter a long position you have a long bias, and when you want to exit from the long position you have a short bias. It is the other way around for the short position.
💢 What is the Bias Distance of a price target ❓
The Bias Distance of a price target is the distance that the target will deviate from its initial price. The direction of this deviation depends on the bias of the market. For example, suppose you are in a long position, and you set a take-profit target to the local highest high. In that case, adding a bias distance of five ticks will place your take-profit target 5 ticks below this local highest high because you have a short bias when exiting a long position. When the bias is long the bias distance will be added resulting in a higher target price and when you have a short bias the bias distance will be subtracted.
⚙️ Settings
In the "Settings/Inputs" tab of the "Template Trailing Strategy (Backtester)", you can find all the customizable settings that are provided by the framework. The variety of those settings is vast; hence we will only scratch the surface here. However, for every setting, there is an information icon 🛈 where you can learn more if you mouse over it. The "Settings/Inputs" tab is divided into ten main groups. Each one of them is responsible for one module of the framework. Every setting is part of a group that is named after the module it represents. So, to spot the module of a setting find the title that appears above it comes with an emoji and uppercase letters. Some settings might have the same name but belong to different modules e.g. "Tgt Dist Mtd" (Target Distance Method). Some settings are indented, which means that they are closely related to the non-indented setting above. Usually, indented settings provide further configuration for one or more options of the non-indented setting above. The groups that correspond to each module of the framework are the following:
🗺️ Quick Module Cross-Reference (use emojis to jump to setting groups)
📆 FILTERS — session, date & weekday filters
🛠️ STRATEGY — internal vs external deal-conditions; pick the signal source
🔧 STRATEGY – INTERNAL — built-in Two MA logic for demonstration purposes
🎢 VOLATILITY — ATR / StDev update modes
🔷 ENTRY — entry order types & trailing
🎯 TAKE PROFIT — multi-step TP and trailing rules
🛑 STOP LOSS — stop placement, move-to-breakeven, trailing
🟪 EXIT — exit order types & cancel logic
💰 QUANTITY/RISK MANAGEMENT — position sizing, moonbag, limits
📊 ANALYTICS — stats, streaks, seasonal tables
🔔 ALERT MESSAGES — per-event alert templates & placeholders
😲 Caveats
💢 Does "Template Trailing Strategy (Backtester)" have repainting behavior? ❓
The answer is that the "Template Trailing Strategy (Backtester)" does not repaint as long as the "Signal Indicator" that is connected also does not repaint. If you developed your own SI make sure that you understand and know how to prevent this behavior. The publication by @PineCoders here will give you a good idea on how to avoid most of the repainting cases.
⚠️ There is an exception though, when the "Enable Trail⚠️💹" checkbox is checked, the Take Profit trailing feature is enabled, and a tick-based approach is used, meaning that after a while, when the TradingView discards all the real-time data, assumptions will be made by the backtesting engine that will cause a form of repainting. To avoid making false assumptions please disable this feature in the early stages and evaluate its usefulness in your strategy later on, after first confirming the success of the logic without this feature. In this case, consider turning on the bar magnifier feature. This way you will get more accurate backtest results when the Take Profit trailing feature is enabled.
💢 Can "Template Trailing Strategy (Backtester)" satisfy all my trading strategies ❓
While this framework can satisfy quite a large number of trading strategies there are cases where it cannot do so. For example, if you have a custom logic for your stop-loss or take-profit placement, or if you want to dollar cost average, then it might be better to start a new strategy script from scratch.
⚠️ It is not recommended to copy the official TTS code and start developing unless you are a Pine wizard! Even in that case, there is a stiff learning curve that might not be worth your time. Last, you must consider that I do not offer support for customized versions of the TTS script and if something goes wrong in the process you are all alone.
💝 Support & Feedback
For feedback, bug reports, or feature requests, contact me via TradingView PM or use the script comments.
Note: The author's personal links and contact are available on the TradingView profile.
🤗 Thanks
Special thanks to the welcoming community members, who regularly gave feedback all those years and helped me to shape the framework as it is today! Thanks everyone who contributed by either filing a "defect report" or asking questions that helped me to understand what improvements were necessary to help traders.
Enjoy!
Jason

[CBB] Volatility Squeeze ToyThe main concept and features of this script are adapted from Mark Whistler's book "Volatility Illuminated". I have deviated from the use cases and strategies presented in the book, but the 3 Bollinger Bands use his optimized settings as the default length and standard deviation multiplier. Further insights into Mark's concepts and volatility research were gained by reading and watching some of TV user DadShark's materials (www.tradingview.com).
This script has been through many refinements and feature cycles, and I've added unrelated complimentary features not present in the book. The indicator is better studied than described, and unless you have read the book, any short summary of the material will just make you squint and think about the wrong things.
Here is a limited outline of features and concepts:
1. 3 Bollinger Bands of different length and/or deviation multiplier. Perhaps think of them as representing the various time frames that compression and expansion cycles and events manifest in, and also the expression of range, speed and price distribution within those time frames. You can gain insight into the magnitude of events based on how the three bands interact and stay contained, or not. If volatility is significant enough, all "time frames" represented by the bands will eventually record the event and subsequent price action, but the early signals will come from the spasms of the shortest, most volatile band. Many times the short band will contract again before, or just as it reaches a longer band, but in extreme cases, volatility will explode and all bands at all time frames will erupt in succession. In these cases you will see additional color representing shorter bands (lower time frame volatility in concept) traveling outside of longer bands. It is worth taking a look at the price levels and candles where these volatility bands cross each other.
2. In addition to the mean of the bands, there are a variety of other moving averages available to gauge trend, range, and areas of interest. This is accomplished with variable VWAP, ATR, smoothing, and a special derived loosely from the difference between them.
3. The bands are also used to derive conditions under which volatility is considered compressed, or in "squeeze" . Under these conditions the candles will turn yellow. Depending on your chart settings and indicator settings, these zones can be completely useless or drag on through fairly significant price action. Or, the can give you fantastic levels to watch for breakouts. The point is that volatility is compressed during these conditions, and you should expect the inevitable once this condition ends. Sometimes you can find yourself in a nice fat trend straight away, other times you may blow an account because you gorged your position based on arbitrary bar color. It's not like that. Pay attention to the highest and lowest bars of these squeeze ranges, and carefully observe future price action when it returns to these squeeze ranges. This info is more and more valuable at higher time frames.
The 3 bands, a smoothed long trend VWAP, and the squeeze condition colored bars are all active by default. All features can be shown or hidden on the control panel.
There are some deep market insights to mine if you live with this one for a while. As with any indicator, blunt "buy/sell here" approaches will lead to loss and frustration. however , if you pay attention to squeeze range, band/moving average confluence, high volume and/or large range candles their open/close behavior around these areas and squeeze ranges, you will start to catch the beginning of some powerful momentum moves.
Enjoy!

S&P Sector Advance/Decline Weighted -Tom1traderEnjoy, enhance your trading (I hope), copy or adapt to your needs and keep smiling!
Thanks to @MartinShkreli. The sector variables and the "repaint" option (approx lines 20 through 32 of this script) are used directly from your script "Sectors"
RECOMMENDATION: Update the sector weightings -inputs are provided. They change as often as monthly and the
annual changes are certainly significant. When updating weighting percentages use the decimal value. I.E. 29% is .29
Good on any time frame. Especially SPY, SPX and ES scalpers and 0DTE options traders may like this a lot.
This gives good signals on S & P and related (ES, SPY) and indicates / plots differently than the AD line or ratio.
Each sector's entire % weight is added or subtracted depending of whether that sector advanced or declined.
Example: Information Tech weight at 29% so that % of 500 (145) is added if InfoTech is up a penny and subtracted if it is
down a penny. All sectors processed the same way so that for a given bar/candle the value will be between +500 (all
sectors up) and -500 (all sectors down). This weighted AD line of sectors is scaled to +/- 350 and plotted as a red/green line
along with aqua/fuchsia columns of its 5 period ema. The line is actual sector behavior and the columns seem to make a
good signal with column zero crosses standing out.
The columns aqua / fuchsia are a 5 period ema of the Sector AD line and give pretty good signals at
zero cross for SPX. I colored the AD red green line also to emphasize the times it opposes the ema
for example the histo/colums zero cross signal is NOT true when the AD line is showing all or most sectors
going the other way.
For readability, the AD line itself is scaled to 350. This lets the columns of the ema stand out better. The hlines at
350 and at 175 give an idea for the AD green red line how much of the sector's weight is up or down.
350 is all sectors up (advancing) and -350 is all sectors down (declining). The hlines at +/- 175 seem to outline
a more or less "neutral" zone. For example in an uptrend with most of the AD level positive and the columns positive;
a negative spike that does not pass the -175 line and returns positive does not seem to impact the price as much as
a deeper negative spike.
McDonald's Pattern [LuxAlgo]Tradingview asked, we delivered. This script fits a cubic Bezier curve using tops/bottoms in order to approximate a McDonalds pattern, a popular meme pattern in the crypto trading community.
Traditionally the McDonalds pattern is described by an M pattern with deep retracement (> 50%), forming a McDonalds logo.
Please note that this indicator is a meme & should not be taken seriously. Some aspects of this indicator are not real-time and meant for descriptive analysis alongside other components of this script, in this case, for entertainment purposes. We suggest looking through our other open-source scripts if you’re looking for more serious tools.
🔶 USAGE
The script fits Bezier curves using specific tops/bottoms as control points. When the distance between tops and bottoms values is relatively small, the user can more easily identify the pattern.
A score is shown on the top right of the chart, aiming to return how close the returned pattern is to the original logo.
A regular Mcdonalds pattern would return a red background, while an inverted pattern would return a green one.
🔶 SETTINGS
Length: Sensitivity of tops/bottoms detection. The method does not make use of pivot points, using rolling maximums/minimums instead.
Use First Bar As Vertex: Use the price and bar index of the last bar as vertex.

Silen's Financials Fair ValueIt is finally here! 🔥 My 3rd and most important script in my Financial series! 🚀
Ever imagined to see all fundamentals (or many that is) combined into one indicator that is right on your chart, showing you how your favorite stock is trading compared to its fundamentals?
Well, here is your answer! 📡
____________________________________________________________________________________________
This script shows you my own personal interpretation of fair value, based solely on the financial fundamentals of a company compared to market averages.
I don't believe that certain sectors of the market should be priced higher than others. If you look at historical data you'll see that favored sectors always rotate - placing insanely high P/E multiples on some sectors. Once they are "out" and people rotate away from those sectors you're left with nothing but the naked fundamentals that matter. So, you'll see many companies, that have been doing well on paper, see their share price decline by 70-90% for no other reasons than people favoring other sectors.
That's why it's even more important to focus on fair value that is solely fundamentals-based. Know when your stock gets to expensive. 🤯
____________________________________________________________________________________________
To give you some examples:
- Most Megacaps trade at historically high valuations, several times my fair value. Those include AAPL, MSFT, NVDA, AMZN, TSLA, JPM, TSM, V and so on. And no, in the past they partially traded below (my) fair value.
- Most Cybersecurity / Cloud companies are trading at truly massive multiples of my fair value. (NET, DDOG, etc)
- Many Smallcaps & Midcaps are trading several multiples (OESX, CODX, QFIN) below my fair value. And no, in the past they partially traded above (my) fair value.
Ok, so much about the market. You ultimately decide how much you want to orientate on fair value. 👨🏫
____________________________________________________________________________________________
This fair value indicator (purple line):
Takes the P/E rate of the company and compares it to the market (50% weight)
Takes the P/S rate of the company and compares it to the market (50% weight)
Then adds boni and mali f or debt/equity rates and debt and equity itself
Also looks at past growth and calculates future P/E and P/S rates which adds , in some cases, value to the fair value (green line)
Also compares how historical valuations have behaved compared to fair value and simulates a fair value guideline (dark blue line)
____________________________________________________________________________________________
This script is part 3️⃣ of a series of indicators that work well together.
Script 1️⃣ of the series is:
P/E & P/S Rates
Script 2️⃣ of the series is:
Debt & Equity
If you use all 3 scripts together it will look like this, giving you truly deep and simple information about the fundamentals of a company:
Example 1 - AMD
Example 2 - HZO
Example 3 - APPS
I hope this script makes your investing and stock picks a lot easier! 🔆💹🕗
Disclaimer: Fair value is always subjective. There are many different approaches to fair value. This one is only my personal interpretation.
Disclaimer 2: This script works only for the Day-Timeframe.
Disclaimer 3: This script uses 17,5 P/E and 3,0 P/S as market averages. The actual average keeps changing but, historically speaking, these seemed to be good numbers.
Feel free to share your thoughts and feedback! 🙃

Levels Of Greed
The Levels Of Greed indicator is based on the same idea as the Levels Of Fear one and was suggested by several traders in the comment section. It helps analyze price advances to find the best levels for closing a long position in an asset after a quick surge or longer up-trend. In finance, volatility is a term that describes the degree of variation of an asset price over time. It is usually denoted by the letter σ (sigma) and estimated as the standard deviation of the asset price or price returns. The Levels Of Greed indicator helps measure the current price advance in the standard deviation units. It plots seven levels at distances of 1, 2, 3, 4, 5, 6, and 7 standard deviations (sigmas) above the base price (the recent lowest price or lower bound of the established range). In what follows, we will refer to these levels as levels of greed.
HOW TO USE
When the price in its surge reaches a certain level of greed, it means that it has surged from its recent lowest value by a corresponding number of standard deviations. The indicator helps traders see the maximum levels to which the price may rise and estimate the potential height of the current surge. Five-seven sigma surges are relatively rare events and correspond to significant market exuberance. Careful traders and shorter-term ones would not want to participate in the bandwagon effect and herd behavior that drive market bubbles. They prefer to take their profits when the market is not exceedingly overbought.
SETTINGS
Window : the averaging window or period of the indicator. The algorithm uses this parameter to calculate the base level and standard deviations. Higher values are better for measuring deeper and longer surges.
Levels Stability : the parameter used in the up-move detection. The higher the value is, the more stable and long the greed levels are, but at the same time, the lag increases. The lower it is, the faster the indicator responds to the price changes, but the greed levels are recalculated more frequently and are less stable. This parameter is mostly for fine-tuning. It does not change the overall picture much.
Mode : the parameter that defines the style for the labels. In the Cool Guys Mode, the indicator displays the labels as emojis. In the Serious Guys Mode, labels show the distance from the base level measured in standard deviation units or sigmas.

Moving Average Suite + VWAP + TICKThis indicator combines some of the commonly used moving averages, VWAP, and TICK sentiment, all of which are useful for all types of trading
By default, this indicator includes:
- 21/50/100/200 period smoothed simple moving average
- great for determining trends
- also act as support / resistance line for price
- 9 period exponential moving average
- fast trend / direction indicator
- Volume Weighted Average Price
- no explanation required
- $TICK sentiment as background fill
- overall market sentiment and direction
- +/- 500 levels are colored green/red and are usually indication of institutional order flow --> critical for trading indexes such as SPY or QQQ
- deep green/red background indicates +/-1000 on the $TICK, which are usually associated with overbought or oversold

Levels Of Greed [AstrideUnicorn]The Levels Of Greed indicator is based on the same idea as the Levels Of Fear one and was suggested by several traders in the comment section. It helps analyze price advances to find the best levels for closing a long position in an asset after a quick surge or longer up-trend. In finance, volatility is a term that describes the degree of variation of an asset price over time. It is usually denoted by the letter σ (sigma) and estimated as the standard deviation of the asset price or price returns. The Levels Of Greed indicator helps measure the current price advance in the standard deviation units. It plots seven levels at distances of 1, 2, 3, 4, 5, 6, and 7 standard deviations (sigmas) above the base price (the recent lowest price or lower bound of the established range). In what follows, we will refer to these levels as levels of greed.
HOW TO USE
When the price in its surge reaches a certain level of greed, it means that it has surged from its recent lowest value by a corresponding number of standard deviations. The indicator helps traders see the maximum levels to which the price may rise and estimate the potential height of the current surge. Five-seven sigma surges are relatively rare events and correspond to significant market exuberance. Careful traders and shorter-term ones would not want to participate in the bandwagon effect and herd behavior that drive market bubbles. They prefer to take their profits when the market is not exceedingly overbought.
SETTINGS
Window : the averaging window or period of the indicator. The algorithm uses this parameter to calculate the base level and standard deviations. Higher values are better for measuring deeper and longer surges.
Levels Stability : the parameter used in the up-move detection. The higher the value is, the more stable and long the greed levels are, but at the same time, the lag increases. The lower it is, the faster the indicator responds to the price changes, but the greed levels are recalculated more frequently and are less stable. This parameter is mostly for fine-tuning. It does not change the overall picture much.
Mode : the parameter that defines the style for the labels. In the Cool Guys Mode , the indicator displays the labels as emojis. In the Serious Guys Mode , labels show the distance from the base level measured in standard deviation units or sigmas.

Closing MomentumClosing momentum calculates the moving averages of closes and highs vs previous highs plus those of closes and lows vs previous lows to create momentum moving averages. Closes above/below previous highs/lows are weighted more strongly than new high or low wicks above/below a previous highs or lows.
If momentum is up, the background will shade green; brighter is stronger. If momentum is down, likewise with red.
Shifts in momentum are indicated by symbols: triangles indicate a minor shifts, arrows moderate, big arrows major. Likewise, the shade of the symbols indicates strength (darker is stronger).
Using the indicator: long continuous stretches of the same color indicate trend - deeper is stronger. If the shade is lightening or clears and/or if symbols of the other color start appearing, the trend is weakening.

+ Magic Carpet BandsFun name for an indicator, eh? Well, it is true, I think; they look like magic carpets. They're actually pretty simple actually. They're Keltner Channels smoothed with a moving average. If you go down to the lookback period for the bands and set it to 1, you'll recognize them immediately.
Digging a bit deeper you see there are four magic carpets on the chart. The inner ones are set to a multiplier of 2, and the outer to a multiplier of 4. Each "carpet" is composed of two smoothed upper or lower Keltner Channels bounds, both with an optional offset, one of which is set to 13, and the other to 0 by default; and an optional color fill between these. There is also a color fill between the outer and inner carpets which gives them an interesting 3-dimensional aspect at times. They can look a bit like tunnels by default.
My thinking around the idea of using an offset with the bands is that if we assume these things to provide a dynamic support and resistance, and previous support and resistance maintains status as support and resistance until proven otherwise, then by putting an offset to past data we are creating a more obvious visual indication of that support or resistance in the present. The default offset is set to 13 bars back, so if price found resistance at some point around 13 bars ago, and price is currently revisiting it we assume it is still resistance, and that offset band is there to give us a strong visual aid. Obviously it's not foolproof, but nothing is.
Beyond that most interesting part of the indicator you have a nice selection of moving averages which the bands are calculated off of. By default it's set to my UMA. The bands themselves also have a selection of moving averages for how the keltner channels are smoothed. And a note: because the UMA and RDMA are averages of different length MAs, they can not be adjusted other than via the multiplier that sets the distance from the moving average.
The indicator is multi-timeframe, and the moving average can be colored based on a higher timeframe as well.
I popped in the divergence indicator here too. You can choose from RSI and OBV, and the divergences will be plotted on the chart. Working on finding a way to be able to have the bands/MA set to a higher timeframe while plotting the divergences on the chart timeframe, but don't have an answer to that yet.
Alerts for moving average crosses, band touches, and divergences.
I like this one a lot. Enjoy!
Pictures below.
s3.tradingview.com
One interesting thing about this indicator is that band twists often occur at areas of support or resistance. Simply drawing horizontal lines from previous twisted points can provide places from which you may look for strength or weakness to enter into a trade, or which you might use as targets for taking profits. The vertical lines are just showing the point on the chart when the cross occurred.
s3.tradingview.com
Above is a Jurik MA with a bunch of adjustments made to the bands, and the moving average itself. Everything is super adjustable, so you can play around and have fun with them quite a bit.
s3.tradingview.com
Just a different MA and bands.
s3.tradingview.com

Trendalix EntriesThis script is made to simplify the analysis of trends. It changes the mas based on whether you're looking at stocks or crypto. As these 2 markets currently move differently, they need a slightly different approach.
Crypto trends:
Can move much faster than stocks. Ideally the price should be bouncing above the williams alligators (about the 20-30 MAs).
Stocks:
These swing more than crypto so you need to get deep into these swing to be buying at the bottom of a move. The MAs are much larger, between the 50ma and 400ma. It's much more important here that the slower MAs are strong, i.e 200ma is above the 400ma, than it is that the faster MAs are okay.
For stocks an entry and stop line is drawn. These are only visible when the market is sufficiently in a pullback.

VertLine on Moonhe sixth Mount type is the Lunarian, so named from the fact that the portion of the hand by which they are identified is the Mount of Luna or, as it is more commonly designated, the Mount of the Moon.
As single signs or in combination, the star, triangle, circle, single vertical line, square, or trident strengthen the Mount of the Moon.
Grilles, crosses, cross-bars, islands, dots, or badly formed stars indicate defects of the Mount, either of health or character.
Color, nails, and other matters detailed in the course of this chapter will determine which (119). The mount of the Moon must be judged both by the strength of its curve outwardly on the percussion of the hand and by the size of the pad it forms on the inside of the palm. If it is seen forming a decided bulge outwardly, call it a well developed Mount (120); if in addition it is exceedingly thick, forming a large pad on the inside of the hand, it must be regarded as a very strong Mount (121); and it the outward protuberance and the thick pad are both unusually large, you have an excessive Lunarian subject (122). In this type vertical lines on the Mount add strength to it and cross lines show defects. If you see a strong vertical line extending the length or nearly so of the Mount, it will indicate and added strength, and a number of vertical lines if lying close together will also increase its power. These lines on a Mount developed at the side, but flat in the palm, will be nearly as powerful as if the Mount showed a medium development inside the palm. If the outward development and the large pad in the palm is seen, which has also a deep, well-cut vertical line or lines, it will show an excessively developed Lunarian reaching to the danger-point of the type.
Kirill ChannelThis indicator shows overbought and oversold zones. Can be used on all time frames. I personally use 15m - 30m.
How to apply ?:
- There can be many strategies for use! I use this indicator to buy an asset in the green zone and then sell it in the middle of the channel or in the red zone.
- I strongly advise against entering counter-trend positions in a growing market if you have little trading experience and understanding of price action.
How do I place orders ?:
- I place orders in a grid.
- If the price is very close to the edge, but it is difficult to reach it, then it is better to open a position on the market and place orders deep into the grid.
- If the price is at the edge of the channel for a very long time, then you need to look at a higher timeframe.
Algorithm composition:
- ALMA
- Keltner Channel
- Fibonacci Retracement
- Custom price percent offset calculations and manipulations.
Settings:
- I strongly do not recommend changing ALMA. These numbers have been specially calculated.
- It's better not to change Borders either. The current algorithm dynamically changes the width of the extreme channels depending on the price movement.
- The Keltner Channel was specially selected.
- Fibonacci Retracement can be changed. This part of the algorithm can be modified to suit your needs. At the moment, there are settings for aggressive trading.
Channel type:
- Conservative: Fibonacci Retracement settings (100 ma, 100 atr, 8 mult, 100 smooth)
- Aggressive: Fibonacci Retracement settings (25 ma, 25 atr, 3.5 mult, 100 smooth)
Сonservative channel does not allow a large number of points to enter positions, however, it is more straightforward and safer for very large movements.
I prefer aggressive settings because they allow me to make more profit on the number of trades.
Try to use both modes and choose what is preferable for you.

Elder Impulse System + ATR BandsDisregard the above chart, I am not sure why it isn't showing the one I want, which is linked below:
This is as far as I can tell the closest representation to Dr. Alexander Elder's updated "Elder Impulse System" that has added ATR-volatility bands up to 3x deviations from price. I got the idea from watching this recent video (www.youtube.com) of Dr. Elder reviewing some recent trades and noticed he had updated his system from his original books. The Impulse System colour coding was inspired by AstralLoverFlow and LazyBear. ATR Bands are pre-programmed Keltner Channels with some modifications such as filing in the ATR Zones with user-selected colour bands and modifying the ATR value to better suit the volatility of the market being traded.
The script has several components, which I will detail below:
Exponential Moving Averages:
1) A 13-period EMA that is used as a staple in all of Dr. Elder's technical analysis. He uses this EMA as the basis for all of his indicators and why it is included here.
2) A 26-period EMA which can be used as a base-line of sorts to filter when to go long or when to go short. For instance, price over the 26-EMA, price is strong and the rally upwards is likely to continue, underneath it, price is weak and likely to continue downwards for a time.
Volatility Bands:
By definition these are nothing more than 3 separate Keltner Channels of a 13-period EMA each set to one additional multiplier from the moving average. This gives us a 1x, 2x, and 3x multiplier of average volatility from the 13-period EMA based on a 14-period Average True Range (ATR) reading. The ATR was chosen as it accommodates price gaps and also is the standard formula calculation in TradingView. The values of the bands cannot be adjusted but the colour coding of them can be.
Elder Impulse System:
These colour-coded bars show you the strength and direction of the current chart resolution, calculated by the slope of a 13-period EMA and the slope of a MACD histogram. These are used not as a buying or selling recommendation alone but as trend filters, as per Dr. Elder's own description of them.
Green Bars = The 13-period EMA is sloping positively and the MACD histogram is rising compared to previous bars. The trader should only consider buying/long opportunities when a green bar is most recent.
Red Bars = The 13-period EMA is sloping negatively and the MACD histogram is falling compared to previous bars. The trader should only consider selling/short opportunities when a red bar is most recent.
Blue Bars = The 13-period EMA and the MACD histogram are not aligned. One of the indicators is sloping opposite to the other indicator. These are known as indecision bars and are typically seen near the end of a previously established trend. The trader can choose to wait for either a green or red bar to shape their trading bias if they are more risk-averse while a counter-trend trader may decide to try opening a position against the currently-established trend.
How To Trade the System:
This system is unique in that it is so versatile and will fit the styles of many traders, be it trend following traders (generally the original Elder Impulse System design) or mean-reversion/counter-trend trading (the original Keltner Channel design). None of the examples below or in the chart above are financial advice and are just there for demonstration purposes only.
1) The most basic signal given would be the moving average cross up or down. A cross of the 13-EMA over the 26-EMA signals upward trend strength and the trader could look for buying opportunities. Conversely, the 13-EMA under the 26-EMA shows downward trend strength and the trader could look for selling opportunities.
2) Following the Elder Impulse system in conjunction with the EMAs. Look for long opportunities when a green bar is printed and price is over both of the 13- and 26-period EMAs. Look for short opportunities when a red bar is printed and price is below both of the 13- and 26-period EMAs. Keep in mind this does not necessarily need a moving average cross to be viable, a green or red bar over both EMAs is a valid signal in this system, usually. Examine price more closely for better entry signals when a blue bar is printed and price is either above or below both EMAs if you are a trend trader. This is how Dr. Elder originally intended the system to be used in conjunction with his famous Triple Screen Trading System. I am not going into detail here as it is a deep subject but I would suggest an interested trader to examine this Triple Screen System further as it is widely accepted as a strong strategy.
3) Mean Reversion and Counter-Trend Trading. Dr. Elder mentions that the zone between the two EMAs is called the Value Zone. A mean reversion trader could look for buying opportunities if price has generally been in an uptrend and falls back to value, conversely, they could look for shorting opportunities if price has generally been in a downtrend and rises back to value. These are your very basic pull backs found in trends that create your higher lows in an uptrend or your lower highs in a downtrend. A mean reversion/scalper trader may also look to use the upper and lower most ATR bands as an indication of price being overbought or oversold and could look to enter a counter-trend trade here once a blue indecision bar is printed and to ride that move back down to the Value Zone.
Taking Profits and Risk Management
This system again is very versatile and will fit a wide range of trading styles. It has built in take profit levels and risk management depending on your style of trading.
1a) In original Triple Screen Trading (and the original Elder Impulse system), a trader was to place a buy order one tick above a newly printed green bar with a stop loss one tick below the most recent 2-day low, and vice-versa for red bars on short selling. as long as other criteria were met, that I will not go into. It is all over YouTube and in his books and on Investopedia if you want more information. The general idea is to continue the trend in the direction if price is strong and you are bought into that move with a close stop, or if price falls back a little bit, you can get in at a better price. This would be a system typically better suited to a scalper.
1b) The updated risk management according to the above video is to place a stop loss at least 2ATR away from price. These bands already have calculated these values so a trader can place a stop one tick below the 2 or even 3ATR zones depending on their risk appetite. This is assuming you have already received a strong buy signal based on the system you follow. This would be a system typically better suited to a trend-trader.
2a) Taking profits if you are a trend trader has several possibilities. The first, as Dr. Elder suggests, is to place a price target 2ATR values away from your entry giving you approximately a 1:1 risk-reward ratio.
2b) The second possibility if the trade is successful is to ride the trend upwards until a blue bar is printed, suggesting indecision in the market. A modified version of this that could let a winning trade run longer is to wait for the price to close under the 13-EMA in fast markets, or close under the 26-EMA in slightly slower markets to maximize potential winnings.
2c) A scalper trader may wish to have a target at either the value zone if they are playing an extended buy/short back to the mean, or if they are being at the mean, to sell or cover when price extends back out to the 2x or 3x zone.
3) Trend traders can additionally use the ATR zones as a sort of safety guidelines for entering a trade. Anything within the 1ATR zone is typically a safer entry as the market is less volatile at this time. Entering when price has gone into the 2ATR zone is signaled as a strong momentum move and can signal a stronger move in the direction of the current closing bar. While not always the case, it is suggested by Dr. Elder to not enter trend trades at the 3ATR zone as this is where you will be likely looking for a counter-trend retracement back to value and a trader entering here in the direction of the trade has a higher chance of being stopped out or not getting in at the best possible price.

Webhook Starter Kit [HullBuster]
Introduction
This is an open source strategy which provides a framework for webhook enabled projects. It is designed to work out-of-the-box on any instrument triggering on an intraday bar interval. This is a full featured script with an emphasis on actual trading at a brokerage through the TradingView alert mechanism and without requiring browser plugins.
The source code is written in a self documenting style with clearly defined sections. The sections “communicate” with each other through state variables making it easy for the strategy to evolve and improve. This is an excellent place for Pine Language beginners to start their strategy building journey. The script exhibits many Pine Language features which will certainly ad power to your script building abilities.
This script employs a basic trend follow strategy utilizing a forward pyramiding technique. Trend detection is implemented through the use of two higher time frame series. The market entry setup is a Simple Moving Average crossover. Positions exit by passing through conditional take profit logic. The script creates ten indicators including a Zscore oscillator to measure support and resistance levels. The indicator parameters are exposed through 47 strategy inputs segregated into seven sections. All of the inputs are equipped with detailed tool tips to help you get started.
To improve the transition from simulation to execution, strategy.entry and strategy.exit calls show enhanced message text with embedded keywords that are combined with the TradingView placeholders at alert time. Thereby, enabling a single JSON message to generate multiple execution events. This is genius stuff from the Pine Language development team. Really excellent work!
This document provides a sample alert message that can be applied to this script with relatively little modification. Without altering the code, the strategy inputs can alter the behavior to generate thousands of orders or simply a few dozen. It can be applied to crypto, stocks or forex instruments. A good way to look at this script is as a webhook lab that can aid in the development of your own endpoint processor, impress your co-workers and have hours of fun.
By no means is a webhook required or even necessary to benefit from this script. The setups, exits, trend detection, pyramids and DCA algorithms can be easily replaced with more sophisticated versions. The modular design of the script logic allows you to incrementally learn and advance this script into a functional trading system that you can be proud of.
Design
This is a trend following strategy that enters long above the trend line and short below. There are five trend lines that are visible by default but can be turned off in Section 7. Identified, in frequency order, as follows:
1. - EMA in the chart time frame. Intended to track price pressure. Configured in Section 3.
2. - ALMA in the higher time frame specified in Section 2 Signal Line Period.
3. - Linear Regression in the higher time frame specified in Section 2 Signal Line Period.
4. - Linear Regression in the higher time frame specified in Section 2 Signal Line Period.
5. - DEMA in the higher time frame specified in Section 2 Trend Line Period.
The Blue, Green and Orange lines are signal lines are on the same time frame. The time frame selected should be at least five times greater than the chart time frame. The Purple line represents the trend line for which prices above the line suggest a rising market and prices below a falling market. The time frame selected for the trend should be at least five times greater than the signal lines.
Three oscillators are created as follows:
1. Stochastic - In the chart time frame. Used to enter forward pyramids.
2. Stochastic - In the Trend period. Used to detect exit conditions.
3. Zscore - In the Signal period. Used to detect exit conditions.
The Stochastics are configured identically other than the time frame. The period is set in Section 2.
Two Simple Moving Averages provide the trade entry conditions in the form of a crossover. Crossing up is a long entry and down is a short. This is in fact the same setup you get when you select a basic strategy from the Pine editor. The crossovers are configured in Section 3. You can see where the crosses are occurring by enabling Show Entry Regions in Section 7.
The script has the capacity for pyramids and DCA. Forward pyramids are enabled by setting the Pyramid properties tab with a non zero value. In this case add on trades will enter the market on dips above the position open price. This process will continue until the trade exits. Downward pyramids are available in Crypto and Range mode only. In this case add on trades are placed below the entry price in the drawdown space until the stop is hit. To enable downward pyramids set the Pyramid Minimum Span In Section 1 to a non zero value.
This implementation of Dollar Cost Averaging (DCA) triggers off consecutive losses. Each loss in a run increments a sequence number. The position size is increased as a multiple of this sequence. When the position eventually closes at a profit the sequence is reset. DCA is enabled by setting the Maximum DCA Increments In Section 1 to a non zero value.
It should be noted that the pyramid and DCA features are implemented using a rudimentary design and as such do not perform with the precision of my invite only scripts. They are intended as a feature to stress test your webhook endpoint. As is, you will need to buttress the logic for it to be part of an automated trading system. It is for this reason that I did not apply a Martingale algorithm to this pyramid implementation. But, hey, it’s an open source script so there is plenty of room for learning and your own experimentation.
How does it work
The overall behavior of the script is governed by the Trading Mode selection in Section 1. It is the very first input so you should think about what behavior you intend for this strategy at the onset of the configuration. As previously discussed, this script is designed to be a trend follower. The trend being defined as where the purple line is predominately heading. In BiDir mode, SMA crossovers above the purple line will open long positions and crosses below the line will open short. If pyramiding is enabled add on trades will accumulate on dips above the entry price. The value applied to the Minimum Profit input in Section 1 establishes the threshold for a profitable exit. This is not a hard number exit. The conditional exit logic must be satisfied in order to permit the trade to close. This is where the effort put into the indicator calibration is realized. There are four ways the trade can exit at a profit:
1. Natural exit. When the blue line crosses the green line the trade will close. For a long position the blue line must cross under the green line (downward). For a short the blue must cross over the green (upward).
2. Alma / Linear Regression event. The distance the blue line is from the green and the relative speed the cross is experiencing determines this event. The activation thresholds are set in Section 6 and relies on the period and length set in Section 2. A long position will exit on an upward thrust which exceeds the activation threshold. A short will exit on a downward thrust.
3. Exponential event. The distance the yellow line is from the blue and the relative speed the cross is experiencing determines this event. The activation thresholds are set in Section 3 and relies on the period and length set in the same section.
4. Stochastic event. The purple line stochastic is used to measure overbought and over sold levels with regard to position exits. Signal line positions combined with a reading over 80 signals a long profit exit. Similarly, readings below 20 signal a short profit exit.
Another, optional, way to exit a position is by Bale Out. You can enable this feature in Section 1. This is a handy way to reduce the risk when carrying a large pyramid stack. Instead of waiting for the entire position to recover we exit early (bale out) as soon as the profit value has doubled.
There are lots of ways to implement a bale out but the method I used here provides a succinct example. Feel free to improve on it if you like. To see where the Bale Outs occur, enable Show Bale Outs in Section 7. Red labels are rendered below each exit point on the chart.
There are seven selectable Trading Modes available from the drop down in Section 1:
1. Long - Uses the strategy.risk.allow_entry_in to execute long only trades. You will still see shorts on the chart.
2. Short - Uses the strategy.risk.allow_entry_in to execute short only trades. You will still see long trades on the chart.
3. BiDir - This mode is for margin trading with a stop. If a long position was initiated above the trend line and the price has now fallen below the trend, the position will be reversed after the stop is hit. Forward pyramiding is available in this mode if you set the Pyramiding value in the Properties tab. DCA can also be activated.
4. Flip Flop - This is a bidirectional trading mode that automatically reverses on a trend line crossover. This is distinctively different from BiDir since you will get a reversal even without a stop which is advantageous in non-margin trading.
5. Crypto - This mode is for crypto trading where you are buying the coins outright. In this case you likely want to accumulate coins on a crash. Especially, when all the news outlets are talking about the end of Bitcoin and you see nice deep valleys on the chart. Certainly, under these conditions, the market will be well below the purple line. No margin so you can’t go short. Downward pyramids are enabled for Crypto mode when two conditions are met. First the Pyramiding value in the Properties tab must be non zero. Second the Pyramid Minimum Span in Section 1 must be non zero.
6. Range - This is a counter trend trading mode. Longs are entered below the purple trend line and shorts above. Useful when you want to test your webhook in a market where the trend line is bisecting the signal line series. Remember that this strategy is a trend follower. It’s going to get chopped out in a range bound market. By turning on the Range mode you will at least see profitable trades while stuck in the range. However, when the market eventually picks a direction, this mode will sustain losses. This range trading mode is a rudimentary implementation that will need a lot of improvement if you want to create a reliable switch hitter (trend/range combo).
7. No Trade. Useful when setting up the trend lines and the entry and exit is not important.
Once in the trade, long or short, the script tests the exit condition on every bar. If not a profitable exit then it checks if a pyramid is required. As mentioned earlier, the entry setups are quite primitive. Although they can easily be replaced by more sophisticated algorithms, what I really wanted to show is the diminished role of the position entry in the overall life of the trade. Professional traders spend much more time on the management of the trade beyond the market entry. While your trade entry is important, you can get in almost anywhere and still land a profitable exit.
If DCA is enabled, the size of the position will increase in response to consecutive losses. The number of times the position can increase is limited by the number set in Maximum DCA Increments of Section 1. Once the position breaks the losing streak the trade size will return the default quantity set in the Properties tab. It should be noted that the Initial Capital amount set in the Properties tab does not affect the simulation in the same way as a real account. In reality, running out of money will certainly halt trading. In fact, your account would be frozen long before the last penny was committed to a trade. On the other hand, TradingView will keep running the simulation until the current bar even if your funds have been technically depleted.
Entry and exit use the strategy.entry and strategy.exit calls respectfully. The alert_message parameter has special keywords that the endpoint expects to properly calculate position size and message sequence. The alert message will embed these keywords in the JSON object through the {{strategy.order.alert_message}} placeholder. You should use whatever keywords are expected from the endpoint you intend to webhook in to.
Webhook Integration
The TradingView alerts dialog provides a way to connect your script to an external system which could actually execute your trade. This is a fantastic feature that enables you to separate the data feed and technical analysis from the execution and reporting systems. Using this feature it is possible to create a fully automated trading system entirely on the cloud. Of course, there is some work to get it all going in a reliable fashion. Being a strategy type script place holders such as {{strategy.position_size}} can be embedded in the alert message text. There are more than 10 variables which can write internal script values into the message for delivery to the specified endpoint.
Entry and exit use the strategy.entry and strategy.exit calls respectfully. The alert_message parameter has special keywords that my endpoint expects to properly calculate position size and message sequence. The alert message will embed these keywords in the JSON object through the {{strategy.order.alert_message}} placeholder. You should use whatever keywords are expected from the endpoint you intend to webhook in to.
Here is an excerpt of the fields I use in my webhook signal:
"broker_id": "kraken",
"account_id": "XXX XXXX XXXX XXXX",
"symbol_id": "XMRUSD",
"action": "{{strategy.order.action}}",
"strategy": "{{strategy.order.id}}",
"lots": "{{strategy.order.contracts}}",
"price": "{{strategy.order.price}}",
"comment": "{{strategy.order.alert_message}}",
"timestamp": "{{time}}"
Though TradingView does a great job in dispatching your alert this feature does come with a few idiosyncrasies. Namely, a single transaction call in your script may cause multiple transmissions to the endpoint. If you are using placeholders each message describes part of the transaction sequence. A good example is closing a pyramid stack. Although the script makes a single strategy.close() call, the endpoint actually receives a close message for each pyramid trade. The broker, on the other hand, only requires a single close. The incongruity of this situation is exacerbated by the possibility of messages being received out of sequence. Depending on the type of order designated in the message, a close or a reversal. This could have a disastrous effect on your live account. This broker simulator has no idea what is actually going on at your real account. Its just doing the job of running the simulation and sending out the computed results. If your TradingView simulation falls out of alignment with the actual trading account lots of really bad things could happen. Like your script thinks your are currently long but the account is actually short. Reversals from this point forward will always be wrong with no one the wiser. Human intervention will be required to restore congruence. But how does anyone find out this is occurring? In closed systems engineering this is known as entropy. In practice your webhook logic should be robust enough to detect these conditions. Be generous with the placeholder usage and give the webhook code plenty of information to compare states. Both issuer and receiver. Don’t blindly commit incoming signals without verifying system integrity.
Setup
The following steps provide a very brief set of instructions that will get you started on your first configuration. After you’ve gone through the process a couple of times, you won’t need these anymore. It’s really a simple script after all. I have several example configurations that I used to create the performance charts shown. I can share them with you if you like. Of course, if you’ve modified the code then these steps are probably obsolete.
There are 47 inputs divided into seven sections. For the most part, the configuration process is designed to flow from top to bottom. Handy, tool tips are available on every field to help get you through the initial setup.
Step 1. Input the Base Currency and Order Size in the Properties tab. Set the Pyramiding value to zero.
Step 2. Select the Trading Mode you intend to test with from the drop down in Section 1. I usually select No Trade until I’ve setup all of the trend lines, profit and stop levels.
Step 3. Put in your Minimum Profit and Stop Loss in the first section. This is in pips or currency basis points (chart right side scale). Remember that the profit is taken as a conditional exit not a fixed limit. The actual profit taken will almost always be greater than the amount specified. The stop loss, on the other hand, is indeed a hard number which is executed by the TradingView broker simulator when the threshold is breached.
Step 4. Apply the appropriate value to the Tick Scalar field in Section 1. This value is used to remove the pipette from the price. You can enable the Summary Report in Section 7 to see the TradingView minimum tick size of the current chart.
Step 5. Apply the appropriate Price Normalizer value in Section 1. This value is used to normalize the instrument price for differential calculations. Basically, we want to increase the magnitude to significant digits to make the numbers more meaningful in comparisons. Though I have used many normalization techniques, I have always found this method to provide a simple and lightweight solution for less demanding applications. Most of the time the default value will be sufficient. The Tick Scalar and Price Normalizer value work together within a single calculation so changing either will affect all delta result values.
Step 6. Turn on the trend line plots in Section 7. Then configure Section 2. Try to get the plots to show you what’s really happening not what you want to happen. The most important is the purple trend line. Select an interval and length that seem to identify where prices tend to go during non-consolidation periods. Remember that a natural exit is when the blue crosses the green line.
Step 7. Enable Show Event Regions in Section 7. Then adjust Section 6. Blue background fills are spikes and red fills are plunging prices. These measurements should be hard to come by so you should see relatively few fills on the chart if you’ve set this up as intended. Section 6 includes the Zscore oscillator the state of which combines with the signal lines to detect statistically significant price movement. The Zscore is a zero based calculation with positive and negative magnitude readings. You want to input a reasonably large number slightly below the maximum amplitude seen on the chart. Both rise and fall inputs are entered as a positive real number. You can easily use my code to create a separate indicator if you want to see it in action. The default value is sufficient for most configurations.
Step 8. Turn off Show Event Regions and enable Show Entry Regions in Section 7. Then adjust Section 3. This section contains two parts. The entry setup crossovers and EMA events. Adjust the crossovers first. That is the Fast Cross Length and Slow Cross Length. The frequency of your trades will be shown as blue and red fills. There should be a lot. Then turn off Show Event Regions and enable Display EMA Peaks. Adjust all the fields that have the word EMA. This is actually the yellow line on the chart. The blue and red fills should show much less than the crossovers but more than event fills shown in Step 7.
Step 9. Change the Trading Mode to BiDir if you selected No Trades previously. Look on the chart and see where the trades are occurring. Make adjustments to the Minimum Profit and Stop Offset in Section 1 if necessary. Wider profits and stops reduce the trade frequency.
Step 10. Go to Section 4 and 5 and make fine tuning adjustments to the long and short side.
Example Settings
To reproduce the performance shown on the chart please use the following configuration: (Bitcoin on the Kraken exchange)
1. Select XBTUSD Kraken as the chart symbol.
2. On the properties tab set the Order Size to: 0.01 Bitcoin
3. On the properties tab set the Pyramiding to: 12
4. In Section 1: Select “Crypto” for the Trading Model
5. In Section 1: Input 2000 for the Minimum Profit
6. In Section 1: Input 0 for the Stop Offset (No Stop)
7. In Section 1: Input 10 for the Tick Scalar
8. In Section 1: Input 1000 for the Price Normalizer
9. In Section 1: Input 2000 for the Pyramid Minimum Span
10. In Section 1: Check mark the Position Bale Out
11. In Section 2: Input 60 for the Signal Line Period
12. In Section 2: Input 1440 for the Trend Line Period
13. In Section 2: Input 5 for the Fast Alma Length
14. In Section 2: Input 22 for the Fast LinReg Length
15. In Section 2: Input 100 for the Slow LinReg Length
16. In Section 2: Input 90 for the Trend Line Length
17. In Section 2: Input 14 Stochastic Length
18. In Section 3: Input 9 Fast Cross Length
19. In Section 3: Input 24 Slow Cross Length
20. In Section 3: Input 8 Fast EMA Length
21. In Section 3: Input 10 Fast EMA Rise NetChg
22. In Section 3: Input 1 Fast EMA Rise ROC
23. In Section 3: Input 10 Fast EMA Fall NetChg
24. In Section 3: Input 1 Fast EMA Fall ROC
25. In Section 4: Check mark the Long Natural Exit
26. In Section 4: Check mark the Long Signal Exit
27. In Section 4: Check mark the Long Price Event Exit
28. In Section 4: Check mark the Long Stochastic Exit
29. In Section 5: Check mark the Short Natural Exit
30. In Section 5: Check mark the Short Signal Exit
31. In Section 5: Check mark the Short Price Event Exit
32. In Section 5: Check mark the Short Stochastic Exit
33. In Section 6: Input 120 Rise Event NetChg
34. In Section 6: Input 1 Rise Event ROC
35. In Section 6: Input 5 Min Above Zero ZScore
36. In Section 6: Input 120 Fall Event NetChg
37. In Section 6: Input 1 Fall Event ROC
38. In Section 6: Input 5 Min Below Zero ZScore
In this configuration we are trading in long only mode and have enabled downward pyramiding. The purple trend line is based on the day (1440) period. The length is set at 90 days so it’s going to take a while for the trend line to alter course should this symbol decide to node dive for a prolonged amount of time. Your trades will still go long under those circumstances. Since downward accumulation is enabled, your position size will grow on the way down.
The performance example is Bitcoin so we assume the trader is buying coins outright. That being the case we don’t need a stop since we will never receive a margin call. New buy signals will be generated when the price exceeds the magnitude and speed defined by the Event Net Change and Rate of Change.
Feel free to PM me with any questions related to this script. Thank you and happy trading!
CFTC RULE 4.41
These results are based on simulated or hypothetical performance results that have certain inherent limitations. Unlike the results shown in an actual performance record, these results do not represent actual trading. Also, because these trades have not actually been executed, these results may have under-or over-compensated for the impact, if any, of certain market factors, such as lack of liquidity. Simulated or hypothetical trading programs in general are also subject to the fact that they are designed with the benefit of hindsight. No representation is being made that any account will or is likely to achieve profits or losses similar to these being shown.

Falcon Commodity Channel IndexFalcon CCI indicator is a superb indicator for anyone who wants to dig deep and still float. The trading lifestyle requires you to be one step ahead of everyone else, while doing so, you want to manage risk, enter at correct positions and perhaps exit at correct positions too.
Exiting at correct positions is so over rated, people tend to forget that exit is as important as entry and therefore we need to make sure that we use a good indicator setup that helps us to do that.
Falcon CCI Indicator is a receipe developed by me during recent Bitcoin slump, where we really needed something more to help us get pass through ups and downs, sudden movements and volatility in the market.
This indicator is perfect even for the swing and trend traders, intra day and day traders who want a quick win, rather than invest for long term.
Here are entry and exit plans based on this indicator:-
Setup: I keep CCI at 20, MA at 14 and EMA at 7 but I change it depending on the stock or crypto. Truth is, you can play with it and find what is best for your trading setups, but once you are done, it really works.
Buy: Buy when CCI crosses above MA or EMA , but CCI should be below 50
Sell: Sell when CCI crosses below MA or EMA (You need to choose), CCI should be above 150
There can be other entry and exit based on just CCI values, and therefore I have added some max and min inputs too in the indicator, e.g. Buy when CCI is -180 and sell when CCI is 300.
Trading is a long process.
To all my friends who have lost in futures , or anywhere else in the market, don't worry, just follow the process and follow your own rules. Don't break them.
You can connect with me on Trading View, message me to discuss this further. Happy to take your questions.
P.S you can also add linear regression to this to give you certain price points, for market tops or bottoms within the time frame.
Multi Level ZigZag Harmonic PatternsLets make things bit complicated.
Main difference between this script and the earlier Multi Zigzag Harmonic Pattern is the calculation logic of Zigzag 2, 3 and 4
In the earlier script, all zigzags were plain and were calculated on the basis of different lengths. (Such as 5, 10, 15, 20). These were derived on the basis of Multi Zigzag indicator
In this script, Zigzag 2, 3 and 4 are calculated in slightly different way. They are calculated on the basis of previous zigzag. This means, Zigzag 1 will be the input for Zigzag2 calculation and Zigzag 2 will be the input for Zigzag3 and so on. This is demonstrated in the script - Multi Level Zigzag
One important parameter which is specific to this script is: UseZigZagChain
If checked:
Zigzag2 is formed based on Zigzag1
Zigzag3 is formed based on Zigzag2
Zigzag4 is formed based on Zigzag3
This can lead to patterns covering huge number of candles as this chaining causes exponential effect in each levels. (Effective length grows exponentially in each level)
If unchecked:
Zigzag2 is formed based on Zigzag1 (Same as when checked)
Zigzag3 is formed based on Zigzag1. But, length is set to zigzag2Length + zigzag3Length
Zigzag4 is formed based on Zigzag1. But, length is set to zigzag2Length + zigzag3Length + zigzag4Length
This reduces exponential increase of zigzag lengths over next levels.
Logical ratios of patterns are coded as below:
Notations:
Lines XABCD forms the pattern in all cases. (OXABCD in case of Three drives )
abc = BC retacement of AB, xab = AB retracement of XA and so on
ABCD Classic
0.618 <= abc <= 0.786
1.272 <= bcd <= 1.618
AB=CD
Price difference between AB and CD are equal
Time difference between AB and CD are equal
ABCD Extension
0.618 <= abc <= 0.786
1.272 <= AD/ BC (price) <= 1.618
Gartley
xab = 0.618
0.382 <= abc <= 0.886
1.272 <= bcd <= 1.618 OR xad = 0.786
Crab
0.382 <= xab <= 0.618
0.382 <= abc <= 0.886
2.24 <= bcd <= 3.618 OR xad = 1.618
Deep Crab
xab = 0.886
0.382 <= abc <= 0.886
2.0 <= bcd <= 3.618 OR xad = 1.618
Bat
0.382 <= xab <= 0.50
0.382 <= abc <= 0.886
1.618 <= bcd <= 2.618 OR xad = 0.886
Butterfly
xab = 0.786
0.382 <= abc <= 0.886
1.618 <= bcd <= 2.618 OR 1.272 <= xad <= 2.618
Shark
xab = 0.786
1.13 <= abc <= 1.618
1.618 <= bcd <= 2.24 OR 0.886 <= xad <= 1.13
Cypher
0.382 <= xab <= 0.618
1.13 <= abc <= 1.414
1.272 <= bcd <= 2.0 OR xad = 0.786
Three Drives
oxa = 0.618
1.27 <= xab <= 1.618
abc = 0.618
1.27 <= bcd <= 1.618
5-0
1.13 <= xab <= 1.618
1.618 <= abc <= 2.24
bcd = 0.5
Double Bottom
Last two pivot High Lows make W shape
Last Pivot Low is higher than previous Last Pivot Low.
Last Pivot High is lower than previous last Pivot High.
Price has not gone below Last Pivot Low
Price breaks out of last Pivot High to complete W shape
Double Top
Last two pivot High Lows make M shape
Last Pivot Low is higher than previous Last Pivot Low.
Last Pivot High is lower than previous last Pivot High.
Price has not gone above Last Pivot High
Price breaks out of last Pivot Low to complete M shape
Bjorgum MTF MAScope:
Up to 3 MA's can be applied at the users discretion
Choose between 10 different average types including favorites from the Bjorgum series from HEMA to Reversal T3's
Each MA can be independently set
Go Multi-timeframe! Any MA can be set to any timeframe of reference you choose (ex. using 3 different timeframes of higher resolution to your chart reference to establish a multi-time frame trend)
RSI HEATMAP. Use the bar color or the MA color selection toggle to set your color to reference RSI on a gradient. This helps to establish clear visual reference to momentum on top of trend analysis
Assigning RSI bar color to an MA of a higher time frame can allow you to see visual reference of momentum of the greater trend that may be at play.
Example: trying to get short on a 15min while your 1hr and 4hr RSI Heatmap burns deep in oversold.
RSI color can be assigned to the bar color, the MA (1,2 or 3), or both. Alternatively, bar color can be assigned to a more simple rising/ falling MA color and price above/ below the MA for bar color.
ALL MTF FUNCTIONS ARE NON_REPAINTING.
The Idea
The original inspiration behind the script came from an observation of a constant struggle of Pinecoders of both youth or experience to find accurate multi-timeframe indicators that do not repaint, and appear as should on historical bars, while performing reliably in real time. I encourage you to scroll the Pinecoders FAQ on a recent piece explaining the difficulties and caveats of different approaches, but I would like to reference the elimination of the historical bar offset for THIS purpose. MA's are based on closing prices, that is to say they are confirmed and will not change once the bar has closed. There is no need to offset these for historical reference. The purpose of the historical offset is best exemplified, for example, with an intraday strategy involving daily breakouts. Let's entertain going long on a break to a new daily high. We would not know that in real time so we need to reference the previous bars close for BACKTESTING purposes, otherwise we get "lookahead bias". There is no shortage of strategies unintentionally employing this bias out there (I'm sure you have come across them with their unrealistic results).
There is no worry of repainting with the MTF security function included within this script, nor will it offset for something involving lookahead bias. I encourage those that are playing with the code or perhaps writing strategies of their own to borrow the functions within. There is also a function that will return the 10 MA variable selection - yours to keep.
With all that in mind, I wanted a practical script that is easily deployable in everyday trading for the average trader that gives the user a firm grip on their trading steering wheel equipped with the feel of the road. Incorporating several MA's of differing times with the RSI heatmap gives a good visual reference and feel to your trading environment, while offering a level of customization that will fit an individuals personal trading style. The RSI heatmap gradient is per percentage between 30 and 70 and your 2 colors - anything outside of those levels gives you the vibrant bias color
Below I walk through 2 examples of live trades scenarios I made using the mindset the script offers.
The Trade
LONG IZEA
Timeframe: 4hr chart
- 3 Tilson MA's of varying length are deployed at varying intraday time frames
- A bullish pattern in an uptrend offers a possible trade allowing entry from a low risk point from the pattern low
- See the chart for notes and observations using the script
- Notice how the heatmap brightens up as price extends far away from the averages - your risk has elevated for a new position
- Notice the heatmap cool off while price action consolidates sideways
The Trade
SHORT BTCUSDT
Timeframe: 4hr chart
- 3 EMAs are employed - same length (50), with 3 successive timeframe resolutions
- A downtrend is formed with a sharp move to stack the EMAs into layers
- A pull back opportunity presents itself in bearish consolidation
- Notice a Doji star at resistance establishing a swing high as RSI cools off into the EMA dynamic resistance for entry
- An '"equal legs" measured move can be used for a trade target with a stop out above the swing high.
- Again, take note of distance from EMA's, the heatmap in combination with trend development surrounding the MA's
These were just two ideas to show you an example of how to implement some strategy into your trading and to get some interesting use from the indicator. Hope you enjoyed the read and happy trading.
