Multi-Length Stochastic Average [LuxAlgo]This indicator returns the average of stochastic oscillators with periods ranging from 4 to length . This allows for a slightly more reactive oscillator as well as having information regarding the position of the price relative to rolling maximums/minimums of different periods.
We introduce settings that allow for pre and post-smoothing, with selectable smoothing methods and periods for both steps.
Settings
Length: Period of the indicator, determine the maximum period of the stochastic oscillator used in the average
Source: Source input of the indicator
Pre-Smoothing (1st Input): Degree of smoothing applied to the source input
Pre-Smoothing (2nd Input): Pre-Smoothing Method
Post-Smoothing (1st Input): Degree of smoothing applied to the final oscillator output
Post-Smoothing (2nd Input): Post-Smoothing Method
Smoothing methods include a simple moving average, a triangular moving average, and a least-squares moving average (this method can induce overshoots during the post-smoothing step). The user can also select "None".
Usages
The "multi-length" aspect of technical indicators is something that hasn't been deeply explored yet such indicators can give us information regarding both short-term and long-term information which was the motivation for the creation of the indicator.
The Multi-length Stochastic Average allows us to quantify the price position relative to a multitude of highest/lowest levels.
In the example above the oscillator returns the average of stochastic oscillators with periods ranging from 4 to 20, as well as multiple rolling minimums with periods ranging from 4 to 20. We can see that when the price is equal to all rolling minimums the oscillator is equal to 0, the oscillator would return 100 if the price were equal to all rolling maximums with periods in that same range.
The oscillator can be interpreted like any scaled oscillator and can be used to estimate trend direction as well as trend strength.
Here we only make of use pre-smoothing by using a period 20 simple moving average. The indicator graphical elements such as colors/circles can help us determine potential directions trends might take.
Circles are displayed when the oscillator crosses over/under the 20/80 level. Such conditions offer better timing than waiting for the oscillator to be greater/lower than 50 and are less subjective to noise than simply looking at the direction taken by the oscillator. However, it can suffer from potential retracements in a trend more easily, this is illustrated in the chart above.
"deep股票代码" için komut dosyalarını ara

RSI CCI Correlating Oscillator (RCCO) by empowerTRCCO is pronounced "ree-koh" or "rico".
The RCCO is simply the plot of the values of both the RSI and CCI added together.
The RCCO makes some adjustments though, so that both the RSI and the CCI will fit correctly on the same scale - and so that these adjustments for scale allow reversals to be detected at crossings.
When the CCI crosses from underneath to up above the RSI, this is usually a bullish reversal. Alternatively, when the CCI crosses from above to back under the RSI, that usually signals a bearish trend. Look for the widest swings you can find to ensure good momentum. The larger the volume, the clearer and more decisive the trends. Low volume will lead to ranging and lazy momentum. High volume will create clear and forceful trends. The lowest negative RCCO in a timeframe, and then add some high volume... and you have yourself a good setup for a successful trade.
Because the RSI and CCI are adjusted, you may not recognize their values from having used the respective indicators on their own. The RSI and CCI values are less important. What matters with this indicator are the crossings and the RCCO value. The RCCO value should be negative, preferably, a deeply negative value. Look at the historical chart for the target per your selected timeframe and decide what values work for you.
I hope you enjoy the RCCO and that it can help you become a little más RICO!

RSI band with Signal alert//th/en
//th
สวัสดีครับท่านสมาชิก
ก่อนอื่นต้องขอเกริ่นก่อนเลยว่า Indicator ตัวนี้ถูกสร้างขึ้นมาบนพื้นฐานของ RSI จริง เพียงแต่ใช้ค่า EMA27 ในการสร้าง เนื่องจากผมยังไม่สามารถเขียน RSI band ที่โยงกับราคาได้ในส่วนนี้เองได้
แต่ทั้งนี้ขอให้ท่านใจเย็น ๆ และฟังผมสักหน่อย เนื่องจากก่อนหน้านี้ผมได้สังเกตเห็นว่า EMA27 นั้นมีค่าเท่ากับ RSI14 ที่ค่า 50 พอดี ดังนั้นผมจึงเลือกที่จะสร้างมันขึ้นมาด้วย EMA27 เพราะง่ายต่อการเขียน
วิธีการใช้งานมีดังต่อไปนี้
Indicator ตัวนี้ใช้งานเหมือน RSI14 วิธีการอ่านคือให้นับเส้น EMA27 เป็นค่า 50 ของ RSI14 ดังนั้นให้เราพิจารณาการซื้อขายดังต่อไปนี้ (โดยหลังจากนี้ผมจะเรียก EMA27 ที่สร้างขึ้นว่า RSI band)
พิจารณาเข้าซื้อ : เมื่อราคาทะลุ RSI band ขึ้นไปและย่อตัวทำ Higher Low เหนือเส้น RSI band
พิจารณาขายออก : เมื่อราคาทะลุ RSI band ลงมาและรีบาวน์ทำ Lower High ใต้เส้น RSI band
# ทั้งนี้ผมได้ทำสีแท่งเทียนไว้เพื่อให้ง่ายต่อการสังเกต โดยการนำไปใช้อาจนำสีของเส้นขอบแท่งเทียนออก แล้วในส่วนของไส้แท่งเทียนให้ใช้สีที่ไม่เจาะจงราคาบวกลบอย่างสี #434651
โดยเราสามารถดู Divergence โดยการเทียบความต่างระหว่างราคาและ RSI band ได้ดังนี้
ในแนวโน้มขาลง : ให้เปรียบเทียบความต่างระหว่างราคากับ RSI band ของ Lower Low ปัจจุบันกับ Low ก่อนหน้า โดยถ้าความต่างของ Low ลดลงเรื่อย ๆ จนราคาเข้าใกล้เส้น RSI band ให้พิจารณาเข้าซื้อ
ในแนวโน้มขาขึ้น : ให้เปรียบเทียบความต่างระหว่างราคากับ RSI band ของ Higher High ปัจจุบันกับ High ก่อนหน้า โดยถ้าความต่างของ High ดลงเรื่อย ๆ จนราคาเข้าใกล้เส้น RSI band ให้พิจารณาขายออก
ทั้งนี้ผมได้สร้าง Signal alert ไว้เพื่อให้ง่ายต่อการสังเกต โดยสร้างมาจากเงื่อนไขดังนี้ (ห้ามทำการซื้อขายตาม Signal alert เด็ดขาด เพราะเค้าแค่บอกจุดตามเงื่อนไขที่ตั้งไว้ บางทีอาจมีสัญญาณซื้อแล้วให้ซื้อต่อโดยไม่มีสัญญาณขายเลยก็ได้)
Buy : เมื่อ RSI14 ตัดขึ้นที่ค่า 50 พร้อมกับ RSI14 ตัดขึ้น Signal ที่ผมตั้งไว้ (ผมใช้ EMA7 ของ RSI14)
Prepare to Sell : เมื่อ RSI14 ตัดลง Signal ในขณะที่ RSI14 นั้น มีค่ามากกว่า 70
Sell/Short Top : เมื่อ RSI14 ตัดลงที่ค่า 70 พร้อมกับ RSI14 ตัดลง Signal (จะมีขึ้นแสดงว่า Peak ในกราฟ)
Buy : เมื่อ RSI14 ตัดลงที่ค่า 50 พร้อมกับ RSI14 ตัดลง Signal
Prepare to Buy : เมื่อ RSI14 ตัดขึ้น Signal ในขณะที่ RSI14 นั้น มีค่าน้อยกว่า 30
TP Short/Buy Bottom : เมื่อ RSI14 ตัดขึ้นที่ค่า 30 พร้อมกับ RSI14 ตัดขึ้น Signal (จะมีขึ้นแสดงว่า Deep ในกราฟ)
# สาเหตุที่ใส่ข้อความใน Signal alert เพียงแค่ตอน Sell/Short Top และ TP Short/Buy Bottom เพื่อลดโอกาสเกิดการแพนิคที่เกิดจากการสังเกตได้ โดยในสัญญาณตัวอื่นจะมีแค่เครื่องหมาย * เพียงอย่างเดียว
ขอให้โชคดีครับ
Firstssk
////////////////////////////////////////////////////////////////////////////////////////////////////////////////////////////////////////////////////////////////////////////////////
//en (Google Translate)
Hello, Trader
First of all, I have to say that this indicator is built on the basis of a real RSI, just using the EMA27 value to create it, since I still can't write an RSI band that is tied to the price in this section.
But please be patient and listen to me a bit. Since I previously noticed that EMA27 is exactly equal to RSI14 at 50, so I chose to build it with EMA27 because it's easier to write.
Here's how to use it:
This indicator works like RSI14. The reading method is to count the EMA27 line as the 50 value of RSI14, so let's consider the following trading. (After this I will call the created EMA27 RSI band)
Consider buying : When the price breaks the RSI band up and makes a Higher low above the RSI band.
Consider selling : When the price breaks the RSI band down and rebounds to make a Lower high below the RSI band.
# However, I have colored the candlesticks to make them easier to spot. By applying it may remove the color of the candlestick border. Then for the wick part, use a color that does not specify the price plus and minus color #434651
We can see the divergence by comparing the difference between the price and the RSI band as follows.
In a downtrend : Compare the difference between the price and the RSI band of the current Lower Low and the previous Low. If the divergence of the Low continues to decrease until the price approaches the RSI band, consider buying.
In an uptrend : Compare the price difference between the RSI band of the current Higher High and the previous high. If the divergence of the High continues to decrease until the price approaches the RSI band, consider selling.
I have created a Signal alert for easy observation. It was created from the following conditions: (Do not trade according to Signal alert strictly because they just tell the point according to the conditions set There may be a buy signal and then buy again without a sell signal.)
Buy : When RSI14 crosses above 50 with RSI14 crosses up the signal I set (I use EMA7 of RSI14).
Prepare to Sell : When RSI14 crosses signal while RSI14 is greater than 70.
Sell/Short Top : When RSI14 crosses down at 70 with RSI14 crosses down Signal (it will show "Peak" on the chart)
Buy : When RSI14 crosses down to 50 with RSI14 crosses down signal.
Prepare to Buy : When RSI14 crosses signal while RSI14 is less than 30.
TP Short/Buy Bottom : When RSI14 crosses above 30 with RSI14 crosses up signal (it will show "Deep" in the chart).
# The reason why I put the message in Signal alert only at Sell/Short Top and TP Short/Buy Bottom to reduce the chance of panic occurring from observation. In other signals, there will only be a * sign.
Good luck.
Firstssk

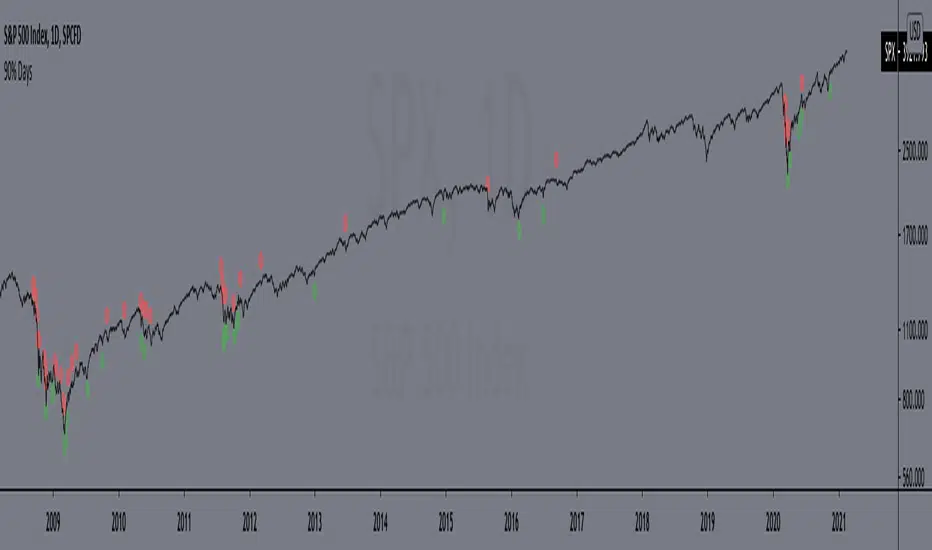
90% DaysIndicator from the paper "IDENTIFYING BEAR MARKET BOTTOMS AND NEW BULL MARKETS"
This paper was the winner of the prestigious 2002 Charles H. Dow Award. Each year the Market Technicians Association, in alliance with Dow Jones and Company, presents an award for excellence in the field of Technical Analysis. The recipient of that award in 2002 was Paul Desmond, President of Lowry Research Corporation.
"Important market bottoms are preceded by, and result from, important market declines.
And, important market declines are, for the most part, a study in the extremes of human emotion.
The intensity of their emotions can be statistically measured through their purchases and sales. To
clarify, as prices initially begin to weaken, investor psychology slowly shifts from complacency to
concern, resulting in increased selling and an acceleration of the decline. As prices drop more
quickly, and the news becomes more negative, the psychology shifts from concern to fear. Sooner
or later, fear turns to panic, driving prices sharply lower, as investors strive to get out of the market
at any price. It is this panic stage that drives prices down to extreme discounts – often well below
book values – that is needed to set the stage for the next bull market. Thus, if an investor had a
method for identifying and measuring panic selling, at least half the job of spotting major market
bottoms would be at hand.
Over the years, a number of market analysts have attempted to define panic selling (often
referred to as a selling climax, or capitulation) in terms of extreme activity, such as unusually
active volume, a massive number of declining stocks, or a large number of new lows. But, those
definitions do not stand up under critical examination, because panic selling must be measured in
terms of intensity, rather than just activity. To formulate our definition of panic selling, we
reviewed the daily history of both the price changes and the volume of trading for every stock
traded on the New York Stock Exchange over a period of 69 years, from 1933 to present. We
broke the volume of trading down into two parts – Upside (buyers) Volume and Downside (sellers)
Volume. We also compiled the full and fractional dollars of price change for all NYSE-listed
stocks that advanced each day (Points Gained), as well as the full and fractional dollars of price
change for all NYSE-listed stocks that declined each day (Points Lost). These four daily totals –
Upside Volume and Points Gained, Downside Volume and Points Lost – represent the basic
components of Demand and Supply, and have been an integral part of the Lowry Analysis since
1938. (Note: an industrious statistician can compile these totals from the NYSE stock tables in
each day’s Wall Street Journal.)
In reviewing these numbers, we found that almost all periods of significant market decline
in the past 69 years have contained at least one, and usually more than one, day of panic selling in
which Downside Volume equaled 90.0% or more of the total of Upside Volume plus Downside
Volume, and Points Lost equaled 90.0% or more of the total of Points Gained plus Points Lost.
...
But, there is a second key ingredient to every major market bottom. It is essential to
recognize that days of panic selling cannot, by themselves, produce a market reversal, any more
than simply lowering the sale price on a house will suddenly produce an enthusiastic buyer. As the
Law of Supply and Demand would emphasize, it takes strong Demand, not just a reduction in
Supply, to cause prices to rise substantially. It does not matter how much prices are discounted; if
investors are not attracted to buy, even at deeply depressed levels, sellers will eventually be forced
to discount prices further still, until Demand is eventually rejuvenated. Thus, our 69-year record
shows that declines containing two or more 90% Downside Days usually persist, on a trend basis,
until investors eventually come rushing back in to snap up what they perceive to be the bargains of
the decade and, in the process, produce a 90% Upside Day (in which Points Gained equal 90.0% or
more of the sum of Points Gained plus Points Lost, and on which Upside Volume equals 90.0% or
more of the sum of Upside plus Downside Volume). These two events – panic selling (one or more
90% Downside Days) and panic buying (a 90% Upside Day, or on rare occasions, two back-toback 80% Upside Days)
– produce very powerful probabilities that a major trend reversal has
begun, and that the market’s Sweet Spot is ready to be savored."
Includes an option to display 90% days for NASDAQ, but these are much rarer and, oddly, there are no Upside Days.
*Includes an option for repainting -- default value is true, meaning the script will repaint the current bar.
False = Not Repainting = Value for the current bar is not repainted, but all past values are offset by 1 bar.
True = Repainting = Value for the current bar is repainted, but all past values are correct and not offset by 1 bar.
In both cases, all of the historical values are correct, it is just a matter of whether you prefer the current bar to be realistically painted and the historical bars offset by 1, or the current bar to be repainted and the historical data to match their respective price bars.
As explained by TradingView,`f_security()` is for coders who want to offer their users a repainting/no-repainting version of the HTF data.
RCI3LinesPanelsRCI 3 lines panels
top / short line / line rising(falling) → bgcolor:green(red)
middle / middle line / line rising(falling) → bgcolor:green(red)
bottom / long line / line rising(falling) → bgcolor:green(red)
all lines rising(falling) → bgcolor: deep green( deep red)
color can be changed / japanese chart color / line rising(falling) → bgcolor:red(blue)

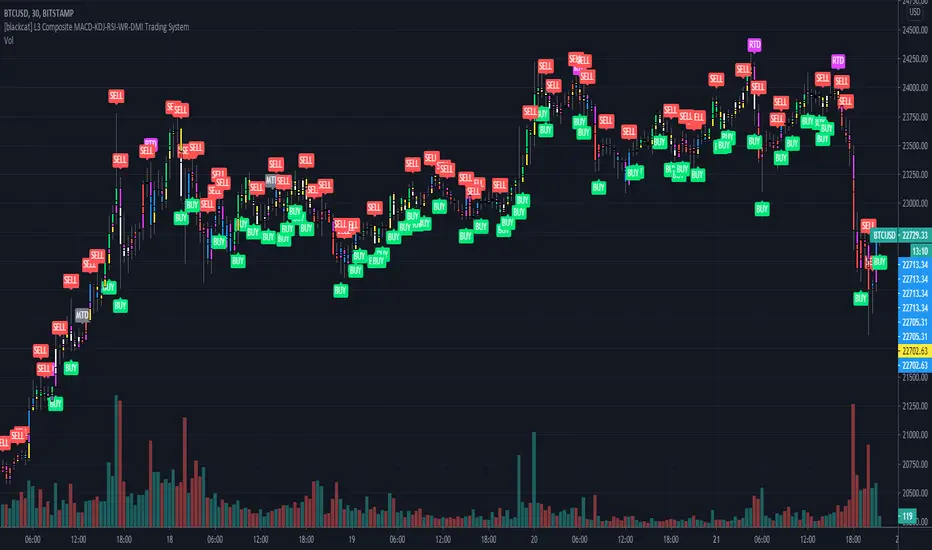
[blackcat] L3 Composite MACD-KDJ-RSI-WR-DMI Trading SystemLevel: 3
Background
The moving average convergence / divergence (MACD) indicator is a pulse oscillator that is mainly used to trade trends. Although it is an oscillator, it is not typically used to identify overbought or oversold conditions. It appears in the diagram as two lines that oscillate without limits. The crossing of the two lines provides trading signals similar to a system with two moving averages.
The KDJ indicator is a technical indicator used to analyze and predict changes in stock performance and the price patterns of a traded asset. The KDJ indicator is also known as the random index. It is a very useful technical indicator that is most commonly used in short term stock market trend analysis. KDJ is a derived form of the Stochastic Oscillator Indicator with the only difference that an additional line is called the J-line. Values of% K and% D indicate whether the security is overbought (over 80) or oversold (under 20). The moments when% K exceeds% D are the moments to sell or buy. The J line represents the deviation of the% D value from% K. The value of J can exceed for the% K and% D lines on the graph.
The Relative Strength Index (RSI) developed by J. Welles Wilder is a pulse oscillator that measures the speed and change of price movements. The RSI hovers between zero and 100. Traditionally, the RSI is considered overbought when it is above 70 and oversold when below 30. Signals can be generated by looking for divergences and error fluctuations.
Williams% R, also known as the Williams Percent Range, is a type of momentum indicator that moves between 0 and -100 and measures overbought and oversold levels. The Williams% R can be used to find entry and exit points in the market. The indicator is very similar to the stochastic oscillator and is used in the same way.
The Directional Movement Index (DMI) is an indicator developed by J. Welles Wilder in 1978 to determine in which direction asset prices are moving. The indicator does this by comparing previous highs and lows and drawing two lines: a positive movement line (+DI) and a negative movement line (-DI). The optional third line is called "Directional Movement (DX)" and it shows the difference between the two lines. When +DI is higher than -DI, the upward pressure on the price is greater than the downward pressure. If -DI is higher than +DI, the price will have greater downward pressure. This indicator can help traders assess the trend direction. Crosses between lines are sometimes used as buying and selling signals.
Function
L3 Composite MACD-KDJ-RSI-WR-DMI Trading System is a simple trading system composed of MACD-KDJ-RSI-WR-DMI together. It can produce 6 types of long entries and 3 types of short entries. It utilizes divergence effect from MACD, KDJ and RSI to detect trend reversal. 6 types of Bottom and top divergence labels are displayed in the chart together with "BUY" and "SELL".
NOTE:In order to make the actual label of the chart more clear, this script does not add stop loss and take profit functions and according labels.
Signal
b1~b3 ---> MACD, KDJ, RSI bottom divergence signal respectively, which hint bull trend may start soon.
d1~d3 ---> MACD, KDJ, RSI top divergence signal respectively, which hint bear trend may start soon.
longentry1~6 ---> with composite indicators together, 6 types of long entry signal are produced.
shortentry1~3 ---> with composite indicators together, 3 types of short entry signal are produced.
Pros and Cons
Pros:
1. excellent open-close, long-short entry signal generation with multiple powerful indicators
2. indicator resonance can help to promote the confidence level of signal and divergence alerts
Cons:
1. integration of multiple indicators is not deeply optimized. fake signal may be produced without filtering schemes
2. no range filter is added
Remarks
To celebrate number of followers exceeds 100. This is my first L3 script published.
Readme
In real life, I am a prolific inventor. I have successfully applied for more than 60 international and regional patents in the past 12 years. But in the past two years or so, I have tried to transfer my creativity to the development of trading strategies. Tradingview is the ideal platform for me. I am selecting and contributing some of the hundreds of scripts to publish in Tradingview community. Welcome everyone to interact with me to discuss these interesting pine scripts.
The scripts posted are categorized into 5 levels according to my efforts or manhours put into these works.
Level 1 : interesting script snippets or distinctive improvement from classic indicators or strategy. Level 1 scripts can usually appear in more complex indicators as a function module or element.
Level 2 : composite indicator/strategy. By selecting or combining several independent or dependent functions or sub indicators in proper way, the composite script exhibits a resonance phenomenon which can filter out noise or fake trading signal to enhance trading confidence level.
Level 3 : comprehensive indicator/strategy. They are simple trading systems based on my strategies. They are commonly containing several or all of entry signal, close signal, stop loss, take profit, re-entry, risk management, and position sizing techniques. Even some interesting fundamental and mass psychological aspects are incorporated.
Level 4 : script snippets or functions that do not disclose source code. Interesting element that can reveal market laws and work as raw material for indicators and strategies. If you find Level 1~2 scripts are helpful, Level 4 is a private version that took me far more efforts to develop.
Level 5 : indicator/strategy that do not disclose source code. private version of Level 3 script with my accumulated script processing skills or a large number of custom functions. I had a private function library built in past two years. Level 5 scripts use many of them to achieve private trading strategy.
RSI2 with alerts by Mr.TuanDoan for Binary OptionIdea was developed from Larry Connors RSI2.
The 2-period RSI strategy is a fairly simple mean-reversion trading strategy designed to buy or sell securities after a corrective period.
You should look for buying opportunities when 2-period RSI moves below Lower Band (5), which is considered deeply oversold. Conversely, you can look for short-selling opportunities when 2-period RSI moves above Upper Band (95).
This is a rather aggressive short-term strategy for Binary Option.
Best use with Stoch RSI x 2.
The settings for Stoch RSI are
- Slow: 3 3 14 14
- Fast: 3 3 5 5
Only consider a PUT/CALL when both Stoch RSI are in the same state (overbought/oversold).
When arrow appears on the candle, it likely reverse the current trend.
Note
This is not a holy-grail.
Please follow your risk management
Confirmations must be met before entering a trade
It's for Binary Option

Grover Llorens Activator Strategy AnalysisThe Grover Llorens Activator is a trailing stop indicator deeply inspired by the parabolic SAR indicator, and aim to provide early exit points and reversal detection. The indicator was posted not so long ago, you can find it here :
Today a strategy using the indicator is proposed, and its profitability is analyzed on 3 different markets with the main time frame being 1 hour, remember that lower time frames involve lower absolute price changes, therefore we are way more affected by the spread, and we can require a larger position sizing depending on our investment target, trading higher time-frames is always a good practice and this is why 1 hour is selected. Based on the result we might make various conclusions regarding the indicator accuracy and might have ideas on future improvements of the indicator.
I'am not great when it comes to strategy design, i still hope to share correct and useful information in this post, let me know your thoughts on the post format and if i should make more of these.
Setup And Rules
The analysis is solely based on the indicator signals, money management isn't taken into account, this allow us to have an idea on the indicator robustness and resilience, particularly on extremely volatile markets and ones exhibiting a chaotic structure, altho it is normally good practice to close any position before a market closure in order to avoid any potential major gaps.
The settings used are 480 for length and 14 for mult, this create relatively mid term signals that are suited for a trend indicator such as the Grover Llorens Activator, unfortunately we can't infer the indicator optimal settings, thats how it is with any technical indicator anyway.
Here are the rules of our strategy :
long : closing price cross over the indicator
short : closing price cross under the indicator
We use constant position sizing, once a signal is triggered all the previous positions are closed.
Description Of The Statistics Used
Various statistics are presented in this post, here is a brief description of the main ones :
Percent Profitability (higher = better): Percentage of winning trades, that is : winning trades/total number of trades × 100
Maximum Drawdown (lower = better) : The highest difference between a peak and a valley in the balance, that is : peak - valley , in percentage : (peak - valley)/peak × 100
Profit Factor (higher = better) : Gross profit divided by gross loss, values under 1 represent gross losses superior to the gross profits
Remember that more volatility = more risk, since higher absolute price changes can logically cause larger losses.
EURUSD
The first market analyzed is the Forex market with the EURUSD major pair with a position sizing of 1000 units (1 micro lot). Since October EURUSD is not showing any particular strong trend but posses a discrete rising motion, fortunately cycles can be observed.
The equity was rising until two trades appeared causing a decline in the equity. Before October a bearish market could be observed.
We can see that the equity is rising, the trend still posses various retracements that affect our indicator, however we can see that the indicator totally nail the end of the trend, thats the power of converging toward the price.
In short :
$ 86.63 net profit
340 closed trades
37.65 % profitable (thats a lot of loosing trades)
1.19 profit factor
$ 76.67 max drawdown
Applying a spread would create negative results (in general the average spread is used), not a great start...
BTCUSD
The cryptocurrency market is relatively more volatile than others, which also mean potentially higher returns, we test the indicator using certainly the most traded cryptocurrency, BTCUSD. We will use a position sizing of 1 unit.
In the case of BTCUSD the strategy balance is relatively stationary around the initial capital, with of course high dispersion.
from september to december the market is bearish with various ranging periods, no apparent cycles can be observed, except maybe in the ranging period of october, this ranging period is followed by a non linear trend (relatively parabolic) that the indicator failed to capture in its integrity (this is a recurrent problem and it is starting to piss me off xD).
In short :
$ 2010.64 net profit (aka how i bet the crypto market)
395 closed trades
38.23 % profitable
1.036 profit factor
$ 5738.01 max drawdown (aka how i lost to the crypto market)
AMD
AMD stand for Advanced Micro Devices and is a company focused on the development of computer technology, i love the microprocessor market and i really like AMD who start this year in a pretty great way with a net bullish trend.
The performance of the indicator on AMD is decent (at last !) with the equity producing many new higher highs. The indicator performance still drop in the middle end of 2019 with a large equity drawdown of 17$ caused by the gap of august 8. Unfortunately AMD, like lot of well behaving stocks can only tells us that the indicator has good performances on heavily trending markets with no excess of noise or chaotic structures.
In short :
$ 17.86 net profit (Enough for a consistent lunch)
295 closed trades
36.27 % profitable
1.414 profit factor
$ 10.37 max drawdown.
Conclusion
A strategy using the recently proposed Grover Llorens activator has been presented. We can easily conclude that the indicator can't possibly generate long term returns under chaotic and volatile markets, and could even produce unnecessary trades in trending markets without much parasitic fluctuations such as noise and retracements (think about a simple linear trend) since the indicator converge toward the price and would therefore automatically cross over/under the trend, thus guaranteeing a false signal.
However we have seen its ability to provide accurate early reversal detection shine from time to time, thus over performing lagging indicators in this aspect, however the duration of price fluctuations isn't fixed at a certain period, the rate of convergence should be way faster during volatile fluctuations, of moderate speed during more cyclic fluctuations, and really slow with apparent long term trends, this could be achieved by making the indicator adaptive, but it won't really make it necessarily perform better.
That said i still believe that converging trend indicators are really interesting and aim to capture the non lasting behavior of price fluctuations, they shouldn't receive so much hate (think about the poor p-sar).
Thanks for reading !

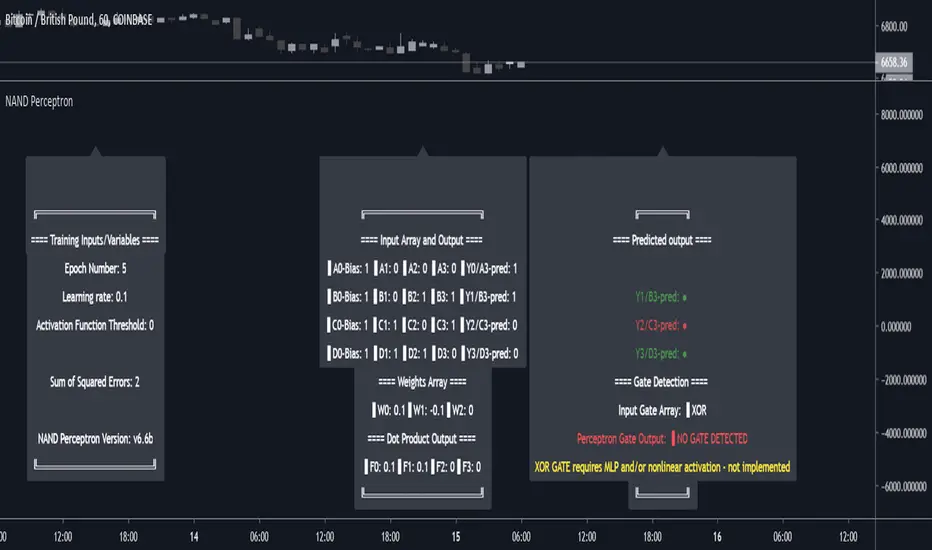
NAND PerceptronExperimental NAND Perceptron based upon Python template that aims to predict NAND Gate Outputs. A Perceptron is one of the foundational building blocks of nearly all advanced Neural Network layers and models for Algo trading and Machine Learning.
The goal behind this script was threefold:
To prove and demonstrate that an ACTUAL working neural net can be implemented in Pine, even if incomplete.
To pave the way for other traders and coders to iterate on this script and push the boundaries of Tradingview strategies and indicators.
To see if a self-contained neural network component for parameter optimization within Pinescript was hypothetically possible.
NOTE: This is a highly experimental proof of concept - this is NOT a ready-made template to include or integrate into existing strategies and indicators, yet (emphasis YET - neural networks have a lot of potential utility and potential when utilized and implemented properly).
Hardcoded NAND Gate outputs with Bias column (X0):
// NAND Gate + X0 Bias and Y-true
// X0 // X1 // X2 // Y
// 1 // 0 // 0 // 1
// 1 // 0 // 1 // 1
// 1 // 1 // 0 // 1
// 1 // 1 // 1 // 0
Column X0 is bias feature/input
Column X1 and X2 are the NAND Gate
Column Y is the y-true values for the NAND gate
yhat is the prediction at that timestep
F0,F1,F2,F3 are the Dot products of the Weights (W0,W1,W2) and the input features (X0,X1,X2)
Learning rate and activation function threshold are enabled by default as input parameters
Uncomment sections for more training iterations/epochs:
Loop optimizations would be amazing to have for a selectable length for training iterations/epochs but I'm not sure if it's possible in Pine with how this script is structured.
Error metrics and loss have not been implemented due to difficulty with script length and iterations vs epochs - I haven't been able to configure the input parameters to successfully predict the right values for all four y-true values for the NAND gate (only been able to get 3/4; If you're able to get all four predictions to be correct, let me know, please).
// //---- REFERENCE for final output
// A3 := 1, y0 true
// B3 := 1, y1 true
// C3 := 1, y2 true
// D3 := 0, y3 true
PLEASE READ: Source article/template and main code reference:
towardsdatascience.com
towardsdatascience.com
towardsdatascience.com
Trade Manager (Open-Source & Non-Standalone Version)Happy Friday everyone
TGIF !!!!!! The weekend for me means no script publishing and enjoying the sun
As a weekday vampire, I'll go out and try to survive the sunlight or I'll prepare the indicators to share for next week. Not sure at this point....
This week, I shared a Trade Manager Trade-Manager-Open-Source-Version/ that you need to get connected to your indicator
Some traders asked if I could give away an alternative version meaning they'll have their own indicator separately and once they'll get their signal, they'll add the Trade Manager to manage their take profits and stop losses. (I'm working for Tradingview charity apparently ^^)
I liked the idea a lot !!! I like it even more that this idea came from followera that I don't even know
How does it work ?
Basically, chose any indicator you want. Once you get your signal/alert, get in the trade with your broker, and add the Trade Manager (Non-Standalone Version) (note the Non-Standalone Version) <=
This is realy important !!
So this was defintively the Trade Manager week... I feel I shared one alternative of that tool a day. (might get banned for copy/pasting myself too much)
Not sure of how I managed it anyway but now let's summarize what you have in your trading toolkit so far :
- Trade Manager to be used DIRECTLY with another indicator : Trade-Manager-Open-Source-Version/
- Trade Manager to be used INDIRECTLY with another indicator : the one I'm sharing right now
- Risk/Reward & PnL & Errors management tool : Risk-Reward-InfoPanel/
If you want to build your own signals in a few clicks only, feel free to share my Algorithm/Strategy builder Strategy-Builder-Crypto-Single-Trend-Plots/
I made it so that you guys can build you own custom signals and then why not, plugging them to the Trade Manager and to the Risk/Reward indicators..... That's now that you're supposed to connect the dots and realizing that all indicators shared this week are deeply linked and powerful when well used together :-)
Wishing y'all a great weekend and see you Monday, well rested and fresh for a new set of indicators
_____________________________________________________________
Feel free to hit the thumbs up as it shows me that I'm not doing this for nothing and will motivate to deliver more quality content in the future. (Meaning... a few likes only = no indicators = Dave enjoying the beach)
Two good news happened this week for me
1) I'm an offically approved PineEditor/LUA/MT4 approved mentor on codementor. You can request a coaching with me if you want and I'll teach you how to build kick-ass indicators and strategies
Jump on a 1 to 1 coaching with me
2) I'm a top author Pine script :)
changes-to-script-publishing-on-tradingview-13462

5 MAs w. alerts [LucF]Is this gazillionth MA indicator worth an addition to the already crowded field of contenders? I say yes! This one shows up to 5 MAs and 6 different marker conditions that can be used to create alerts, among many other goodies.
Features
MAs can be darkened when they are falling.
MAs from another time frame can be displayed, with the option of smoothing them.
Markers can be filtered to Longs or Shorts only.
EMAs can be selected for either all or the two shortest MAs.
The background can be colored using any of the marker states except no. 3.
Markers are:
1. On crosses between any two user-defined MAs,
2. When price is above or below an MA,
3. On Quick Flips (a specific setup involving a cross, multiple MA states and increasing volume, when available),
4. When the difference between two MAs is within a % of its high/low historic values,
5. When an MA has been rising/falling for n bars,
6. When the difference between two MAs is greater than a multiple of ATR.
Some markers use similar visual cues, so distinguishing them will be a challenge if they are used concurrently.
Alerts
Alerts can be created on any combination of alerts. Only non-consecutive instances of markers 5 and 6 will trigger the alert condition. Make sure you are on the interval you want the alert to run at. Using the “Once Per Bar Close” trigger condition is usually the best option.
When an alert is created in TradingView, a snapshot of the indicator’s settings is saved with the alert, which then takes on a life of its own. That is why even though there is only one alert to choose from when you bring up the alert creation dialog box and choose “5 MAs”, that alert can be triggered from any number of conditions. You select those conditions by activating the markers you want the alert to trigger on before creating the alert. If you have selected multiple conditions, then it can be a good idea to record a reminder in the alert’s message field. When the alert triggers, you will need the indicator on the chart to figure out which one of your conditions triggered the alert, as there is currently no way to dynamically change the alert’s message field from within the script.
Background settings will not trigger alerts; only marker configurations.
Notes
MAs are just… averages. Trader lure would have them act as support and resistance levels. I’m not sure about that, and not the only one thinking along these lines. Adam Grimes has studied moving averages in quite a bit of detail. His numbers point to no evidence indicating they act as support/resistance, and to specific MA lengths not being more meaningful than others. His point of view is debated by some—not by me. Mean reversion does not entail that price stops when it reaches its MA; rather, it makes sense to me that price would often more or less oscillate around its MA, which entails the MA does not act as support/resistance. Aren’t the best mean reversion opportunities when price is furthest away from its MA? If so, it should be more profitable to identify these areas, which some of this indicator’s markers try to do.
I think MAs can be much more powerful when thought of as instruments we can use to situate price events in contexts of various resolutions, from the instantaneous to the big picture. Accordingly, I use the relative positions and slopes of MAs in both discretionary and automated trading; but never their purported ability to support/resist.
Regardless of how you use MAs, I hope you will find this indicator useful.
Biased References
The Art and Science of Technical Analysis: Market Structure, Price Action, and Trading Strategies, Adam Grimes, 2012.
Does the 200 day moving average “work”?
Moving averages: digging deeper

Z-Score Trend Channels [BackQuant]Z-Score Trend Channels
A self-contained price-statistics framework that turns a rolling z-score into price channels, bias states, and trade markers. Run either trend-following or mean-reversion from the same tool with clear, on-chart context.
What it is
A rolling statistical map that measures how far price is from its recent average in standard-deviation units (z-score).
Adaptive channels drawn in price space from fixed z thresholds, so the rails breathe with volatility.
A simple trend proxy from z-score momentum to separate trending from ranging conditions.
On-chart signals for pullback entries, stretched extremes, and practical exits.
Core idea (plain English math)
Rolling mean and volatility - Over a lookback you get the average price and its standard deviation.
Z-score - How many standard deviations the current price is above or below its average: z = (price - mean) / stdev. z near 0 means near average; positive is above; negative is below.
Noise control - An EMA smooths the raw z to reduce jitter and false flickers.
Channels back in price - Fixed z levels are converted back to price to form the upper, lower, and extreme rails.
Trend proxy - A smoothed change in z is used as a lightweight trend-strength line. Positive strength with positive z favors uptrend; negative strength with negative z favors downtrend.
What you see on the chart
Channels and fills - Mean, upper, lower, and optional extreme lines. The area mean->upper tints with the bearish color, mean->lower tints with the bullish color.
Background tint (optional) - Soft green, red, or neutral based on detected trend state.
Signals - Bullish Entry (triangle up) when z exits the oversold zone upward; Bearish Entry (triangle down) when z exits the overbought zone downward; Extreme markers (diamonds) at the extreme bands with a one-bar turn.
Table - Current z, trend state, trend strength, distance to bands, market state tag, and a quick volatility regime label.
Edge labels - MEAN, OB, and OS labels slightly projected forward with level values.
Inputs you will actually use
Z-Score Period - Lookback for mean and stdev. Larger = slower and steadier rails, smaller = more reactive.
Smoothing Period - EMA on z. Lower = earlier but choppier flips; higher = later but cleaner.
Price Source - Default hlc3. Choose close if you prefer session-close logic.
Upper and Lower Thresholds - Default around +2.0 and -2.0. Tighten for more signals, widen for fewer and stronger.
Extreme Upper and Lower - Deeper stretch guards, e.g., +/- 2.5.
Strength Period - EMA on z momentum. Sets how fast the trend proxy flips.
Trend Threshold - Minimum absolute z to accept a directional bias.
Visual toggles - Channels, signals, background tint, stats table, colors, and optional last-bar trend label.
How to use it: trend-following playbook
Read the state - Uptrend when z > Trend Threshold and trend strength > 0. Downtrend when z < -Trend Threshold and trend strength < 0. Neutral otherwise.
Entries - In an uptrend, prefer Bullish Entry signals that fire near the lower channel. In a downtrend, prefer Bearish Entry signals that fire near the upper channel.
Stops - Conservative: beyond the extreme channel on your side. Tighter: just outside the standard band that framed the signal.
Exits - For longs, exit or trim on a cross back through z = 0 or a clean tag of the upper threshold. For shorts, mirror with z = 0 up-cross or tag of the lower threshold. You can also reduce if trend strength flips against you.
Adds - In strong trends, additional signals near your side’s band can be add points. Avoid adding once z hovers near the opposite band for several bars.
How to use it: mean-reversion playbook
Find stretch - Standard reversions: Bullish Entry when z leaves the oversold zone upward; Bearish Entry when z leaves the overbought zone downward. Aggressive reversions: Extreme markers at extreme bands with a one-bar turn.
Entries - Take the signal as price exits the zone. Prefer setups where trend strength is near zero or tilting against the prior push.
Targets - First target is the mean line. A runner can aim for the opposite standard channel if momentum keeps flipping.
Stops - Outside the extreme band beyond your entry. If fading without extremes, place risk just beyond the opposite standard band.
Filters - Optional: skip counter-trend fades against a very strong trend state unless your risk is tight and predefined.
Reading the stats table
Current Z-Score - Magnitude and sign of displacement now.
Trend State - Uptrend, Downtrend, or Ranging.
Trend Strength - Smoothed z momentum. Higher absolute values imply stronger directional conviction.
Distance to Upper/Lower - Percent distance from price to each band, useful for sizing targets or judging room left.
Market State - Overbought, Oversold, Extreme OB, Extreme OS, or Normal.
Volatility Regime - High, Normal, or Low relative to recent distribution. Expect bands to widen in High and tighten in Low.
Parameter guidance (conceptual)
Z-Score Period - Choose longer for a structural mean, shorter for a reactive mean.
Smoothing Period - Lower for earlier but noisier reads; higher for slower but steadier reads.
Thresholds - Start around +/- 2.0. Tighten for scalping or quiet ranges. Widen for noisy or fast markets.
Trend Threshold and Strength Period - Raise to avoid weak, transient bias. Lower to capture earlier regime shifts.
Practical examples
Trend pullback long - State shows Uptrend. Price tests the lower channel; z dips near or below the lower threshold; a Bullish Entry prints. Stop just below extreme lower; first target mean; keep a runner if trend strength stays positive.
Mean-revert short - State is Ranging. z tags the extreme upper, an Extreme Bearish marker prints, then a Bearish Entry prints on the leave. Stop above extreme upper; target the mean; consider a runner toward the lower channel if strength turns negative.
Potential Questions you might have
Why z-score instead of fixed offsets - Because the bands adapt with volatility. When the tape gets quiet the rails tighten, when it runs hot the rails expand. Your entries stay normalized.
Do I need both modes - No. Many users run only trend pullbacks or only mean-reversions. The tool lets you toggle what you need and keep the chart readable.
Multi-timeframe workflow - A common approach is to set bias from a higher timeframe’s trend state and execute on a lower timeframe’s signals that align with it.
Summary
Z-Score Trend Channels gives you an adaptive mean, volatility-aware rails, a simple trend lens, and clear signals. Trade the trend by buying pullbacks in green and selling pullbacks in red, or fade stretched extremes back to the mean with defined risk. One framework, two strategies, consistent logic.

❄️ Lin Kuei Systematic Edge ❄️# ❄️ Lin Kuei Systematic Edge - Complete Trading Indicator
## 🎯 **What is the Lin Kuei Systematic Edge?**
The Lin Kuei Systematic Edge is a professional-grade trading indicator designed to eliminate emotional trading and provide systematic, disciplined market analysis. Inspired by the ice-cold precision of systematic trading, this indicator combines multiple technical analysis components to deliver clear, actionable signals for both trending and volatile market conditions.
## 🗡️ **Core Components**
### **1. Dual-Blade System (Moving Averages)**
- **Fast Blade (Ice Blade)**: Quick-responding moving average for trend detection
- **Slow Blade (Frost Shield)**: Stable moving average for trend confirmation
- **Crossover Signals**: When fast blade crosses above slow blade = LONG signal | When fast blade crosses below slow blade = SHORT signal
### **2. Ice Zone (Volatility Bands)**
- **Upper Frost**: Resistance level based on volatility
- **Lower Frost**: Support level based on volatility
- **Dynamic Zones**: The area between frost levels shows market sentiment
- **Ice Multiplier**: Controls the width of the volatility bands (default: 2.215)
### **3. Market Regime Detection**
- **Bullish Regime**: Fast blade > Slow blade with positive momentum
- **Bearish Regime**: Fast blade < Slow blade with negative momentum
- **Consolidation**: Low momentum, sideways market movement
### **4. Volatility Filtering**
- **High Volatility Filter**: Blocks signals during chaotic market conditions
- **Signal Quality**: Only generates signals when market volatility is manageable
- **Systematic Discipline**: Prevents emotional trading during market storms
## 📊 **How to Read the Indicator**
### **Visual Elements:**
- **Cyan Ice Blade**: Fast-moving trend line with glow effect
- **Blue Frost Shield**: Slower trend line with aura
- **White Frost Barriers**: Support and resistance levels with colored glows
- **Dynamic Fill Zones**: Green tint (bullish) / Red tint (bearish) between barriers
- **Signal Triangles**: Green up-arrow (LONG) / Red down-arrow (SHORT)
### **Information Dashboard:**
The tactical table provides real-time market intelligence:
1. **🗡️ Momentum**: Percentage difference between fast and slow blades
- **Positive**: Bullish momentum (green)
- **Negative**: Bearish momentum (red)
- **Strength**: STRONG (>2% or <-2%) vs WEAK
2. **🌪️ Volatility**: Percentile ranking of current volatility
- **0-50%**: LOW (green) - Ideal for signals
- **50-80%**: HIGH (orange) - Caution advised
- **80-100%**: EXTREME (red) - Signals blocked
3. **📊 Position**: Price location within the ice zone
- **80-100%**: OVERBOUGHT (red) - Near resistance
- **0-20%**: OVERSOLD (green) - Near support
- **20-80%**: NEUTRAL (white) - Normal range
4. **⚔️ Regime**: Current market condition
- **BULL**: Uptrend active - STRIKE mode
- **BEAR**: Downtrend active - DEFEND mode
- **RANGE**: Sideways - WAIT mode
5. **🎯 Signal**: Latest signal status
- **BUY/SELL**: Active signal generated
- **NONE**: No current signal
- **ACTIVE/BLOCKED**: Signal availability status
6. **❄️ Ice Status**: Price relationship to frost barriers
- **FROZEN**: Below lower frost (oversold opportunity)
- **SOLID**: Within normal range
- **MELTING**: Above upper frost (overbought warning)
7. **🛡️ Defense**: Signal reliability assessment
- **STRONG**: Low volatility, high signal quality
- **WEAK**: High volatility, signals may be unreliable
## 🎯 **Trading Signals**
### **LONG Signals (Green Triangle Up)**
**Generated when:**
- Fast blade crosses ABOVE slow blade
- Momentum turns positive
- Volatility is NOT extreme (< 70th percentile)
**Interpretation:**
- Bullish momentum confirmed
- Trend reversal to upside
- Entry opportunity for long positions
### **SHORT Signals (Red Triangle Down)**
**Generated when:**
- Fast blade crosses BELOW slow blade
- Momentum turns negative
- Volatility is NOT extreme (< 70th percentile)
**Interpretation:**
- Bearish momentum confirmed
- Trend reversal to downside
- Entry opportunity for short positions
### **Signal Quality Assurance:**
- **Volatility Filter**: No signals during market chaos
- **Momentum Confirmation**: Requires actual trend change
- **Clean Presentation**: Optional L/S text labels for clarity
## 🧊 **Background Zones**
### **🔥 Melting Ice Zone (Green Background)**
- Price above upper frost + low volatility
- Potential overheating/overbought condition
- Caution: Possible reversal area
### **🧊 Deep Freeze Zone (Red Background)**
- Price below lower frost + low volatility
- Potential oversold/opportunity zone
- Watch for: Possible bounce/recovery
### **🌨️ Ice Blizzard (White Background)**
- High volatility detected
- Market chaos/uncertainty
- Action: Wait for clarity, no signals generated
## ⚙️ **Customizable Settings**
### **Blade Configuration:**
- **Blade Type**: SMA, EMA, WMA, VWMA, HMA, RMA
- **Fast Precision**: 1-100 periods (default: 40)
- **Slow Defense**: 1-200 periods (default: 55)
### **Volatility Control:**
- **Ice Multiplier**: 0.1+ (default: 2.215)
- **Controls**: Width of support/resistance zones
### **Alert System:**
- **Battle Alerts**: Enable/disable notifications
- **Signal Text**: Show/hide L/S labels on signals
## 🎖️ **Best Practices**
### **When to Use:**
- Trending markets with clear direction
- After consolidation periods
- When volatility is manageable
- For systematic, emotion-free trading
### **When to Avoid:**
- During extreme volatility (blizzard conditions)
- Major news events/announcements
- Very low timeframes with excessive noise
- Without proper risk management
### **Optimal Timeframes:**
- **15min - 1H**: Short-term trading
- **4H - 1D**: Medium-term analysis
- **1D+**: Long-term trend identification
## 🏆 **Scoring System**
### **Positive Scores (+):**
- **Momentum > 0**: Bullish trend strength
- **Volatility < 50%**: Stable, predictable conditions
- **Position 20-80%**: Normal, healthy price action
- **Regime = BULL**: Confirmed uptrend
- **Defense = STRONG**: High signal reliability
### **Negative Scores (-):**
- **Momentum < 0**: Bearish trend strength
- **Volatility > 70%**: Chaotic, unpredictable conditions
- **Position > 80% or < 20%**: Extreme overbought/oversold
- **Regime = BEAR**: Confirmed downtrend
- **Ice Status = MELTING**: Overheated conditions
### **Overall Assessment:**
The indicator provides a **holistic scoring system** where multiple positive factors align for high-confidence signals, while negative factors warn of risks or suggest defensive positioning.
---
## 🔮 **Summary**
The Lin Kuei Systematic Edge transforms emotional trading into disciplined, systematic analysis. By combining trend detection, volatility analysis, and market regime identification, it provides traders with the tools needed to navigate markets with ice-cold precision. The indicator's strength lies in its ability to filter out noise, prevent overtrading during volatile periods, and deliver clear, actionable signals when conditions are optimal.
**"In crypto winter, only the systematic survive. Precision over emotion."** ❄️

TEWMA Supertrend - [JTCAPITAL]TEWMA Supertrend - is a modified way to use Triple Exponential Weighted Moving Average (TEWMA) combined with ATR-based Supertrend logic for Trend-Following.
The idea behind this indicator is to merge the smoothness and responsiveness of TEWMA with the robustness of ATR-based Supertrend volatility filtering. This results in a tool that not only reacts quickly to price changes but also adapts to market volatility, providing reliable trend detection with reduced noise.
The indicator works by calculating in the following steps:
Source Selection
The user can select the price source (default is Close). This price series is the foundation of all calculations, and changing the source allows the indicator to adapt to different analytical perspectives, such as Open, High, Low, or HL2.
TEWMA Calculation
The script calculates a Weighted Moving Average (WMA) of the selected source, and then applies a Triple Exponential Moving Average (TEMA) smoothing on top of it. The result is what we call TEWMA. This hybrid method achieves two goals simultaneously:
-WMA adds sensitivity by giving more weight to recent data.
-TEMA reduces lag by combining multiple EMA calculations while keeping smoothness.
ATR Volatility Measurement
In parallel, the Average True Range (ATR) is calculated over the user-defined Supertrend length . ATR measures volatility and dynamically scales the upper and lower bands to adjust to different market conditions.
Upper and Lower Band Construction
The indicator builds two envelopes around the TEWMA:
- Upper Band = TEWMA + (Multiplier × ATR)
- Lower Band = TEWMA – (Multiplier × ATR)
These bands expand and contract depending on volatility, creating a dynamic channel.
Band Adjustment Logic
To prevent false flips, the current upper/lower band values are compared to their previous values. If price has not broken above or below the prior band, the bands “stick” to their previous values, thereby filtering noise and avoiding unnecessary trend changes.
Trend Detection
-If price closes above the adjusted upper band, the direction is bullish.
-If price closes below the adjusted lower band, the direction is bearish.
-Otherwise, the trend direction continues from its prior state.
The Trend line is then set to either the upper band (bearish) or lower band (bullish).
Visual Representation
-The TEWMA line itself is plotted and color-coded (blue for bullish, purple for bearish).
-The active Supertrend line is plotted depending on trend direction.
-Shaded regions are added around the lines for enhanced clarity, visually separating bullish and bearish phases.
Buy and Sell Conditions :
- Buy Signal : Triggered when price closes above the Supertrend line, confirming a bullish shift.
- Sell Signal : Triggered when price closes below the Supertrend line, confirming a bearish shift.
Features and Parameters :
- TEWMA Source – Select the input price (Close, Open, High, Low, etc.).
- TEWMA Length – Defines the lookback for the Weighted MA and subsequent TEMA smoothing.
- Supertrend Length – Defines the ATR period used for volatility measurement.
- Multiplier – Determines how far the Supertrend bands are placed from the TEWMA. Higher values mean wider bands and fewer trend flips, while lower values mean tighter bands and more frequent signals.
Specifications :
Weighted Moving Average (WMA)
The WMA gives more importance to recent price points while still considering past values. This makes it more responsive to recent moves than a Simple Moving Average (SMA).
Triple Exponential Moving Average (TEMA)
TEMA reduces lag by combining multiple layers of EMA calculations. Unlike a simple EMA, which can be slow to react, TEMA anticipates changes faster, while still maintaining smoothness to avoid false signals.
TEWMA (TEMA of WMA)
By applying TEMA on top of WMA, we create a hybrid smoothing technique. This retains the responsiveness of WMA but reduces its lag via TEMA’s structure. The result is a highly adaptive moving average, ideal for fast trend detection.
Average True Range (ATR)
ATR measures the degree of volatility by looking at the full trading range of each candle. It ensures that the Supertrend bands expand in volatile markets and contract in calm markets, keeping signals relevant to current conditions.
Supertrend Bands
The upper and lower envelopes built around TEWMA act as dynamic support and resistance. Their adaptive nature reduces false trend shifts during choppy sideways markets.
Band Adjustment Logic
Instead of recalculating bands every candle, the script uses a memory mechanism (previous values) to prevent unnecessary trend switches. This stabilizes the indicator and avoids excessive noise.
Trend Line
The final output is a line that follows price in trending phases while holding steady during consolidations. Its placement above or below price clearly signals bullish or bearish market structure.
Color Coding and Visuals
The use of shaded fills and line coloring enhances readability. Traders can quickly distinguish trend direction and momentum without deep numerical analysis.
Enjoy!

Volume-Weighted RSI & Multi-Normalized MACD### Description for Publishing: Volume-Weighted RSI & Multi-Normalized MACD
**Overview**
The "Volume-Weighted RSI & Multi-Normalized MACD" indicator is a powerful and versatile tool designed for traders seeking enhanced momentum and trend analysis. Combining a volume-weighted Relative Strength Index (VW-RSI) with a customizable Moving Average Convergence Divergence (MACD) featuring multiple normalization methods, this indicator provides deep insights into market dynamics. It supports multi-timeframe (MTF) analysis and includes an optional stepped plotting mode for discrete signal visualization, making it ideal for both trend-following and mean-reversion strategies across various markets (stocks, forex, crypto, etc.).
**Key Features**
1. **Volume-Weighted RSI (VW-RSI)**:
- A modified RSI that incorporates trading volume for greater sensitivity to market activity.
- Normalized to a user-defined range (default: -50 to +50) for consistent analysis.
- Optional smoothing with multiple moving average types (SMA, EMA, WMA, VWMA, SMMA, or SMA with Bollinger Bands) to reduce noise and highlight trends.
- Overbought (+20) and oversold (-20) levels for quick reference.
2. **Multi-Normalized MACD**:
- Offers six normalization methods for MACD, allowing traders to tailor the output to their strategy:
- Normalized Volume Weighted MACD (unbounded).
- Min-Max Normalization (bounded).
- Volatility Normalization (unbounded, volatility-adjusted).
- Volatility Normalization with Min-Max (bounded).
- Hyperbolic Tangent Normalization (bounded).
- Arctangent Normalization (bounded).
- Min-Max with Smoothing (bounded).
- All bounded methods scale to the user-defined range (default: -50 to +50), ensuring comparability with VW-RSI.
- Dynamic color changes for MACD line (lime/red) and histogram (aqua/blue/red/maroon) based on momentum and signal line crosses.
3. **Stepped Plotting Mode**:
- Optional mode to plot RSI and MACD as discrete, stepped lines, reducing noise by only updating when values change significantly (configurable thresholds).
- Ideal for traders focusing on clear, actionable signal changes.
4. **Multi-Timeframe Support**:
- Configurable timeframe input (default: chart timeframe) for analyzing RSI and MACD on higher or lower timeframes, enhancing cross-timeframe strategies.
5. **Customizable Display**:
- Toggle options to show/hide MACD line, signal line, histogram, and cross dots.
- Bollinger Bands for RSI smoothing (optional) with adjustable standard deviation multiplier.
- Clear visual cues with horizontal lines for overbought/oversold levels, midline, and MACD bounds.
**Usage Instructions**
1. **Add to Chart**: Apply the indicator to any symbol (e.g., BTCUSD, SPY) on any timeframe (1H, 1D, etc.).
2. **Configure Settings**:
- **General**: Adjust `Lower Bound` (-50 default) and `Upper Bound` (+50 default) for the output range. Set `Timeframe` for MTF analysis. Enable `Stepped?` for discrete plotting.
- **RSI**: Choose `Price Source` (default: ohlc4), `RSI Length` (default: 9), and smoothing options (e.g., EMA, Bollinger Bands). Adjust `RSI Diff Threshold` for stepped mode.
- **MACD**: Select `Price Source`, `Fast Length` (9), `Slow Length` (21), `Signal Length` (9), and a normalization method (default: Volatility Min-Max). Adjust `MACD Diff Threshold` for stepped mode.
- **Display Options**: Toggle MACD components and histogram colors for clarity.
3. **Interpretation**:
- **VW-RSI**: Watch for crosses above +20 (overbought) or below -20 (oversold) for potential reversals. Use smoothed RSI or Bollinger Bands for trend confirmation.
- **MACD**: Look for MACD/Signal line crosses (dots indicate crossings) and histogram changes for momentum shifts. Bounded normalizations align with RSI for unified analysis.
- **Stepped Mode**: Focus on significant changes in RSI/MACD for clearer signals.
4. **Companion Overlay**: For visualization on the main price chart, use the companion script "VW-RSI & MACD Price Overlay" (available separately, requires this script to be published). It plots RSI and MACD as price-scaled echo lines, with toggles to show/hide and customizable scaling (high/low or ATR).
**Who Is This For?**
- **Trend Traders**: Use MACD normalizations and MTF to identify momentum shifts across timeframes.
- **Mean-Reversion Traders**: Leverage VW-RSI’s overbought/oversold signals for entry/exit points.
- **Technical Analysts**: Customize normalization and smoothing to match specific market conditions.
- **All Markets**: Works on stocks, forex, cryptocurrencies, and more, with any timeframe.
**Notes**
- Unbounded MACD normalizations (`enable_nvw`, `enable_vol`) may produce values outside -50/+50, suitable for volatility-focused strategies.
- For price chart overlay, publish this script and use its ID in the companion script’s `request.security` call.
- Adjust scaling inputs in the companion script for optimal visualization on volatile or stable assets.
**Author’s Note**
Developed by NEPOLIX, this indicator combines volume-weighted precision with flexible normalization for robust technical analysis. Feedback and suggestions are welcome to enhance future versions!

350DMA bands + Z-score (V2)This script extends the classic 350-day moving average (350DMA) by building dynamic valuation bands and a Z-Score framework to evaluate how far price deviates from its long-term mean.
Features
350DMA Anchor: Uses the 350-day simple moving average as the baseline reference.
Fixed Multipliers: Key bands plotted at ×0.625, ×1.0, ×1.6, ×2.0, and ×2.5 of the 350DMA — historically significant levels for cycle analysis.
Z-Score Mapping: Price is converted into a Z-Score on a scale from +2 (deep undervaluation) to –2 (extreme overvaluation), using log-space interpolation for accuracy.
Custom Display: HUD panel and on-chart label show the current Z-Score in real time.
Clamp Option: Users can toggle between raw Z values or capped values (±2).
How to Use
Valuation Context: The 350DMA is often considered a “fair value” anchor; large deviations identify cycles of under- or over-valuation.
Z-Score Insight:
Positive Z values suggest favorable accumulation zones where price is below long-term average.
Negative Z values highlight zones of stretched valuation, often associated with distribution or profit-taking.
Strategic Application: This is not a standalone trading system — it works best in confluence with other indicators, cycle models, or macro analysis.
Originality
Unlike a simple DMA overlay, this script:
Provides multiple cycle-based bands derived from the 350DMA.
Applies a logarithmic Z-Score mapping for more precise long-term scaling.
Adds an integrated HUD and labeling system for quick interpretation.

triple Keltner Channels with Z-Score V2This script expands on the classic Keltner Channel by plotting three adaptive volatility bands around an EMA baseline and introducing a dynamic Z-Score calculation to quantify price positioning within or beyond those bands.
Features
Three Keltner Channels:
Inner Channel at ×2 ATR
Outer Channel at ×3 ATR
Extended Channel at ×3.5 ATR
Customizable Inputs: EMA length, ATR length, and multipliers can be adjusted to suit different market conditions or asset volatility.
Z-Score Integration: Converts price location relative to the channels into standardized scores (from +2.5 to –2.5). Positive Z indicate a good value/zone to buy while negative one is the contrary (do not use it alone, use it with other indicators )
This provides a statistical lens for identifying overextended, neutral, or mean-reverting conditions.
Visual Clarity: Channel fills highlight volatility zones, while an on-chart label dynamically displays the current Z-Score.
How to Use
Overbought/Oversold Signals: Extreme Z-Score readings (±2 and beyond) suggest stretched conditions that often precede pullbacks or reversions.
Mean Reversion vs Breakout: Traders can assess whether price is likely to revert to the mean (EMA) or sustain momentum beyond outer bands.
Originality
Unlike a standard Keltner Channel, this one:
Uses three progressively wider ATR multiples for deeper volatility mapping.
Adds a Z-Score framework to statistically measure price displacement.
Provides a visual + numerical hybrid output (bands + live Z-Score label).
use only on 1W timeframe

VOLUME Full [Titans_Invest]VOLUME Full
Designed for traders who want to take volume analysis to the next level.
This version delivers deeper insight into volume activity, integrating multiple customizable filters to highlight key buying and selling pressure. It's a comprehensive solution for volume-based decision-making.
⯁ WHAT IS THE VOLUME❓
The Volume indicator is a fundamental technical analysis tool that measures the number of shares or contracts traded in a security or market during a given period. It helps traders and investors understand the strength or weakness of a price movement, confirm trends, and predict potential reversals. Volume is typically displayed as a histogram below a price chart, with each bar representing the volume traded during a specific time interval.
⯁ HOW TO USE THE VOLUME❓
The Volume indicator can be used in several ways to enhance trading decisions:
• Trend Confirmation: High volume during a price move confirms the strength of that trend, while low volume can indicate a weak or unsustainable trend.
• Breakouts: A price breakout from a pattern or range accompanied by high volume is more likely to be valid and sustainable.
• Divergence: When the price moves in one direction and volume moves in the opposite direction, it can signal a potential reversal.
• Overbought/Oversold Conditions: Extreme volume levels can sometimes indicate that an asset is overbought or oversold, though this is less straightforward than with oscillators like the RSI.
⯁ ENTRY CONDITIONS
The conditions below are fully flexible and allow for complete customization of the signal.
______________________________________________________
🔹 CONDITIONS TO BUY 📈
______________________________________________________
▪︎ Signal Validity: The signal will remain valid for X bars .
▪︎ Signal Sequence: Configurable as AND or OR .
🔹 volume Positive
🔹 volume Negative
🔹 volume > volume
🔹 volume < volume
🔹 volume > volume_MA
🔹 volume > volume_MA * Trigger Signal (close > open)
🔹 volume > volume_MA * Trigger Signal (Keep State P)
🔹 volume > volume_MA * Trigger Signal (close < open)
🔹 volume > volume_MA * Trigger Signal (Keep State N)
______________________________________________________
______________________________________________________
🔸 CONDITIONS TO SELL 📉
______________________________________________________
▪︎ Signal Validity: The signal will remain valid for X bars .
▪︎ Signal Sequence: Configurable as AND or OR .
🔸 volume Positive
🔸 volume Negative
🔸 volume > volume
🔸 volume < volume
🔸 volume > volume_MA
🔸 volume > volume_MA * Trigger Signal (close > open)
🔸 volume > volume_MA * Trigger Signal (Keep State P)
🔸 volume > volume_MA * Trigger Signal (close < open)
🔸 volume > volume_MA * Trigger Signal (Keep State N)
______________________________________________________
______________________________________________________
🤖 AUTOMATION 🤖
• You can automate the BUY and SELL signals of this indicator.
______________________________________________________
______________________________________________________
⯁ UNIQUE FEATURES
______________________________________________________
Signal Validity: The signal will remain valid for X bars
Signal Sequence: Configurable as AND/OR
Condition Table: BUY/SELL
Condition Labels: BUY/SELL
Plot Labels in the Graph Above: BUY/SELL
Displays Positive & Negative Volume.
Automate and Monitor Signals/Alerts: BUY/SELL
Signal Validity: The signal will remain valid for X bars
Signal Sequence: Configurable as AND/OR
Table of Conditions: BUY/SELL
Conditions Label: BUY/SELL
Plot Labels in the graph above: BUY/SELL
Displays Positive & Negative Volume.
Automate & Monitor Signals/Alerts: BUY/SELL
______________________________________________________
📜 SCRIPT : VOLUME Full
🎴 Art by : @Titans_Invest & @DiFlip
👨💻 Dev by : @Titans_Invest & @DiFlip
🎑 Titans Invest — The Wizards Without Gloves 🧤
✨ Enjoy!
______________________________________________________
o Mission 🗺
• Inspire Traders to manifest Magic in the Market.
o Vision 𐓏
• To elevate collective Energy 𐓷𐓏

The Best Strategy Template[LuciTech]Hello Traders,
This is a powerful and flexible strategy template designed to help you create, backtest, and deploy your own custom trading strategies. This template is not a ready-to-use strategy but a framework that simplifies the development process by providing a wide range of pre-built features and functionalities.
What It Does
The LuciTech Strategy Template provides a robust foundation for building your own automated trading strategies. It includes a comprehensive set of features that are essential for any serious trading strategy, allowing you to focus on your unique trading logic without having to code everything from scratch.
Key Features
The LuciTech Strategy Template integrates several powerful features to enhance your strategy development:
•
Advanced Risk Management: This includes robust controls for defining your Risk Percentage per Trade, setting a precise Risk-to-Reward Ratio, and implementing an intelligent Breakeven Stop-Loss mechanism that automatically adjusts your stop to the entry price once a specified profit threshold is reached. These elements are crucial for capital preservation and consistent profitability.
•
Flexible Stop-Loss Options: The template offers adaptable stop-loss calculation methods, allowing you to choose between ATR-Based Stop-Loss, which dynamically adjusts to market volatility, and Candle-Based Stop-Loss, which uses structural price points from previous candles. This flexibility ensures the stop-loss strategy aligns with diverse trading styles.
•
Time-Based Filtering: Optimize your strategy's performance by restricting trading activity to specific hours of the day. This feature allows you to avoid unfavorable market conditions or focus on periods of higher liquidity and volatility relevant to your strategy.
•
Customizable Webhook Alerts: Stay informed with advanced notification capabilities. The template supports sending detailed webhook alerts in various JSON formats (Standard, Telegram, Concise Telegram) to external platforms, facilitating real-time monitoring and potential integration with automated trading systems.
•
Comprehensive Visual Customization: Enhance your analytical clarity with extensive visual options. You can customize the colors of entry, stop-loss, and take-profit lines, and effectively visualize market inefficiencies by displaying and customizing Fair Value Gap (FVG) boxes directly on your chart.
How It Does It
The LuciTech Strategy Template is meticulously crafted using Pine Script, TradingView's powerful and expressive programming language. The underlying architecture is designed for clarity and modularity, allowing for straightforward integration of your unique trading signals. At its core, the template operates by taking user-defined entry and exit conditions and then applying a sophisticated layer of risk management, position sizing, and trade execution logic.
For instance, when a longCondition or shortCondition is met, the template dynamically calculates the appropriate position size. This calculation is based on your specified risk_percent of equity and the stop_distance (the distance between your entry price and the calculated stop-loss level). This ensures that each trade adheres to your predefined risk parameters, a critical component of disciplined trading.
The flexibility in stop-loss calculation is achieved through a switch statement that evaluates the sl_type input. Whether you choose an ATR-based stop, which adapts to market volatility, or a candle-based stop, which uses structural price points, the template seamlessly integrates these methods. The ATR calculation itself is further refined by allowing various smoothing methods (RMA, SMA, EMA, WMA), providing granular control over how volatility is measured.
Time-based filtering is implemented by comparing the current bar's time with user-defined start_hour, start_minute, end_hour, and end_minute inputs. This allows the strategy to activate or deactivate trading during specific market sessions or periods of the day, a valuable tool for optimizing performance and avoiding unfavorable conditions.
Furthermore, the template incorporates advanced webhook alert functionality. When a trade is executed, a customizable JSON message is formatted based on your webhook_format selection (Standard, Telegram, or Concise Telegram) and sent via alert function. This enables seamless integration with external services for real-time notifications or even automated trade execution through third-party platforms.
Visual feedback is paramount for understanding strategy behavior. The template utilizes plot and fill functions to clearly display entry prices, stop-loss levels, and take-profit targets directly on the chart. Customizable colors for these elements, along with dedicated options for Fair Value Gap (FVG) boxes, enhance the visual analysis during backtesting and live trading, making it easier to interpret the strategy's actions.
How It's Original
The LuciTech Strategy Template distinguishes itself in the crowded landscape of TradingView scripts through its unique combination of integrated, advanced risk management features, highly flexible stop-loss methodologies, and sophisticated alerting capabilities, all within a user-friendly and modular framework. While many templates offer basic entry/exit signal integration, LuciTech goes several steps further by providing a robust, ready-to-use infrastructure for managing the entire trade lifecycle once a signal is generated.
Unlike templates that might require users to piece together various risk management components or code complex stop-loss logic from scratch, LuciTech offers these critical functionalities out-of-the-box. The inclusion of dynamic position sizing based on a user-defined risk percentage, a configurable risk-to-reward ratio, and an intelligent breakeven mechanism significantly elevates its utility. This comprehensive approach to capital preservation and profit targeting is a cornerstone of professional trading and is often overlooked or simplified in generic templates.
Furthermore, the template's provision for multiple stop-loss calculation types—ATR-based for volatility adaptation, and candle-based for structural support/resistance—demonstrates a deep understanding of diverse trading strategies. The underlying code for these calculations is already implemented, saving developers considerable time and effort. The subtle yet powerful inclusion of FVG (Fair Value Gap) related inputs also hints at advanced price action concepts, offering a sophisticated layer of analysis and execution that is not commonly found in general-purpose templates.
The advanced webhook alerting system, with its support for various JSON formats tailored for platforms like Telegram, showcases an originality in catering to the needs of modern, automated trading setups. This moves beyond simple TradingView pop-up alerts, enabling seamless integration with external systems for real-time trade monitoring and execution. This level of external connectivity and customizable data output is a significant differentiator.
In essence, the LuciTech Strategy Template is original not just in its individual features, but in how these features are cohesively integrated to form a powerful, opinionated, yet highly adaptable system. It empowers traders to focus their creative energy on developing their core entry/exit signals, confident that the underlying framework will handle the complexities of risk management, trade execution, and external communication with precision and flexibility. It's a comprehensive solution designed to accelerate the development of robust and professional trading strategies.
How to Modify the Logic to Apply Your Strategy
The LuciTech Strategy Template is designed with modularity in mind, making it exceptionally straightforward to integrate your unique trading strategy logic. The template provides a clear separation between the core strategy management (risk, position sizing, exits) and the entry signal generation. This allows you to easily plug in your own buy and sell conditions without altering the robust underlying framework.
Here’s a step-by-step guide on how to adapt the template to your specific trading strategy:
1.
Locate the Strategy Logic Section:
Open the Pine Script editor in TradingView and navigate to the section clearly marked with the comment //Strategy Logic Example:. This is where the template’s placeholder entry conditions (a simple moving average crossover) are defined.
2.
Define Your Custom Entry Conditions:
Within this section, you will find variables such as longCondition and shortCondition. These are boolean variables that determine when a long or short trade should be initiated. Replace the existing example logic with your own custom buy and sell conditions. Your conditions can be based on any combination of indicators, price action patterns, candlestick formations, or other market analysis techniques. For example, if your strategy involves a combination of RSI and MACD, you would define longCondition as (rsi > 50 and macd_line > signal_line) and shortCondition as (rsi < 50 and macd_line < signal_line).
3.
Leverage the Template’s Built-in Features:
Once your longCondition and shortCondition are defined, the rest of the template automatically takes over. The integrated risk management module will calculate the appropriate position size based on your Risk % input and the chosen Stop Loss Type. The Risk:Reward ratio will determine your take-profit levels, and the Breakeven at R feature will manage your stop-loss dynamically. The time filter (Use Time Filter) will ensure your trades only occur within your specified hours, and the webhook alerts will notify you of trade executions.

Synthetic Point & Figure on RSIHere is a detailed description and user guide for the Synthetic Point & Figure RSI indicator, including how to use it for long and short trade considerations:
*
## Synthetic Point & Figure RSI Indicator – User Guide
### What It Is
This indicator applies classic Point & Figure (P&F) charting logic to the Relative Strength Index (RSI) instead of price. It transforms the RSI into synthetic “P&F candles” that filter out noise and highlight significant momentum moves and reversals based on configurable box size and reversal settings.
### How It Works
- The RSI is calculated normally over the selected length.
- The P&F engine tracks movements in the RSI above or below a defined “box size,” creating columns that switch direction only after a larger reversal.
- The synthetic candles connect these filtered RSI values visually, reducing false noise and emphasizing strong RSI trends.
- Optional EMA and SMA overlays on the synthetic P&F RSI allow smoother trend signals.
- Reference RSI levels at 33, 40, 50, 60, and 66 provide further context for momentum strength.
### How to Use for Trading
#### Long (Buy) Considerations
- The synthetic P&F RSI candle direction flips to *up (green candles)* indicating strength in momentum.
- Look for the RSI P&F value moving above the *40 or 50 level*, suggesting increasing bullish momentum.
- Confirmation is stronger if the synthetic RSI is above the EMA or SMA overlays.
- Ideal entries are after a reversal from a synthetic P&F downtrend (red candles) to an uptrend (green candles) near or above these levels.
#### Short (Sell) Considerations
- The candle direction flips to *down (red candles)*, showing weakening momentum or bearish reversal.
- Monitor if the synthetic RSI falls below the *60 or 50 level*, signaling momentum loss.
- Confirm bearish bias if the price is below the EMA or SMA overlays.
- Exit or short positions are signaled when the synthetic candle reverses from green to red near or below these threshold levels.
### Important RSI Levels to Watch
- *Level 33*: Lower bound indicating deep oversold conditions.
- *Level 40*: Early bullish zone suggesting momentum improvement.
- *Level 50*: Neutral midpoint; crossing above often signals bullish strength, below signals weakness.
- *Level 60*: Advanced bullish momentum; breaking below signals potential reversal.
- *Level 66*: Strong overbought area warning of possible pullback.
### Tips
- Use in conjunction with price action analysis and other volume/trend indicators for higher conviction.
- Adjust box size and reversal settings based on instrument volatility and timeframe for ideal filtering.
- The P&F RSI is best for identifying sustained momentum trends and avoiding false RSI whipsaws.
- Combine this indicator’s signals with stop-loss and risk management strategies.
*
This indicator converts RSI momentum analysis into a simplified, noise-filtered P&F chart format, helping traders better visualize and trade momentum shifts. It is especially useful when RSI signal noise can cause confusion in volatile markets.
Let me know if you want me to generate a shorter summary or code alerts based on these levels!
Sources
Relative Strength Index (RSI) — Indicators and Strategies in.tradingview.com
Indicators and strategies in.tradingview.com
Relative Strength Index (RSI) Indicator: Tutorial www.youtube.com
Stochastic RSI (STOCH RSI) in.tradingview.com
RSI Strategy docs.algotest.in
Stochastic RSI Indicator: Tutorial www.youtube.com
Relative Strength Index (RSI): What It Is, How It Works, and ... www.investopedia.com
rsi — Indicators and Strategies in.tradingview.com
Relative Strength Index (RSI) in.tradingview.com
Relative Strength Index (RSI) — Indicators and Strategies www.tradingview.com

Apex Edge – Wolfe Wave HunterApex Edge – Wolfe Wave Hunter
The modern Wolfe Wave, rebuilt for the algo era
This isn’t just another Wolfe Wave indicator. Classic Wolfe detection is rigid, outdated, and rarely tradable. Apex Edge – Wolfe Wave Hunter re-engineers the pattern into a modern, SMC-driven model that adapts to today’s liquidity-dominated markets. It’s not about drawing pretty shapes – it’s about extracting precision entries with asymmetric risk-to-reward potential.
🔎 What it does
Automatic Wolfe Wave Detection
Identifies bullish and bearish Wolfe Wave structures using pivot-based logic, symmetry filters, and slope tolerances.
Channel Glow Zones
Highlights the Wolfe channel and projects it forward into the future (bars are user-defined). This allows you to see the full potential of the trade before price even begins its move.
Stop Loss (SL) & Entry Arrow
At the completion of Wave 5, the algo prints a Stop Loss line and a tiny entry arrow (green for bullish, red for bearish). but the colours can be changed in user settings. This is the “execution point” — where the Wolfe setup becomes tradable.
Target Projection Lines
TP1 (EPA): Derived from the traditional 1–4 line projection.
TP2 (1.272 Fib): Optional secondary profit target.
TP3 (1.618 Fib): Optional extended target for large runners.
All TP lines extend into the future, so you can track them as price evolves.
Volume Confirmation (optional)
A relative volume filter ensures Wave 5 is formed with meaningful market participation before a setup is confirmed.
Alerts (ready out of the box)
Custom alerts can be fired whenever a bullish or bearish Wolfe Wave is confirmed. No need to babysit the charts — let the script notify you.
⚙️ Customisation & User Control
Every trader’s market and style is different. That’s why Wolfe Wave Hunter is fully customisable:
Arrow Colours & Size
Works on both light and dark charts. Choose your own bullish/bearish entry arrow colours for maximum visibility.
Tolerance Levels
Adjust symmetry and slope tolerance to refine how strict the channel rules are.
Tighter settings = fewer but cleaner zones.
Looser settings = more frequent setups, but with slightly lower structural quality.
Channel Glow Projection
Define how many bars forward the channel is drawn. This controls how far into the future your Wolfe zones are extended.
Stop Loss Line Length
Keep the SL visible without it extending infinitely across your chart.
Take Profit Line Colors
Each TP projection can be styled to your preference, allowing you to clearly separate TP1, TP2, and TP3.
This isn’t a one-size-fits-all tool. You can shape Wolfe detection logic to match the pairs, timeframes, and market conditions you trade most.
🚀 Why it’s different
Classic Wolfe waves are rare — this script adapts the model into something practical and tradeable in modern markets.
Liquidity-aligned — many setups align with structural sweeps of Wave 3 liquidity before driving into profit.
Entry built-in — most Wolfe scripts only draw the structure. Wolfe Wave Hunter gives you a precise entry point, SL, and projected TPs.
Backtest-friendly — you’ll quickly discover which assets respect Wolfe waves and which don’t, creating your own high-probability Wolfe watchlist.
⚠️ Limitations & Disclaimer
Not all markets respect Wolfe Waves. Some FX pairs, metals, and indices respect the structure beautifully; others do not. Backtest and create your own shortlist.
No guaranteed sweeps. Many entries occur after a liquidity sweep of Wave 3, but not all. The algo is designed to detect Wolfe completion, not enforce textbook liquidity rules.
Probabilistic, not predictive. Wolfe setups don’t win every time. Always use risk management.
High-RR focus. This is not a high-frequency tool. It’s designed for precision, asymmetric setups where risk is small and reward potential is large.
✅ The Bottom Line
Apex Edge – Wolfe Wave Hunter is a modern reimagination of the Wolfe Wave. It blends structural geometry, liquidity dynamics, and algo-driven execution into a single tool that:
Detects the pattern automatically
Provides SL, entry, and TP levels
Offers alerts for hands-off trading
Allows deep customisation for different markets
When it hits, it delivers outstanding risk-to-reward. Backtest, refine your tolerances, and build your watchlist of assets where Wolfe structures consistently pay.
This isn’t just Wolfe detection — it’s Wolfe trading, rebuilt for the modern trader.
Developer Notes - As always with the Apex Edge Brand, user feedback and recommendations will always be respected. Simply drop us a message with your comments and we will endeavour to address your needs in future version updates.

Parametric Multiplier Backtester🧪 An experimental educational tool for visual market analysis and idea testing through the multiplication and interaction of core technical parameters. It allows you to observe in real time how the combination of indicators affects the resulting curve and the potential efficiency of trading strategies.
📖 Detailed Description
1. Philosophy & Purpose of the Tool
This backtester is not created to search for the “Holy Grail,” but for deep learning and analysis. It is intended for:
👶 Beginner traders – to visually understand how basic indicators work and interact with each other.
🧠 Experienced analysts – to search for new ideas and non-obvious relationships between different aspects of the market (trend, volatility, momentum, volume).
The core idea is combining parameters through multiplication.
👉 Why multiplication? Unlike simple addition, multiplication strengthens signals only when several factors align in the same direction. If at least one parameter shows weakness (close to zero in normalized form), it suppresses the overall result, serving as a filter for false signals.
2. How does it work?
Step 1: Parameter Selection
The tool gathers data from 9 popular indicators: 📈 Price, RSI, ADX, Momentum, ROC, ATR, Volume, Acceleration, Slope.
Step 2: Normalization
Since these indicators differ in nature and scale (e.g., RSI from 0–100 vs ATR in points), they are brought to a unified range. Each parameter is normalized within a given period (Normalization Period). This is the key step for proper functioning.
Step 3: Multiplication
The parameters enabled by the user are multiplied, creating a new derived value — Product Line. This line is an aggregated reflection of the selected market model.
Step 4: Smoothing
The resulting line can be noisy. The Smooth Product Line function (via SMA) reduces noise and highlights the main trend.
Step 5: Interpretation
The smoothed Product Line is compared with its own moving average (Mean Line). Crossovers generate trading signals.
3. What conclusions can be drawn from multiplying parameters?
⚡ RSI × Momentum × Volume – Strength of momentum confirmed by volume. High values may indicate strong, volume-backed moves.
📊 ADX × ATR – Strength of trend and its volatility. High values may signal the beginning of a strong trending move with high volatility.
🚀 Price × Slope × Acceleration – Combined speed and acceleration of the trend. Shows not only where price is going, but with what acceleration.
❌ Disabling parameters – By turning parameters on/off (e.g., Volume), you can instantly see how important each factor is for the current market situation.
4. Real-Time Mode & Instant Feedback
The main educational value of this tool is interactivity:
🔄 Turn indicators on/off in real time.
⏱ Change their periods and instantly observe how the Product Line shape and behavior changes.
📉 Immediately see how these changes affect historical trading signals (blue/red arrows) and strategy performance metrics (Profit Factor, Net Profit, etc.).
This process develops “market intuition” and helps understand which settings work better under different conditions (trend vs range).
5. Default Settings & Recommendations
⚙️ Default settings are optimized for demonstration on the 4H timeframe of the SOLUSDT crypto pair.
Parameter Settings: Switch group (Use RSI, Use ADX, etc.).
Normalization Period (20): Lower = more sensitive, Higher = smoother.
Smooth Product Line (true): Enabled by default for clarity.
Smoothing Period (200): Main sensitivity setting.
Trend Filter: Optional 200-SMA filter. Strategy trades only in the main trend direction.
⚠️ Important Warning: This is an experimental & educational tool. The signals it generates are the result of a mathematical model and are not a ready-to-use trading strategy. Always backtest ideas and apply risk management before risking real money.

Dynamic EMA Stack Support & ResistanceEvery trader needs reliable support and resistance — but static zones and lagging indicators won't cut it in fast-moving markets. This script combines a Fibonacci-based 5-EMA stacking system and left/right pivots that create dynamic support & resistance logic to uncover real-time structural shifts & momentum zones that actually adapt to price action. This isn’t just a mashup — it’s a complete built-from-the-ground-up support & resistance engine designed for scalpers, intraday traders, and trend followers alike.
🧠 🧠 🧠What It Does🧠 🧠 🧠
This script uses two powerful engines working in sync:
1️⃣ EMA Stack (5-EMA Framework)
Built on Fibonacci-based lengths: 5, 8, 13, 21, 34, (configurable) this stack identifies:
🔹 Bullish Stack: EMAs aligned from fastest to slowest (uptrend confirmation)
🔹 Bearish Stack: EMAs aligned inversely (downtrend confirmation)
🟡 Narrowing Zones: When EMAs compress within ATR thresholds → possible breakout or reversal zone
🎯 Labels identify key transitions like:
✅"Begin Bear Trend?"
✅"Uptrend SPRT"
✅"RES?" (resistance test)
2️⃣ Pivot-Based Projection Engine
Using classic Left/Right Bar pivot logic, the script:
📌 Detects early-stage swing highs/lows before full confirmation
📈 Projects horizontal S/R lines that adapt to market structure
🔁 Keeps lines active until a new pivot replaces them
🧩 Syncs beautifully with EMA stack for confluence zones
🎯🎯🎯Key Features for Traders🎯🎯🎯
✅ Trend Detection
→ EMA order reveals real-time bias (bullish, bearish, compression)
✅ Dynamic S/R Zones
→ Historical support/resistance levels auto-draw and extend
✅ Smart Labeling
→ “SPRT”, “RES”, and “Trend?” labels for live context + testing logic
✅ Custom Candle Coloring
→ Choose from Bar Color or Full Candle Overlay modes
✅ Scalper & Swing Compatible
→ Use fast confirmations for scalping or stack consistency for longer trends
⚙️⚙️⚙️How to Use⚙️⚙️⚙️
✅Use Top/Bottom (trend state) Line Colors to quickly read trend conditions.
✅Use Pivot-based support/resistance projections to anticipate where price might pause or reverse.
✅Watch for yellow/blue zones to prepare for volatility shifts/reversals.
✅Combine with volume or momentum indicators for added confirmation.
📐📐📐Customization Options📐📐📐
✅EMA lengths (5, 8, 13, 21, 34) — fully configurable - try 21,34,55, 89, 144 for longer term trend states
✅Left/Right bar pivot settings (default: 21/5)
✅Label size, visibility, and color themes
✅Toggle line and label visibility for clean layouts
✅“Max Bars Back” to control how deep history is scanned safely
🛠🛠🛠Built-In Safeguards🛠🛠🛠
✅ATR-based filters to stabilize compression logic
✅Guarded lookback (max_bars_back) to avoid runtime errors
✅Works on any asset, any timeframe
🏁🏁🏁Final Word🏁🏁🏁
This script is not just a visual tool, it’s a complete trend and structure framework. Whether you're looking for clean trend alignment, dynamic support/resistance, or early warning labels, this system is tuned to help you react with confidence — not hindsight.
Rembember, no single indicator should be used in isolation. For best results, combine it with price action analysis, higher-timeframe context, and complementary tools like trendlines, moving averages etc Use it as part of a well-rounded trading approach to confirm setups — not to define them alone.
💡💡💡Turn logic into clarity. Structure into trades. And uncertainty into confidence.💡💡💡
